


1 Introduction
Atomic coherence has played a vital role in the field of quantum optics where it appeared as the key factor for numerous remarkable phenomena of light-mater interaction.[1-2] Some well known examples based on the idea of atomic coherence are the electromagnetic-induced transparencies (EIT), coherent population traps (CPT), and laser cooling (LC) of the atoms.[3-5] It also has a useful contribution in the progress made in the area of quantum information science and quantum computing.[6-9] Interestingly, it is also found very effective in understanding various aspects of photosynthesis in biological systems.[10]
The idea of micromaser has played a critical role in understanding the basics of light-matter interaction and its quick realization in the experiments. Scully et al. extended it in an entirely new scenario of mazer (microwave amplification via z-motion-induced emission of radiation), where instead of thermal atom an ultracold atom interacts with the field of a high quality cavity and the center-of-mass (c.m.) motion of the atom effects the interaction process. Such an interaction resembles to a scattering like process because here apart from transmission through the cavity the incident ultracold atoms may also have a reflection from the cavity.[11] A detailed theory of the two-level atom mazer (a special micromaser dealing with ultracold atom) was published in a series of interesting papers.[12-14] Meanwhile, recent developments in the field of laser cooling provide an opportunity of studying the ultracold atomic interactions with quantized electromagnetic fields.[15] In some interesting studies micromaser with cold atoms has been used for the velocity selection and quantum clock realization.[16-17]
The effect of atomic coherence and quantum interference have been incorporated in mazer interactions. The emission probabilities of multi-level atoms in the V-type and cascade configurations are found to behave very differently when the interacting atoms are prepared in the initial coherent superposition states.[18] Similarly, in case of two-level atomic interactions, the transmission probabilities in the ultracold regime are found to be significantly affected due to the presence of atomic coherence in the system.[19] It was also found that the driven coherence drastically modifies the photon emission probabilities of V-type,[20] and $\Lambda$-type[21] atomic interactions.
Quantum tunneling is a well established feature of the probabilistic nature of quantum mechanics. Among various definitions of tunneling time,[22-24] phase time is the one which is comprehensively analyzed both in theory and experiments.[25-28] Recently, Arun and Agarwal studied various aspects of the phase tunneling time of the interacting ultracold atoms.[29] The effects of dark states, off-resonant interactions, mode profile and multipartite potentials on the tunneling slow atoms are also investigated in quite detail.[30-32]
Here we study the tunneling of ultracold V-type atoms through a mazer cavity. The cavity is shined by a strong classical field that couples the two relevant states of the interacting atoms. After the interaction, atoms may have a transmission in any of the three possible states $|i\rangle$, where $i=(a,b,c)$. We find that the driven atomic coherence strongly modifies characteristics of the tunneling time. For the tunneling of V-type three-level atoms the phase time gets negative values (a superclassical character) for transmission in all of its respective states. Further, here we obtained superclassical values of the phase time corresponding to much higher values of the transmission amplitudes of the tunneling atoms, which may be advantageous in the possible experimental realization of the superclassical tunneling time of the traversing cold atoms. In addition, we also obtained a mirror type symmetry in the behavior of phase time for appropriate strengths of the atomic coherence.
The main structure of the manuscript is as follows. Section~2 presents our model and its dynamics in the vacuum field of the coherently driven mazer cavity. In Sec. 3, we discuss results of the phase time for various controlling parameters of the system. Finally, in Sec. 4, we conclude major findings of this work.
2 Model and Dynamics
We consider a beam of ultracold three-level atoms in the V-type configuration interacting a mazer cavity of length $L$. These atoms are shined by a coherent driving field of frequency $\Omega$, which couples the lower state $|b\rangle$ with state $|c\rangle$ (see Fig. 1(b)). The atomic flux along ${z}$-axis is fixed in a way that no two atoms can have a simultaneous interaction with the cavity i.e., they enter the cavity one after the other. The incident atom is prepared in the excited state, which interacts with the cavity being prepared in the initial vacuum state. A photon may be emitted due to a transition from level $|a\rangle$ to $|b\rangle$, which is then coupled to $|c\rangle$ due to the driving field. For the interacting cold atoms their c.m. motion should be dealt with quantum mechanical approach. The system's Hamiltonian may be written in the form (dipole and rotating wave approximations are incorporated)
$ H=H_{\rm af}+H_{\rm int} , $
where
$ H_{\rm af}=\frac{p_{z}^2}{2m}+\hbar\omega a^\dagger_1 a_1+\hbar \sum_{i=a,b,c}\omega_i|i\rangle \langle i| , $
$ H_{\rm int}= \hbar g u(z)(a^\dagger_1|b\rangle\langle a| +a_1|a\rangle\langle b|) \\ \hphantom{H_{\rm int}=} + \hbar u(z)(\Omega^* |b\rangle \langle c|+\Omega|c \rangle\langle b|) . $
Here $H_{\rm af}$ is Hamiltonian of the free atom and field while $H_{\rm int}$ is the interaction Hamiltonian which incorporates the effects of driving coherence. The c.m. momentum in the ${z}$ direction is given by $p_z$ while ${m}$ denotes mass of the interacting atom. The parameter $a_1 (a^\dagger_1)$ corresponds to the destruction (creation) operator of the cavity mode with frequency $\omega$ while $g$ and $\Omega$ are respectively the coupling strength and frequency of the driving field. We used a notation $|i\rangle\langle i|\;( i=a,b,c)$ for population in the respective state $|i\rangle$ and $|i\rangle\langle j|\;( i,j=a,b,c; i\neq j)$ for a transition from level $| j\rangle$ to $|i\rangle$. In our analysis, we consider a mesa mode function $u(z)$, which describes the case where the atom-field coupling remains constant along the propagation axis and vanishes everywhere outside the cavity i.e.,
$ u(z)=\left\{\begin{matrix} 1 & \ \ {\rm for} \ \ 0<z<L ,\\ 0 & \ \ {\rm otherwise}. \end{matrix}\right. $
Such a mode function with sharp cut-off in the ${z}$-direction corresponds to TM mode of a cylindrical cavity[13] and depicts a simplified mode profile of a micromaser cavity.[11-13] However, there are some interesting studies considering the secant hyperbolic, sinusoidal and Gaussian mode profiles for analyzing the emission probabilities in the atom-cavity interaction.[13,33-35] In our earlier study, we considered effects of the mode profile on behavior of the phase time for the tunneling of ultracold atoms.[31]
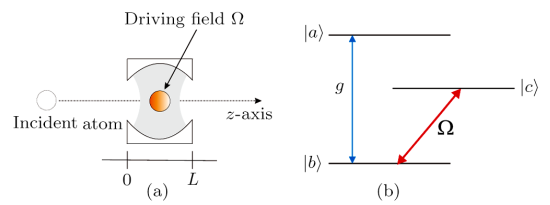
Fig. 1 (Color online) In (a) we have shown schematics of the interaction of ultracold atom with the field of a high quality cavity in the presence of external driving field $\Omega$. The level structure diagram (V-type three-level configuration) of the interacting ultracold atom is given in (b). |
Considering the resonant condition when the atomic transition frequency ($\omega_{ab}$) perfectly matches with that of the cavity field ($\omega$), the matrix elements of the interaction Hamiltonian corresponding to the triplet manifolds $|a,n\rangle$, $|b, n+1\rangle$ and $|c, n+1\rangle$ is given by (we take $\hbar=1$)
$ M=\left(\begin{matrix} 0 & g \sqrt{n+1} & 0 \\ g \sqrt{n+1} & 0 & \Omega \\ 0 & \Omega^* & 0 \\ \end{matrix} \right), $
with $n$ as the number of photon inside the single-mode cavity. The eigenvalues and eigenstates of the system may be thus obtained as[20]
$ U^0_n=0 , \quad U^\pm_n=\pm \sqrt{\chi^2_n+|\Omega|^2} , $
$ |\phi^0_n\rangle=\frac{\Omega}{\sqrt{\chi^2_n+|\Omega|^2}}|a,n\rangle-\frac{\chi_n}{\sqrt{\chi^2_n+|\Omega|^2}}|c,n+1\rangle , \\ |\phi^\pm_n\rangle=\frac{\sqrt{2}}{2}(\frac{\chi_n}{\sqrt{\chi^2_n+|\Omega|^2}}|a,n\rangle\pm|b,n+1\rangle \\ +\frac{\Omega^*}{\sqrt{\chi^2_n+|\Omega|^2}} |c,n+1\rangle ) .$
Here $\chi_n =g\sqrt{n+1}$ is the coupling function of the interaction process. It may be noted that the component of the wave function related to $|\phi^+_n\rangle$ ($|\phi^-_n\rangle$) tackles a barrier (well) of magnitude $U^+_n$ ($U^-_n$). Likewise, the wave function related to $|\phi^0_n\rangle$ remains uninterrupted as it experiences zero potential due to the appearance of the dark states.
2.1 Scattering Amplitudes
When an atom in the excited state interacts with a cavity with $n$ number of photons, state of the system in the dressed state basis ($|\phi^j_n\rangle, j=0,+,-$) may be given as
$ |a,n\rangle=\Big(\frac{\Omega^*}{\sqrt{\chi^2_n+|\Omega|^2}}|\phi^0_n\rangle+\frac{\sqrt{2}}{2}\frac{\chi_n}{\sqrt{\chi^2_n+|\Omega|^2}} \\ \times (|\phi^+_n\rangle+|\phi^-_n\rangle)\Big) . $
$ |\Psi(z,0)\rangle=\int dk A(k) e^{i kz}\theta(-z) \Big(\frac{\Omega^*}{\sqrt{\chi^2_n+|\Omega|^2}}|\phi^0_n\rangle \\ +\frac{\sqrt{2}}{2}\frac{\chi_n}{\sqrt{\chi^2_n+|\Omega|^2}} (|\phi^+_n\rangle+|\phi^-_n\rangle)\Big) . $
Here the amplitudes $A(k)$ take care of the c.m. motion of the incident free atom and $\theta$ is the Heaviside's function indicating position of the atom related to the two ends of the cavity. By applying the time dependent Schrödinger equation on each component of $|\phi^j_n\rangle$, the scattered wave function takes the form
$ |\Psi(z,t)\rangle=\int dkA(k) e^{-i({k^2}/{2m})t}\Big[ e^{ikz}\theta(z-L)\\ \times \frac{\Omega^*}{\sqrt{\chi^2_n+|\Omega|^2}}|\phi^0_n\rangle +\frac{\sqrt{2}}{2}\frac{\chi_n}{\sqrt{\chi^2_n+|\Omega|^2}} \\ \times(\{\rho^+_n e^{-i kz}\theta(-z)+\tau^+_ne^{i kz}\theta(z-L)\}|\phi^+_n\rangle \\ +\{\rho^-_n e^{-i kz}\theta(-z)+\tau^-_ne^{i kz}\theta(z-L)\}|\phi^-_n\rangle)\Big] . $
Here $t$ is the time of interaction of the tunneling process and $\tau^\pm_n (\rho^\pm_n)$ are the transmission (reflection) amplitudes for the barrier-well potentials given as[11]
$ \tau^\pm_n(k)=\exp(-i kL)[\cos(K^\pm_n L)-i\Sigma^\pm_n(k)\sin(K^\pm_n L)]^{-1} , \\ \rho^\pm_n(k)=i \Delta^\pm_n(k) \sin(K^\pm_n L)\tau^\pm_n(k) .$
Various parameters are related as
$ K^\pm_n= \sqrt{k^2\mp k^2_n} , \quad k_n=2m\sqrt{\chi^2_n+|\Omega|^2} , \\ \Sigma^\pm_n(k)=\frac{1}{2}\Big(\frac{K^\pm_n}{k}+\frac{k}{K^\pm_n}\Big) ,\\ \Delta^\pm_n(k)=\frac{1}{2}\Big(\frac{K^\pm_n}{k}-\frac{k}{K^\pm_n}\Big) .$
Now using Eq. (7) in Eq. (10), we have
$ |\Psi(z,t)\rangle=\int dkA(k)e^{-i({k^2}/{2m})t}\\ \times [(R_{a,n}e^{-i kz}\theta(-z) +T_{a,n} e^{i kz}\theta(z-L))|a,n\rangle \\ +\big(R_{b,n+1}e^{-i kz}\theta(-z)+T_{b,n+1}e^{i kz}\theta(z-L)\big) \\ \times|b,n+1\rangle +\big(R_{c,n+1}e^{-i kz}\theta(-z)+T_{c,n+1} \\ \times e^{i kz}\theta(z-L)\big)|c,n+1\rangle\Big] . $
In the current problem, we are interested in the transmission part of the scattering where
$ T_{a,n} =\frac{1}{2}\frac{\chi^2_n}{\chi^2_n+|\Omega|^2} (\tau^+_n+\tau^-_{n})+\Big(\frac{|\Omega|^2}{\chi^2_n+|\Omega|^2}\Big) , $
is the amplitude for transmission in the excited state $|a,n\rangle$, while
$ T_{b,n+1} = \frac{\chi_n}{2\sqrt{\chi^2_n+|\Omega|^2}}(\tau^+_n-\tau^-_{n}) , $
is the amplitude for transmission in state $|b,n+1\rangle$. Similarly, the transmission amplitude in state $|c,n+1\rangle$ is given by
$ T_{c,n+1} =\frac{1}{2}\frac{\chi_n\Omega^*}{\chi^2_n+|\Omega|^2} (\tau^+_n-\tau^-_{n})-\Big(\frac{\chi_n\Omega^*}{\chi^2_n+|\Omega|^2}\Big) . $
Here additional terms in Eqs. (13) and (15) signify contribution of the dark states for these transmissions. Effects of the atomic coherence are incorporated as indicated by the presence of the parameter $\Omega$ in the expression for the transmission amplitudes. It is clear that for $\Omega=0,$ Eqs. (13)-(15) reduce to the results presented in Ref. [11], which is fare enough as our system drops to a simple two-level arrangement for this special case.
2.2 Relation for the Phase Time
The transmission amplitudes of Eqs. (13)-(15) may be used to find a relation for the tunneling time of the transmitting cold atoms. As the amplitudes contain the parameter of the atomic coherence ($\Omega$) therefore, the resulting phase time must also be affected by the presence of the external driving field. Now considering the situation where atoms transmit in the state $|a,n\rangle$, the relevant amplitude of transmission is $T_{a,0}\equiv|T_{a,0}|e^{i \phi (k)}$. We define $k_0$ as the specific wave number for which the c.m. energy of the interacting atoms just matches with the height of the barrier $U^+_n$ i.e., $\hbar \chi_n\equiv\hbar^2 k^2_0/2m$. We assumed that the incident atoms are associated with a Gaussian wave packet of amplitude $A(k)=\exp(-(k-\bar{k})^2/\sigma^2)$. Here $\bar{k}$ and $\sigma$ are the two important parameters representing the mean wave number and width of the Gaussian wave. At the exit of the cavity ($z\geq L$), the normalized wave function of the system may be written as
$ |\Psi_T(z,t)\rangle=(2\pi)^{-3/4}\sqrt{\frac{2}{\sigma}}\int^{\infty}_{-\infty}dk exp(-(k-\bar{k})^2/\sigma^2)\\ \times e^{{-i} (\hbar k^2/2m)t}|T_{a,0}|e^{i \phi (k)} e^{ikz}|a,0\rangle . $
The above integrand can be evaluated approximately by using Taylor expansion of the transmission amplitude. At $k=\bar{k}$ for small width ($\sigma$) of the atomic wave packet, the envelop $|\langle a,0|\Psi_T(z,t)\rangle|^2$ gets the peak value where contribution of the total phase ($\Theta(k)=kL+\phi(k)-(\hbar k^2/2m)t$) of the integrand is maximum. It leads to the relation of the phase time of traversal.[29]
$ t_{\rm ph}=\frac{m}{\hbar k}\Big[\frac{\partial\phi}{\partial k}+L\Big]\Big|_{k=\bar{k}} .$
It is obvious that for propagation through the free space there will be no phase shift i.e., ${\partial\phi}/{\partial k}=0$, consequently, the wave packet's peak will travel a distance $L$ through the mazer cavity in time $t_{\rm cl}\equiv mL/\hbar \bar{k}$, which will be referred as the classical traversal time in the upcoming discussions.
3 Results and Discussion
We study the tunneling of ultracold V-type atoms through a high quality mazer cavity. A beam of ultracold atoms in the state $|a,0\rangle$ interact with a cavity in vacuum state. Meanwhile, an external driving field couples the two lower states ($|b,1\rangle$, $|c,1\rangle$) of the incident atoms. Such an interaction is like a scattering process for which the transmission amplitudes are given in Eqs. (13)-(15), which are further used for calculation of the phase time of transmission. Here we show that how the phase tunneling time for the V-type transmitting atoms is affected by an external driving field.
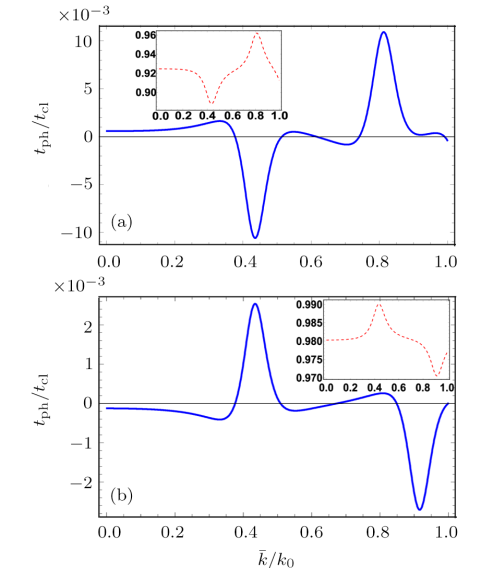
Fig. 2 (Color online) The scaled phase time (solid curve) for the tunneling of three-level atoms in state $|a,0\rangle$ versus the mean wave number $\bar{k}/k_0$. The corresponding transmission probability $|T_{a,0}|^2$ is shown as dashed curve in the inset. Other parameters are $k_0L=10 \pi$, (a) $\tilde {\Omega}=\Omega/g=5$, and (b) $\tilde {\Omega}=\Omega/g=10$. |
In Fig. 2, we show phase tunneling time (solid line) vs. the mean wave number $\bar{k}/k_0$ for transmission in the excited state $|a,0\rangle$. We take the cavity in the initial vacuum state with an interaction length of $k_0L=10 \pi$. It may be pointed out that for $\Omega=400$ kHz, $g=(100-10)$~kHz, and $\bar{k}/k_0=0.1$, temperature of the atoms is in the range $(10^{-7}-10^{-8})$~K.[36] For $\tilde {\Omega}=0$, we obtained the results mentioned in Ref. [29] for the resonant two-level atomic interactions. The scaled time ratio is smaller than unity ($t_{\rm ph}/t_{\rm cl}<1$), which corresponds to a superclassical traversal of the transmitting atoms. However, if we select a driving field of magnitude $\tilde {\Omega}=\Omega/g=5$, behavior of the phase time is changed dramatically as shown in Fig. 2(a). Here we obtained a negative peak in the phase time values around ($\bar{k}/k_0\approx0.44$) in contrast to the zero driving field case. Thus for an appropriate choice of the driving field, one may switch phase time from positive to negative values. Negative values of the phase time are due to the interference between the reflected and the incident wave packets associated with the interacting atoms. It has an analogy with the realization of negative group velocities of the electromagnetic pulses propagating through a dielectric medium.[37]
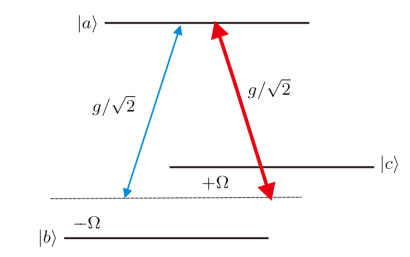
Fig. 3 (Color online) A dressed state realization of the coherently driven V-type three-level system given in Fig. 1(b). |
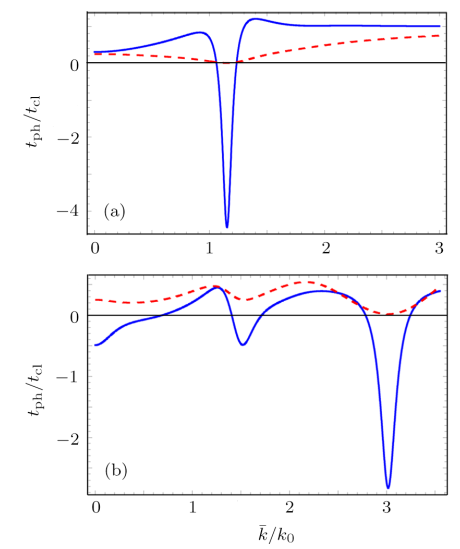
Fig. 4 (Color online) The scaled phase time (solid curve) for the tunneling of three-level atoms in state $|a,0\rangle$ versus the mean wave number $\bar{k}/k_0$. The corresponding transmission probability $|T_{a,0}|^2$ is shown in dashed curves. Other parameters are $k_0L=\pi$, (a) $\tilde {\Omega}=0$, and (b) $\tilde {\Omega}=2$. |
In Fig. 2(b), we adjust the driving field to a value $\tilde {\Omega}=10$ and obtain a mirror image of the curve given in Fig. 2(a). Here the tunneling time exhibits an alternate positive and negative character with increasing energies of the atoms. It indicates that $\tilde {\Omega}$ provides an excellent control of the phase time behavior of the tunneling atoms. Secondly, the superclassical nature of the phase time corresponds to a much higher transmission probability (0.99) as compared to the previous study,[29] where it was less than 0.1. This may be favorable in the possible experimental realization of the superclassical tunneling time of the traversing cold atoms. In the current system, for a strong enough driving field transmission in the lower states may be strongly suppressed by blocking any emission of photon during the interaction process. In Ref. [38], the dressed state picture for a clear realization of the V-type multi-level atomic interactions in the presence of a coherent driving field is presented where the resulting atom-field interaction could be depicted as shown in Fig. 3. When a driving field of strength $\Omega$ is applied, it creates two different channels $(|a\rangle \rightarrow |b\rangle,|a\rangle \rightarrow |c\rangle)$ for photon emission with detunings $\pm\Omega$. As a result of the additional channel $(|a\rangle \rightarrow |c\rangle)$, the probability of a photon emission increases. However, a strong enough driving field may generate such a large detunings that it almost block the photon emission process.
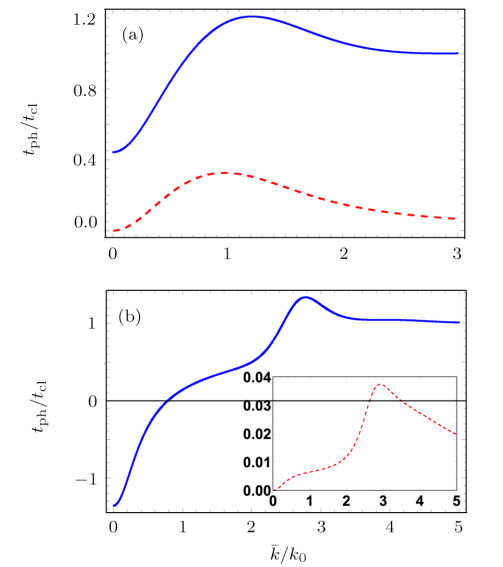
Fig. 5 (Color online) The scaled phase time (solid curve) for the tunneling of three-level atoms in state $|b,1\rangle$ versus the mean wave number $\bar{k}/k_0$. The corresponding transmission probability $|T_{b,1}|^2$ is shown in dashed curves. Here, $k_0L=\pi/2$, (a) $\tilde {\Omega}=0.5$, and (b) $\tilde {\Omega}=5$. |
Next, we plot the results of our numerical simulations for a smaller cavity length $k_0L=\pi$. For $\tilde {\Omega}=0$, phase time is positive for ultracold atoms with $\bar{k}/k_0\leq1$. There is a large negative peak of the phase time at $\bar{k}/k_0=1.15$, which joins the classical limit for $\bar{k}/k_0 \gg1$ (see Fig. 4(a)). For $\tilde{\Omega}= 2$ in Fig. 4(b), we obtained a result which shows that the phase time alternatively gets negative and positive values with an increase in the parameter $\bar{k}/k_0$. It can be noticed that the phase time curve has the same resonant pattern as that exhibited by the transmission probability. Actually, the resonant peaks in these curves appear for the c.m. energy of the atom satisfying the condition $L=l (\lambda_{\rm dB})/2$.[12] Here ${l}$ is an integer and $\lambda_{\rm dB}$ is the de Broglie wave of the interacting atoms.
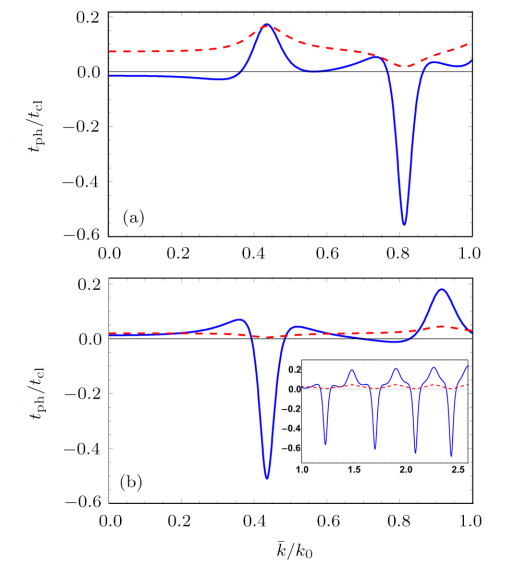
Fig. 6 (Color online) The scaled phase time (solid curve) for the tunneling of three-level atoms in state $|c,1\rangle$ versus the mean wave number $\bar{k}/k_0$. Here the corresponding transmission probability $|T_{c,1}|^2$ (dashed curve) is shown two times of the actual value for the clarity purpose. Other parameters are $k_0L=10\pi$, and (a) $\tilde {\Omega}=5.0$, and (b) $\tilde {\Omega}=10$. In the inset of (b) phase time is shown for longer range of $\bar{k}/k_0$. |
The above mentioned results were related to the tunneling atoms transmitting in the state $|a,0\rangle$. Next, we consider the case where the atom emits a photon inside the cavity and tunnel in the lower state $|b,1\rangle$ or $|c,1\rangle$. In Fig. 5(a) for $\tilde {\Omega}=0.5$, the scaled time ratio is positive ($t_{\rm ph}/t_{\rm cl}>0$) and the tunneling atoms display both super and subclassical characters for increasing momentum. When the external field is changed to $\tilde {\Omega}=5$, then phase time becomes negative in the ultracold regime and gets its classical limit in the thermal regime (see Fig. 5(b)). This shows that for transmission in the state $|b,1\rangle$ the switching behavior of the phase time is obtained by tuning the external field $\tilde{\Omega}$.

Fig. 7 (Color online) The scaled phase time (solid curve) and transmission probability (dashed curve) for transmission of a three-level atom in state $|c,1\rangle$ vs. the mean wave number. Here, $k_0L=\pi/2$, (a) $\tilde {\Omega}=2.5$, and (b) $\tilde {\Omega}=5.0$. |
Further, we illuminate the situation where the interacting atoms are finally transmitted in state $|c,1\rangle$. Our results for the phase time vs. mean wave number $\bar{k}/k_0$ are presented in Fig. 6. We take two different values of the driving field $\tilde {\Omega}=\Omega/g=5$ and $\tilde {\Omega}=\Omega/g=10$ by considering a cavity length $k_0L=10\pi$. Here phase time gets alternate positive and negative values for increasing energies of the ultracold atoms. The sub and superclassical peaks exchange their position along the momentum axis with variation in the driving field. Thus a mirror reversal like symmetry may be noticed by comparing Figs. 6(a) and 6(b). There is a replication of the over all pattern of the phase time with the increasing wave number as depicted in the inset of Fig. 6(b). It shows that here the mazer action (scattering nature of the interaction) may be realized for much higher range of energies of the incident atoms which was not the case in Ref. [29]. Next, we plot results for a cavity of length $k_0L=\pi/2$ using an external driving field of magnitude $\tilde {\Omega}=\Omega/g=2.5$. Our results show an alternate positive and negative character for the tunneling time with increasing energy of the incident atoms (see Fig. 7(a)). It is important to mention that here a much larger negative value is obtained at $\bar{k}/k_0=4$ as compared to Ref. [29]. When the driving field is increased to $\tilde {\Omega}=\Omega/g=5$ the phase time then behaves in a much different way as depicted in Fig. 7(b). It is now positive for smaller values of the mean wave number. Also negative peaks are of smaller magnitude as compared to Fig. 7(a). In the inset of Fig. 7(a) and in Fig. 7(c), plots of the corresponding transmission probabilities are shown which have the same pattern of resonances as exhibited by the phase time curves.
4 Conclusions
We considered the interaction of V-type driven atoms with vacuum field of a high quality mazer cavity. Prior to the interaction the incident atoms are taken in the state $|a,0\rangle$, while an external field ($\Omega$) couples the two lower levels of the atomic system once they enter into the cavity. During their passage through the interaction region these atoms experience two different fields i.e., the vacuum cavity field and the applied driving field ($\Omega$), which drastically changes the system dynamics. Due to the smaller energies of the incident ultracold atoms the interaction process turns into a scattering type phenomena with some nonzero reflection and transmission amplitudes.
Here, we addressed the issue of tunneling time of the ultrocold atoms through vacuum mode of the mazer cavity. For this purpose, we obtained the transmission amplitudes for all the three possible states of the incident atoms. Next, we use the transmission amplitude for obtaining a relation for the tunneling phase time of the ultracold atoms. The results of our numerical simulations show that for the tunneling V-type atoms the superclassical nature of the phase time may be achieved corresponding to much higher transmission probabilities, which may be favorable for the possible experimental realization of the superclassical transmission. Here a strong external field suppresses the photon emission and consequently a transmission in the lower states thus resulting a more than $90\%$ transmission probability in the initial excited state. We find that a mirror type symmetry in the phase time curve may be obtained by exploiting various parameters of the system. In addition, for transmission in the states $|a,0\rangle $ and $|c,1\rangle$ an alternate negative and positive nature of the phase time is realized which is replicated for further higher energies of the incident atoms. Therefore, here the mazer action regime is considerably extended due to the presence of the external driving field. Further, a fine tuning of the external driving field $\Omega$ causes switching of the phase time from sub to superclassical character.