


1 Introduction
Neutron stars as compact stars provide an excellent platform to study extreme matter conditions, extending to nuclear physics, particle physics, and general relativity. Recently, the gravitational wave event GW170817 has made neutron stars run into a hot topic.[1-3] In this field, massive neutron stars are of particular interest, which continuously challenge our traditional wisdom of hadronic systems. In 2013, a massive neutron star of $2.01\pm0.04\text{ }M_{\odot}$ was observed by Antoniadis et al.[4] and is named as PSR J0348+0432. It is important to build theoretical models to explain its observed properties.
In literature, various models have been proposed to explain the observed properties of PSR J0348+0432, such as the effective nonrelativistic potential models,[5] the relativistic mean field models,[6-9] the chiral effective lagrangians,[10] and the Brueckner-Hartree-Fock approaches.[11-12] In this work, we propose two new models on the hyperon couplings within the framework of the relativistic mean field theory, namely the limitation model and the potential well depth model, and see how the massive neutron star PSR J0348+0432 constrains on the parameter space.
The rest part of this work is organized as follows: In Sec. 2, we give a brief introduction to the RMFT for neutron stars. In Sec. 3, we give a detailed discussion on construction and selection of two hyperon coupling models. In Sec. 4, some results be provided and Sec. 5 ends this work with summaries.
2 Relativistic Mean Field Theory
The Lagrangian density with the octet baryons included is given as follows:[13]
$$ \mathcal{L}= \sum_{B}{\bar\Psi}_{B}({\rm i}\gamma_{\mu}\partial^{\mu}-{m}_{B}+g_{\sigma B}\sigma-g_{\omega B}\gamma_{\mu}\omega^{\mu} -\frac{1}{2}g_{\rho B}\gamma_{\mu}\tau\rho^{\mu})\Psi_{B}+\frac{1}{2} \left(\partial_{\mu}\sigma\partial^{\mu}\sigma-m_{\sigma}^{2}\sigma^{2}\right) -\frac{1}{4}\omega_{\mu \nu}\omega^{\mu \nu}+\frac{1}{2}m_{\omega}^{2}\omega_{\mu}\omega^{\mu} -\frac{1}{4}\rho_{\mu \nu}\rho^{\mu \nu}+\frac{1}{2}m_{\rho}^{2}\rho_{\mu}\rho^\mu -\frac{1}{3}g_{2}\sigma^{3}-\frac{1}{4}g_{3}\sigma^{4}+\sum_{l=e,\mu}{\bar\Psi}_{l} \left({\rm i}\gamma_{\mu}\partial^{\mu} -m_{l}\right)\Psi_{l}\,. $$
The energy density and pressure of a cold, stable and non-rotating neutron star can be read as:
$$ \mathbf{\varepsilon}=\frac{1}{3}g_{2}\sigma^{3}+\frac{1}{4}g_{3}\sigma^{4} +\frac{1}{2}m_{\sigma}^{2}\sigma^{2}+\frac{1}{2}m_{\omega}^{2}\omega_{0}^{2} +\frac{1}{2}m_{\rho}^{2}\rho_{03}^{2} +\sum_{B}\frac{2J_{B}+1}{2\pi^{2}}\int_{0}^{k_{B}}\sqrt{k^{2}+(m^{\ast})^{2}}k^{2}{\rm d}k +\sum_{l}\frac{1}{\pi^{2}}\int_{0}^{k_{l}}\sqrt{k^{2}+m_{l}^{2}}k^{2}{\rm d}k\,, $$
$$ P=-\frac{1}{3}g_{2}\sigma^{3}-\frac{1}{4}g_{3}\sigma^{4}-\frac{1}{2}m_{\sigma}^{2}\sigma^{2} +\frac{1}{2}m_{\omega}^{2}\omega_{0}^{2}+\frac{1}{2}m_{\rho}^{2}\rho_{03}^{2} +\frac{1}{3}\sum_{B}\frac{2J_{B}+1}{2\pi^{2}}\int_{0}^{k_{B}}\frac{k^{4}}{\sqrt{k^{2}+(m^{\ast})^{2}}}{\rm d}k +\frac{1}{3}\sum_{l}\frac{1}{\pi^{2}}\int_{0}^{k_{l}}\frac{k^{4}}{\sqrt{k^{2}+m_{l}^{2}}}{\rm d}k\,. $$
The physical signs of $B,l,m^{*}=m_{B}-g_{\sigma B}\sigma$ are baryon number, lepton number and effective mass, respectively.
What is more, the whole neutron star system also yields to charge neutrality and chemistry potential equilibrium:
$$ \sum_{B}q_{B}n_{B}-n_{e}-n_{\mu}=0\,, $$
$$ \mu_{\Xi^{-}}=\mu_{\Sigma^{-}}=\mu_{n}+\mu_{e}\,,\\ \mu_{\Lambda}=\mu_{\Xi^{0}}=\mu_{\Sigma^{0}}=\mu_{n}\,,\\ \mu_{\Sigma^{+}}=\mu_{p}=\mu_{n}-\mu_{e}\,. $$
From the Tolman-Oppenheimer-Volkoff equation, the mass and radius of a neutron star can be obtained:[14]
$$ \frac{\mathrm dp}{\mathrm dr}=-\frac{\left(p+\varepsilon\right)\left(M+4\pi r^{3}p\right)}{r \left(r-2M \right)}\,, $$
$$ M(r)=4\pi\int_{0}^{r}\varepsilon r^{2}\mathrm dr\,. $$
3 Limitation Model and Potential Well Depth Model
In this work, the nucleon parameters are taken from the well-known GL85 model and are reproduced here in Table 1. The $g_{i}\equiv g_{iN}$ denotes the nucleon-meson coupling constant, with the subscript $i=\sigma$, $\rho$, and $\omega$. $g_{2}$ and $g_{3}$ are the nonlinear coupling constants for the $\sigma$ sector. $\rho_{0}$, $B/A$, $K$, $a_{\rm sym}$, $m^{*}/m$ are the saturation density, the binding energy per nucleon, the compression modulus, the symmetry energy coefficient, and the effective mass, respectively. Compared with the nucleon parameters, the hyperon coupling constants are less known. In Ref. [15], only a broad range of $1/3\sim1$ is found.
Table 1 The nucleon coupling parameter sets GL85. |
 |
We propose two different models to describe the massive neutron stars. In both models,they adopt quark model (SU(6) symmetry)[16-18] in determining coupling parameters between $\rho$ meson and baryons, while, adopt two different methods in determining coupling parameters among $\sigma$ and $\omega$. We call one of them as limitation model, another as potential well depth model.
3.1 Limitation Model
For convenience's sake, we introduce the ratios between the hyperon coupling constants and the nucleon coupling constants:
$$ x_{\sigma H}=\frac{g_{\sigma H}}{g_{\sigma}}=x_{\sigma}\,, $$
$$ x_{\omega H}=\frac{g_{\omega H}}{g_{\omega}}=x_{\omega}\,, $$
$$ x_{\rho H}=\frac{g_{\rho H}}{g_{\rho}}\,. $$
The hyperon coupling parameters $x_{\rho H}$ are given by the SU(6) symmetry:[19]
$$ x_{\rho\Lambda}=0\,, \quad x_{\rho\Sigma}=2\,, \quad x_{\rho\Xi}=1\,. $$
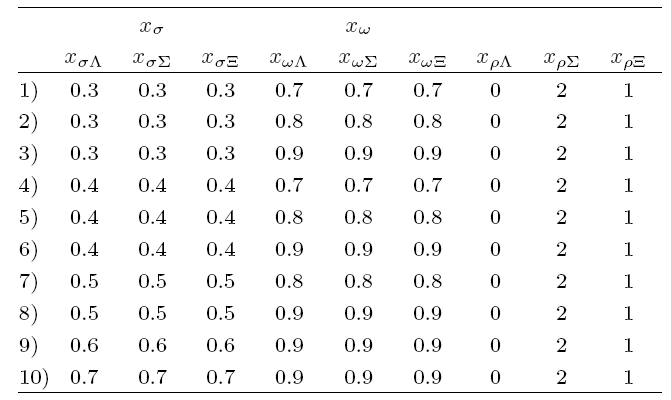
Due to the uncertainty on hyperon coupling parameters, we select $x_{\sigma}$ and $x_{\omega}$ at the range mentioned above. For each $x_{\sigma}=0.3, 0.4, 0.5, 0.6, 0.7, 0.8, 0.9$, we select $x_{\omega}=0.3, 0.4, 0.5, 0.6, 0.7, 0.8, 0.9$, respectively.
We calculate the maximum mass of the neutron star for each pair of the hyperon couplings $(x_\sigma,x_\omega)$, and reserve only those hyperon-coupling pairs that lead to the maximum mass exceeding $2.05 M_{\odot}$, otherwise will be deleted.
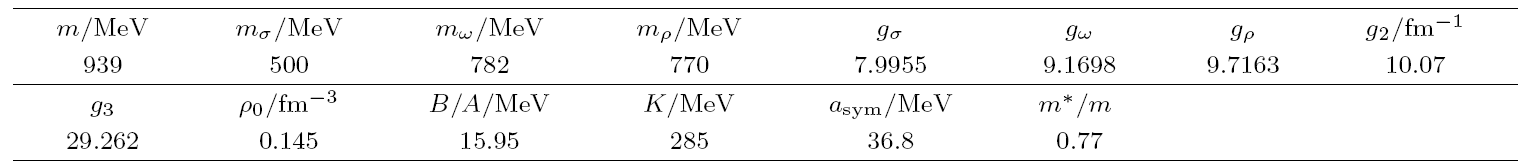
The first step, when $x_{\sigma}=0.3$, the corresponding value of $x_{\omega}$ selected as 0.3, 0.4, 0.5, 0.6, 0.7, 0.8, 0.9. We plot the results in Fig. 1. There are three cases in which the masses have exceeded $2.05M_{\odot}$, they are $x_{\omega}=0.7, 0.8, 0.9$, respectively. Therefore, these parameter sets can be utilized to study massive neutron star PSR J0348+0432.
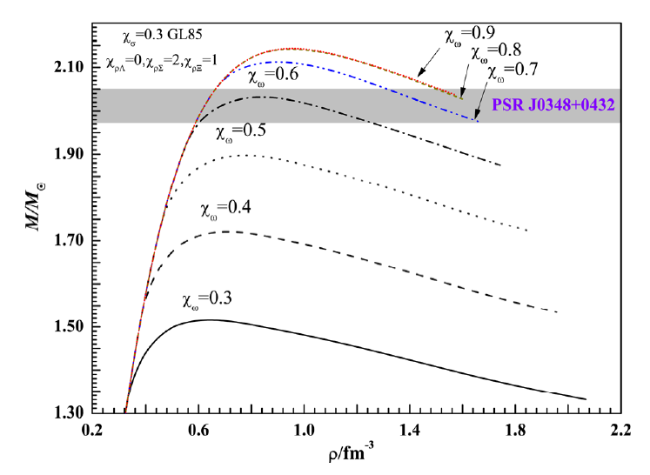
Fig. 1 (Color online) Mass-central density relation of a neutron star for different $x_{\omega}$, which corresponds to $x_{\sigma}=0.3$ and $x_{\rho\Lambda}=0$, $x_{\rho\Sigma}=2$, $x_{\rho\Xi}=1$. |
When $x_{\sigma}=0.4, 0.5, 0.6, 0.7$, the corresponding value of $x_{\omega}$ also selected as 0.3, 0.4, 0.5, 0.6, 0.7, 0.8, 0.9 respectively. The results are plotted in Fig. 2. There are three cases corresponding to $x_{\sigma}=0.4$, two cases corresponding to $x_{\sigma}=0.5$, one case corresponding to $x_{\sigma}=0.6$ and $x_{\sigma}=0.7$ respectively.
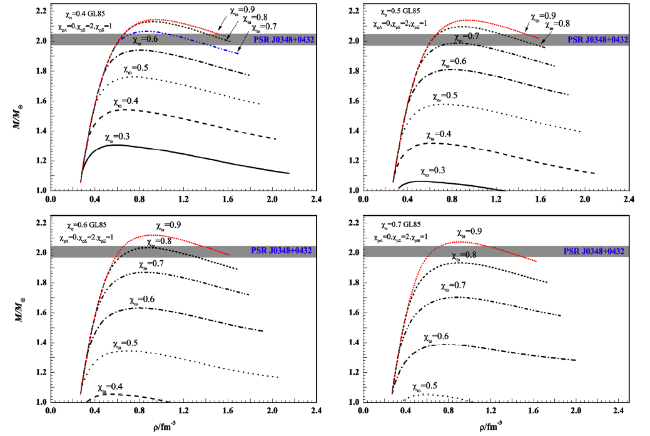
Fig. 2 Mass-central density relation of a neutron star for different $x_{\omega}$,which corresponds to $x_{\sigma}=0.4,0.5,0.6,0.7$ and $x_{\rho\Lambda}=0,x_{\rho\Sigma}=2, x_{\rho\Xi}=1$. |
However, the $x_{\sigma}$ equals 0.8 or 0.9, the result can not give the mass which could exceed $2.05M_{\odot}$, we can read it in Fig. 3.
Fig. 3 (Color online) Mass-central density relation of a neutron star for different $x_{\omega}$,which corresponds to $x_{\sigma}=0.8,0.9$ and $x_{\rho\Lambda}=0, x_{\rho\Sigma}=2,x_{\rho\Xi}=1$. |
In summary, ten sets of the hyperon coupling constants are found for the limitation model, which give the maximum neutron-star mass exceeding $2.05 M_{\odot}$ and can be used to study the massive neutron star. A list of these hyperon coupling constants could be found in Table 2.
Table 2 The practicable hyperon coupling parameter sets for studying massive neutron stars. |
 |
3.2 Potential Well Depth Model
In the context of hyper-nuclear potential well depth model, the hyperon coupling parameter $x_{\rho H}$ are determined by SU(6) symmetry as well, i.e., $x_{\rho\Lambda}=0$, $x_{\rho\Sigma}=2$, $x_{\rho\Xi}=1$. The value of $x_{\omega}$ and $x_{\sigma}$ are also strictly constricted from 1/3 to 1, but the choice among the $x_{\omega}$ and $x_{\sigma}$ should be held accountable for the relation:[15,20]
$$ U^{N}_{H}=x_{\omega H}(g_{\omega}/m_{\omega})^{2}\rho_{0}-x_{\sigma H}(m-m^{*}), $$
$$U^{N}_{\Lambda}=-30 \mathrm{MeV}\,,\quad U^{N}_{\Sigma}=+30 \mathrm{MeV}\,, \\ U^{N}_{\Xi}=-28 \mathrm{MeV}\,. $$
The value of $x_{\sigma}$ will determine the value of $x_{\omega}$ according the above relation. For $x_{\sigma \Lambda}$ and $x_{\omega \Lambda}$, when $x_{\sigma \Lambda}$ equals 0.3 and 0.9, the corresponding value of $x_{\omega \Lambda}$ we obtain are 0.227 and 1.073 respectively, both of which fall short of the range we need, therefore, we select $x_{\sigma \Lambda}$ as 0.4, 0.5, 0.6, 0.7, 0.8 and the $x_{\omega \Lambda}$ obtained as 0.368, 0.509, 0.650, 0.791, 0.932 respectively.
For $x_{\sigma \Xi}$ and $x_{\omega \Xi}$, $x_{\sigma \Xi}$, $x_{\sigma\Xi}=0.3$ and 0.9 will give $x_{\omega \Xi}= 0.24$ and 1.085, which also lie outside $[1/3,1]$. Therefore, we take $x_{\sigma \Xi}= 0.4, 0.5, 0.6, 0.7, 0.8$, with the corresponding $x_{\omega \Xi}= 0.381, 0.522, 0.663, 0.804, 0.945$.
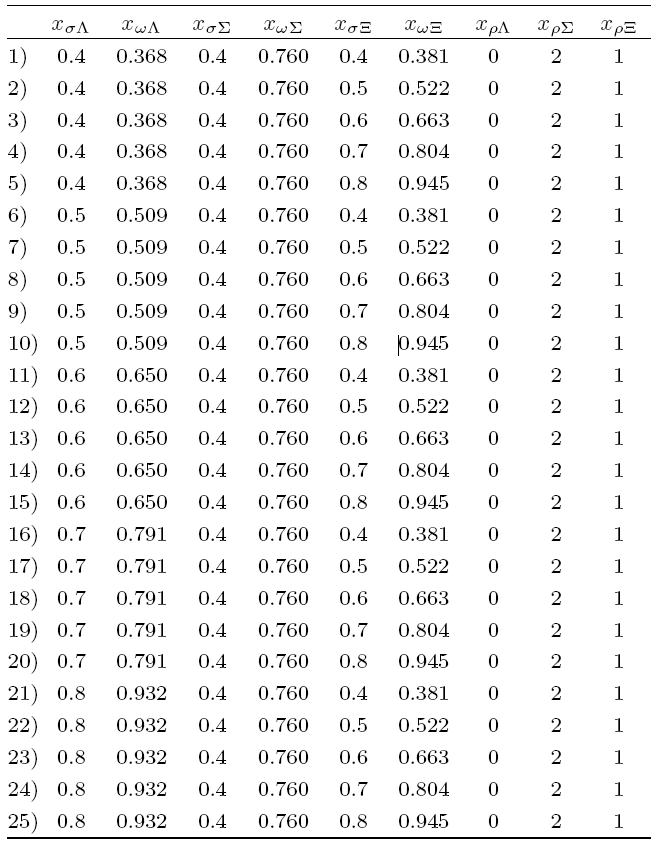
For $x_{\sigma \Sigma}$ and $x_{\omega \Sigma}$, there are only two available sets: $x_{\sigma \Sigma}=0.4$, $x_{\omega \Sigma}=0.760$ and $x_{\sigma \Sigma}=0.5$, $x_{\omega \Sigma}=0.901$. The positive potential well depth $U^{N}_{\Sigma}$ will hamper the production of $\Sigma$, so we will only select $x_{\sigma \Sigma}=0.4$, $x_{\omega \Sigma}=0.760$ as the best candidate. The specific value are listed in Table 3. In summary, we have twenty-five candidate parameter sets for the hyperon coupling constants, which could be seen in Table 4.
Table 3 The value of x_ and x! are depending on the available hyper-nuclear experimental data. |
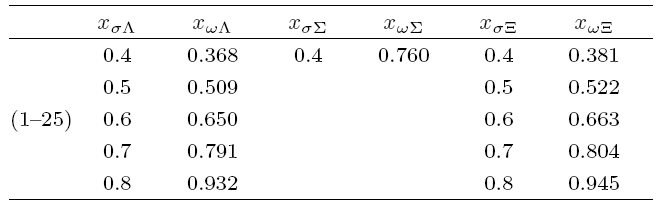 |
Table 4 Twenty-five combinations of hyperon coupling parameter sets are depending on the available hyper-nuclear experimental data from Table 3. |
 |
In this section, the method we discussed is similar with above section, we will use 25 sets of hyperon coupling parameter to calculate the maximum mass of neutron star. We hope that the maximum mass could exceed $2.05M_{\odot}$, otherwise the set will be deleted. The result is shown in Fig. 4, which shows that only the 25th parameter set satisfies the above requirement.
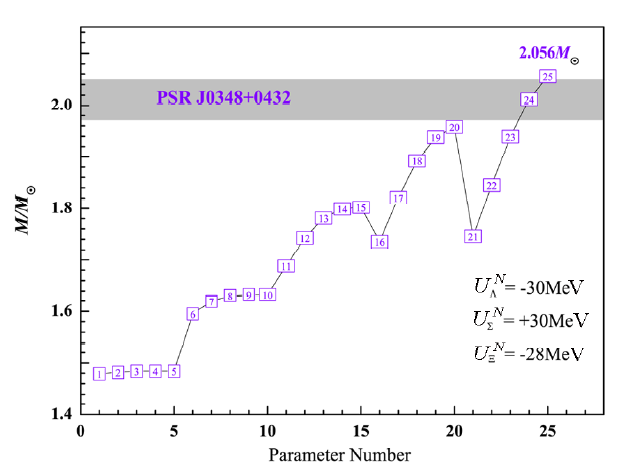
Fig. 4 (Color online)The maximum neutron-star mass given by the twenty-five parameter sets of the hyperon couplings in the potential well depth model. |
4 The Results and Discussions
In the above section, limitation model gives ten sets of practicable hyperon coupling parameters listed in Table 2, and potential well depth model with only one available set depicted in Fig. 4. Now we use above sets to calculate radius and gravitational redshift of massive neutron stars, for the PSR J0348+0432, whose mass is about $1.97\sim2.05 M_{\odot}$.[4]
4.1 Mass-Radius Relationship of Limitation Model and Potential Well Depth Model.
In the limitation model, for the PSR J0348+0432, the radius is found to be 12.97 km at the lower limit of the experimental mass value $1.97 M_{\odot}$, and ranges from 12.52 km to 12.66 km at the upper limit of the experimental mass value $2.05 M_{\odot}$ (see the colorful lines in Fig. 5). In the potential well depth model, the radius of PSR J0348+0432 is found to be 12.19 km at the lower limit $1.97 M_{\odot}$ and 12.89 km at the upper limit $2.05 M_{\odot}$ (see the black line of Fig. 5).
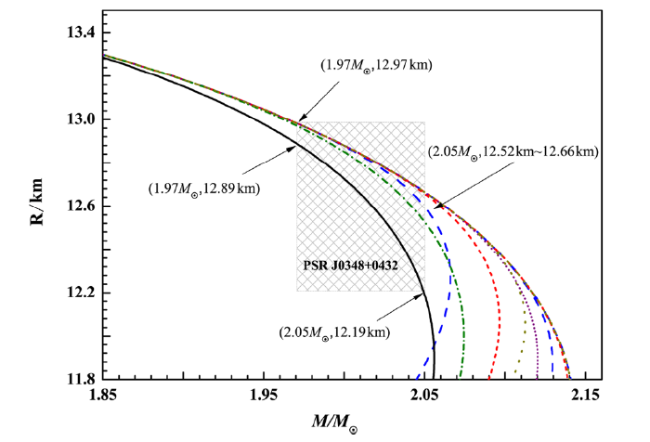
Fig. 5 (Color online) Mass-radius relation with limitation model and potential well depth model. |
These results show that the radius of PSR J0348+0432 could be determined theoretically with small errors, and ranges from 12.52 km to 12.97 km in the limitation model and from 12.19 km to 12.89 km in the potential well depth model.
4.2 Mass-Gravitational Redshift Relation
$$ z=\Bigl(1-\frac{2M}{R}\Bigr)^{-1/2}-1\,. $$
In the limitation model, for the PSR J0348+0432, the gravitational redshift is found to be 0.346 at the lower limit of the experimental mass value $1.97 M_{\odot}$. At the upper limit of the experimental value $2.05 M_{\odot}$, the gravitational redshift ranges from 0.384 to 0.391 (see the colorful lines in Fig. 6). In the potential well depth model, the gravitational redshift of PSR J0348+0432 is about 0.350 at the lower limit $1.97 M_{\odot}$ and 0.409 at the upper limit $2.05 M_{\odot}$ (see the black line in Fig. 6).
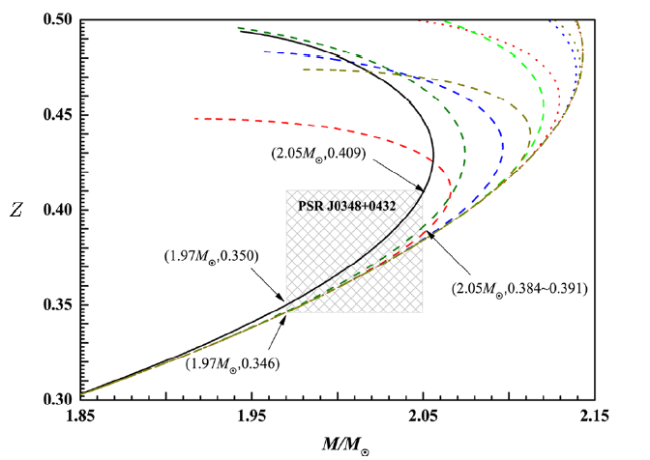
Fig. 6 (Color online) Mass-gravitational redshift relationship with limitation model and potential well depth model. |
These results show that the gravitational redshift of PSR J0348+0432 be determined theoretically with small errors, which are about $0.346\sim0.391$ in the limitation model and about $0.350\sim0.409$ in the potential well depth model.
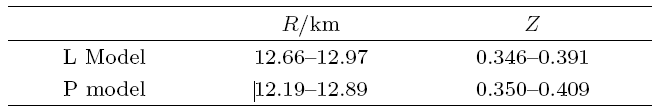
A summary of the theoretical values of the radius and the gravitational redshift of PSR J0348+0432 in the limitation model and the potential well depth model could also be found in Table 5, which are also consistent with recent astronomical observations.
Table 5 Radius (R) and gravitational redshift (Z) of RSR J0348+0432 (1.97 M⊙-2.05 M⊙) under limitation model (L Model) and potential well depth model (P Model) respectively. |
 |
4.3 Discussions
This section gives some further remarks on the limitation and potential well depth model in the studies of massive neutron stars. The radius of PSR J0348+0432 given by the limitation model is bigger than that given by the potential well depth model. Explicitly, in the limitation model, the radius of PSR J0348+0432 is around $12.52 \text{km}\sim12.97 \text{km}$, while in the potential well depth model, the radius is found to be around $12.19\ \text{km}\sim12.89\ \text{km}$. The gravitational redshift of PSR J0348+0432 given by the limitation model is, on the other hand, smaller than that given by the potential well depth model, and it is around $0.346\sim0.391$ in the limitation model and $0.350\sim0.409$ in the potential well depth model.
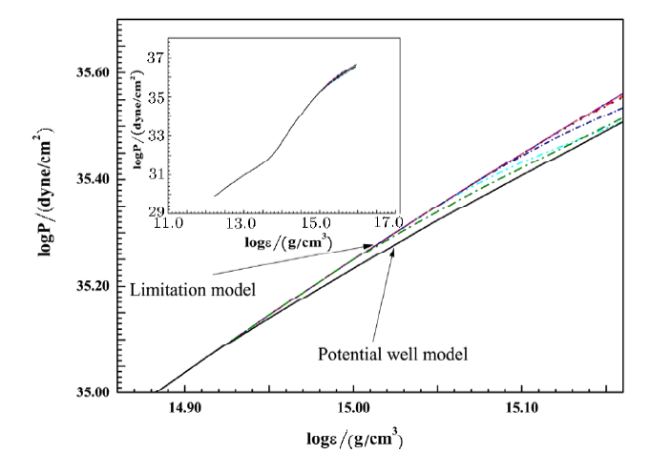
Fig. 7 (Color online) The EOS of limitation model and potential well depth model. |
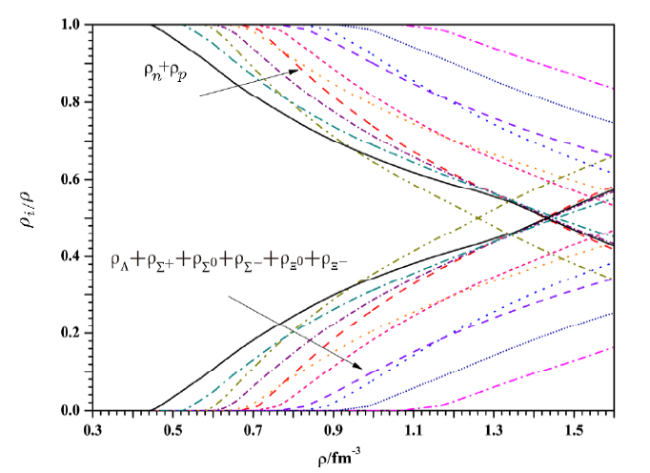
Fig. 8 (Color online) The particle number distribution of limitation model and potential well depth model. The upper part represents nucleonic density and the lower part represents the sum of hyperon density. |
From Fig. 7, the logarithm of central energy density log$\varepsilon$ that exceed 14.94 g/cm$^{3}$ gradually reveals the difference between these two models, and Fig. 8 tells us the hyperons of potential well depth model appear at $0.44$ fm$^{-3}$, while the hyperons of limitation model (color line) appears in succession from $0.52$ fm$^{-3}$.
For the sake of a best understanding on particle number distribution, we select a typical parameter set from limitation model that can support a neutron star with mass above $2.05\ M_{\odot}$, and make a comparison with the single set from potential well depth model, we plot it in Fig. 9. As a result, in limitation model, the density at where $\Lambda$ that as the first hyperon appears is $0.66$ fm$^{-3}$, while $0.44$ fm$^{-3}$ in potential well depth model, This result clearly manifest a result that the hyperons do not appear at the density below $0.44$ fm$^{-3}$ in both models, thus the two models will give an almost same conclusion for calculating a neutron star.
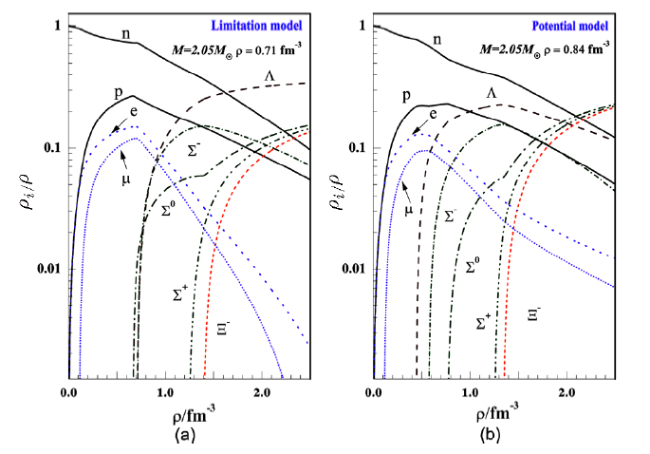
Fig. 9 (Color online) (a) the particle number distribution of a typical parameter set in limitation model. (b) the particle number distribution of potential well depth model. The central density of a neutron star with $2.05 M_{\odot}$ are given in corresponding models. |
In general, for neutron stars lighter than $1.85M_{\odot}$, these two models give degenerate numerical results, and start to give different results for neutron stars heavier than $1.85 M_{\odot}$. At present, the experimental data for massive neutron stars are still limited, and both models are consistent with the recent observations of PSR J0348+0432. Future observations of massive neutron stars might help discriminate these two models.
5 Summary
In the framework of relativistic mean field theory, we propose two hyperon coupling models, namely the limitation model and the potential well depth model, and study their parameter space in the light of the observed properties of the massive neutron PSR J0348+0432. Ten parameter sets are found for the limitation model, and one parameter set are found for the potential well depth model. These parameter sets could be used to study massive neutron stars.
Numerical calculations show that the radius of PSR J0348+0432 given by the limitation model is bigger than that given by the potential well depth model. Explicitly, the radius of PSR J0348+0432 given by the limitation model is about $12.52\text{ km}\sim12.97\text{ km}$, while the radius given by the potential well depth model is about $12.19 \text{km}\sim 12.89 \text{km}$. The gravitational redshift of PSR J0348+0432 given by the limitation model is, on the other hand, smaller than that given by the potential well depth model, and is around $0.346\sim0.391$ for the limitation model and around $0.350\sim0.409$ for the potential well depth model.
Furthermore, we find that, in general, these two models give almost the same results on a neutron star lighter than $1.85M_{\odot}$, and start to give different results for neutron stars heavier than $1.85M_{\odot}$. In other words, the study of the physical properties of massive neutron stars could be crucial for discriminating these two models and help deepen our understanding of hyper-nuclear interactions.