


1 Introduction
Pore-forming peptides are a class of important membrane active peptides, which can permeabilize lipid bilayer membranes for mass transfer, or content release and cell killing.[1-2] This unique function promises the peptides great potential for biotechnological and clinical uses, such as developing antibacterial and antineoplastic agents,[3] drug delivery vehicles,[4] biosensors,[5] to name a few. However, practical applications of pore-forming peptides call for rational engineering of them, with the purpose of improving their membrane activities and overcoming the drawbacks such as poor cell-penetrating efficiency and strong cytotoxicity.[6-7] Unfortunately, lack of knowledge on the individual residue-specialized contribution in peptide activity is still a roadblock for the molecular design and/or engineering of pore-forming peptides.[2, 8-11]
Melittin, as a natural amphipathic peptide with 26 amino acid residues (Fig. 1(a)),[1] is one of the most representative pore-forming peptides.[12-13] As demonstrated by experiments and all-atom molecular dynamics (MD) simulations,[14-15] when binding on a lipid membrane, melittin has a bent conformation with two-separated $\alpha$-helixes, helix-1 and 2, connected by a non $\alpha$-helical kink region (residue T11 and G12, see Fig. 1(b)). This peptide has six positive charges with four of them residing on the residues near C terminus (K21, R22, K23, and R24), and the other two at residue K7 and the protonated N terminus (residue G1).[16] Very recently, Wimley and his coworkers reported their intriguing experimental findings on the enhancement of membrane activity of melittin via residue mutations.[9,11,17-19] By using an orthogonal high-throughput assay, about a dozen sequences were screened from the 7,776-member library, which differed from the parent melittin in only a few amino acids out of the total 26 but were highly potent in membrane poration (Fig. 1(a)).[17-18] The strategy proposed by them to screen the gain-of-function sequences was to vary the residues at specific locations of peptide chain, specifically to improve the amphipathic property of the $\alpha$-helix while preserving the kink region.[17-18] For example, the C-terminal Gln (Q26) was replaced with Leu (L26) for an increased hydrophobicity of the polar C-terminus. Also, some of the cationic residues near C-terminus (e.g. R22, K23, R24) were changed to be either a polar, uncharged Gln (Q24) or a nonpolar, helix-promoting Ala (A22, A23), to reduce the positive charge, extend the peptide helicity, and improve the amphipathicity of $\alpha$-helix. Moreover, Thr at the kink part (T10) was substituted with more hydrophobic Ala (A10), with the purpose to change amphipathicity and helix propensity; a nonpolar amino acid substitution at T10 would also decrease the polar face angle and consequently weaken the interfacial interactions between amphipathic helices and membranes (Fig. 1(a)). Based on such mutations, they found that the most active gain-of-function variant with five-site mutation (i.e., T10A, R22A, K23A, R24Q, and Q26L, see Fig. 1), MelP5, could make stable transmembrane pores in lipid vesicles at an extremely low peptide-to-lipid ratio ($P/L\leq$1/1000), which was approximately 20-fold lower than that required for the native melittin.[17-21] Moreover, oriented circular dichroism tests indicated that, at equilibrium, most MelP5 was inclined to orient in a bilayer-spanning state, while native melittin preferred a parallel membrane surface adsorption state.[17-18] Such changes in membrane activity between melittin and its gain-of-function variants induced by residue mutation provide a good example for the investigation of the Sequence-Structure-Function relationship and the underlying membrane action mechanisms of pore-forming peptides.

Fig. 1 (Color online) Structural demonstration of melittin and three representative gain-of-function variants, MelP1, MelP3 and MelP5. (a) Amino acid sequences of the peptides. Different types of residues are colored differently: grey for hydrophobic residues, orange for hydrophilic ones, while blue for charged ones. Residues in red are the mutated ones from parent melittin. Arrow "$N$" or "$C$" indicates the $N$ or $C$ terminus of the peptide. (b) Conformational structure of melittin and MelP5 (when binding on a membrane). The two $\alpha$-helixes of melittin are sketched with transparent cylinders, being connected with the kink part between them. Corresponding amino acid residues are highlighted with the same color scheme as in (a). |
Computer simulations have been widely proved as a powerful tool to study the action of melittin and other membrane-active peptides on lipid bilayers.[16, 21-25] Some featured behaviors, such as the membrane thinning/stretching and lipid extraction of/from a membrane under peptides' disturbance, as well as the aggregation and conformational transition of some arginine-rich peptides in membrane, are all observed in molecular dynamic simulations. Such behaviors are also assumed as significant steps during the membrane action process of the peptides.[26-27] Moreover, computer simulations have unique advantages over experimental investigations in decoupling the complicated influencing factors and particularly in providing descriptions of the peptide-membrane interaction in terms of mechanistic landscapes.[28-29] For example, with umbrella sampling method, the energy barrier for a melittin peptide to reorient its $N$ terminus across a lipid bilayer for the poration was determined by calculating the change of the potential of mean force (PMF) with the distance between peptide and membrane center (i.e., one-dimensional free energy landscape).[22,24,30] However, a more accurate and comprehensive description of the peptide-membrane interactions from both kinetic and thermodynamic aspects is still needed for a full understanding of the complicated pore formation process of peptides,[31] as well as the individual residue-specialized contribution in peptide activity. Due to the huge computational costs, the exploration of possible intermediate states with all-atom molecular simulations and the construction of multi-dimensional mechanistic landscape with proper collective variables (CVs) or reaction coordinates are still challenging. Under such circumstances, the combination of coarse-grained molecular dynamics (CG-MD) with simplified molecular models and advanced sampling techniques is developed, which makes it possible to explore the phase space at much-extended temporal and spatial scales.[28,32]
In this work, the membrane interaction process of melittin and its representative gain-of-function variants (i.e., MelP1, MelP3, MelP5, see Fig. 1) are investigated via combining CG-MD and the well-tempered metadynamics (MetaD) simulations of a long time of 560 $\mu$s.[32] With unbiased simulations, the characteristic behaviors (e.g. membrane thinning and stretching) and poration of lipid bilayers under the action of melittin and its variants are observed, which are in good consistence with the available experimental results.[13,33-35] Particularly, the molecular-level kinetics of pore formation by the peptides, including some key intermediate states (e.g., the aggregation and U-shape folding of peptides in the membrane) and the corresponding residue-specialized energy analysis during membrane poration, are identified. Moreover, the multi-dimensional free energy landscapes of the peptide-membrane interactions are reconstructed by including the intermediate states as CVs with the MetaD method. The strongly residue-dependent variations in pore formation kinetics and free energy landscapes among melittin and the variants clearly demonstrate the effect of key residues on the occurrence of intermediate states and final membrane poration. Our results provide useful information on the complicated residue-specialized contribution of membrane-active peptides, and make a step forwards for rational engineering or even de novo design of novel peptides for practical applications.
2 Methods
2.1 Coarse-Grained Models
The crystal structure of melittin is taken from the protein data bank (PDB ID: 2MLT, chain A), and the variants are generated by mutating the corresponding residue(s) from the parent sequence of melittin with CHARMM-GUI.[36] All CG models of peptides are built by using the Martinize script with MARTINI force field (Fig. 1(b)).[37] It is noted that the $\alpha$-helical structures of peptides and charges are kept in the CG models, which are similar to those in the experimental conditions.[17-18] The lipid bilayer membrane is constructed by 512 zwitterionic CG lipids based on the MARTINI model. In the experiments of Wimley, $et al$., 1-palmitoyl-2-oleoyl-sn-glycero-3-phosphocholine (POPC) is applied.[17-18] However, in order to realize membrane poration in an accessible time scale of unbiased simulations, DLPC, which has the same head group as POPC while shorter tails, is used, as done by previous simulations.[21] It has been demonstrated before that the MARTINI model indeed provides a reasonable description of the interaction between amino acids and zwitterionic bilayers, which are in agreement with atomistic simulations and the Wimley-White interfacial scale.[37-38] In addition, 0.1 M NaCl is included in the system and additional ${\rm Cl}^{-}$ ions are added to neutralize the charge on the peptides.
2.2 Coarse-Grained Simulations
The unbiased MD simulations are performed by using the GROMACS 5.1.4 package with MARTINI force field.[39-41] Non-bonded interactions, including electrostatics and Lennard-Jones, are cut off at 1.1nm. All simulations are carried out in the isothermal-isobaric (NPT) ensemble at a temperature of 310 K and a pressure of 1.0 bar. The temperature is controlled with the Berendsen temperature coupling scheme with a time constant of 1ps,[42] while the pressure is using a Parrinello-Rahman semi-isotropic barostat with a time constant of 12 ps and a compressibility of 3$\times$10$^4$ bar$^{-1}$.[43] Periodic boundary conditions are applied in all three directions.
The bilayer is set parallel to the X-Y plane of the simulation box. The peptides are placed evenly on the bilayer surface initially ($\sim$ 0.6 nm above). The peptide number is determined by the $P/L$ ratio. Herein, three ratios ($P/L$=1/85, 1/43, and 1/21; the corresponding peptide number in the system is 6, 12, and 24, respectively) are used to investigate the influence of peptide concentration on membrane poration. Then the whole system is equilibrated while keeping the location of the peptides fixed. In the production runs, all constraints are removed and simulations are carried out for at least 10 $\mu$s with a time step of 20 fs. At least three independent runs are performed to ensure the computational consistency.
2.3 Collective Variables (CVs)
Reweighing the distributions of various CVs is pivotal for the evaluation of free energy. Several CVs are applied in our simulations. For example, $Z_N$, which represents the z-component distance between mass center of the first three residues of peptide at $N$ terminus (residues 1--3) and the bilayer center, is used to monitor the degree of membrane insertion situation of the peptide. Note that $Z_N$ is also one of the most widely used CVs (or reaction coordinates) in the PMF calculations.[22, 24] Besides, in consideration of the vital role of the kink region of a peptide in its conformation transition (i.e., the U-shape conformation of the peptide) and consequent membrane poration, $Z_{\rm kink}$, defined as the z-component distance between the mass center of residue 11 (in the kink part) and the bilayer center, is also set as a CV. On the other hand, the aggregation state of peptides on/in the membrane is also important for membrane poration of peptides. Thus, two factors, including $\Delta D$, the distance between the $C$ termini of two peptides on/in the membrane (here, the position of peptide terminus is determined by mass center of residues 21-26 of it), and $\theta$, the relative orientation of C termini of these two peptides, are used as CVs as well.
2.4 MetaD Simulations
Well-tempered metadynamics simulations are carried out by using GROMACS 4.6.7 package with PLUMED 2.2 plugin,[28,32,44] to enhance the sampling of the configurational space and reconstruct the free energy surface (FES) as a function of CVs. An external history-dependent bias potential, $V(s,t)$, is built as a sum of Gaussians deposited along the trajectory in the space of selected CVs, $s$, and finally it serves as an estimator of the FES, as:
$$\begin{eqnarray} F(s,t)=-\frac{T+\Delta T}{T} V(s,t), \end{eqnarray} $$
where $T$ is the system temperature. $\Delta T$, which is the virtual temperature along CVs, is used to regulate the extent of free-energy exploration. Gaussians of height 2.0 kJ/mol and width 0.05 nm are used and deposited every 5,000 steps with a bias factor of $\gamma=(T+\Delta T)/T$=15. Note that this is a well-established method in the construction of multi-dimensional free energy landscape especially for biomacromolecules.[28,45]
2.5 Minimum Free Energy Paths (MFEPs)
As done before,[28] the minimum free energy paths (MFEPs) are obtained by scanning of the lowest free energy points at the free energy surfaces obtained by well-tempered metadynamics simulations. This path could give a good description of the possible transition of a peptide from one state to another.[28]
3 Results and Discussion
3.1 Peptide-Induced Membrane Disturbance and Poration
Membrane poration induced by melittin and its variants, including MelP1, MelP3, and MelP5, is successfully observed in our simulations. However, the membrane interaction situation differs for different peptides or concentrations (Fig. 2(a)). For native melittin, membrane poration begins to occur only when $P/L$ ratio is above a critical value of 1/43. In contrast, for MelP1 and MelP3 with the same $P/L$ ratio, their ability to make membrane pores are obviously promoted. Even for MelP5, such poration occurs at an even lower $P/L$ ratio ($\sim$ 1/85). Such a sequence- and concertation-dependent poration ability of melittin and its variants are in good agreement with the experimental results.[13,17-18]

Fig. 2 (Color online) Membrane poration of different peptides at varying $P/L$ ratios. (a) Probability of membrane poration under the action of melittin and its variants with various $P/L$ ratios. For each parameter, three independent runs are performed for statistical analysis. Different colors are used to represent different types of pores. (b) Snapshots of two types of membrane pores. For clarification, only lipid head groups (blue: PO$_4$ group; orange: NC$_3$ group) and peptides are shown. (c) Time-dependent evolution of pore size under the action of melittin or MelP5, indicating the formation of transient or stable pore, respectively. Central lines are bold to guide eyes. (d), (e) Thinning and stretching (indicated by the area per lipid, APL) of lipid bilayer membranes under the action of peptides with various $P/L$ ratios. |
Besides, depending on the peptide conformation inside a pore, the formed pores can be classified into two types, namely T-pore and U-pore (Fig. 2(b)). For a T-pore, at least one peptide in the pore presents a transmembrane-spanning configuration (e.g., the red peptide in Fig. 2(b)); while for a U-pore, all the peptides inside the pore behave a U-shaped conformation (e.g., the green ones in Fig. 2(b)). In comparison of melittin and the other variants, MelP5 is found more likely to present a transmembrane state in the pore (Fig. 2(a)). Such orientation preference of melittin and its variants is consistent with the experimental observations under oriented circular dichroism characterization.[17] Moreover, the pores formed by MelP5 are probably stable throughout the simulations, while melittin tend to form transient pores (Fig. 2(c)). These phenomena have also been observed in experiments.[46-47]
In addition, it is noted that peptide aggregation is necessary for the occurrence of membrane poration (e.g., Fig. 2(b) and Fig. 3), no matter what type of peptide is used (melittin or its variants) or which type of pore is formed (T- or U-pore). Even with relatively low peptide concentrations (e.g., $P/L$=1/43 or 1/85), forming peptide clusters is still a precondition for the realization of transmembrane poration, and obviously it is more difficult for the peptides to aggregate together under this condition.

Fig. 3 (Color online) Formation process of a T-pore under the action of MelP5 at $P/L$=1/43. (a) Snapshots showing the interaction states, "S", "U" and "T", during the MelP5-membrane interaction process. The peptide which finally penetrate the membrane is tracked and colored red (with the kink residue T11 marked green), while the others are grey. (b), (c) Time-dependent evolution of the z-position (b) or tilt angle (c) of key residues, including G1 and Q26 at the two termini, T11 in the kink region, and the only charged residue K7 in helix-1. The z-position of lipid heads (PO$_4$ groups) of the two leaflets are shown as references of the membrane surfaces (solid orange and purple lines). |
On the other hand, the disturbance of peptides to membrane structure, e.g. membrane thinning and stretching, is also clearly observed in the simulations for all types of peptides, which however has a strong concentration-dependence while a weak sequence-dependence. Generally, upon the addition of melittin, the thickness of lipid bilayer membrane decreases by approximately 1.7% (at $P/L$=1/85) or even 3.9% (at $P/L$=1/43), and simultaneously the area expands by 4.2% and 8.3%, respectively; for the variants, similar changes are observed (Figs. 2(d)--2(e) and Table S1-S2 in Appendix). These changes measured in our simulations are roughly consistent with the quantitative analysis in experiments at similar peptide concentrations.[13,34,48] Moreover, with a higher $P/L$ ratio (e.g. 1/21), the peptides work like detergents,[35] which can dissolve and remove lipids directly from the bilayer (Fig. S1 in Appendix).[27] In general, our CG computational model well reproduces the membrane interactions with melittin and its variants, especially in the characteristic changes in membrane structure and peptide conformation.
3.2 Kinetics of Pore Formation
Detailed formation process of a T-pore in membrane under the action of MelP5 is shown in Fig. 3(a) ($P/L$= 1/43). Three interaction states are observed in the process. Initially, the peptides bind on the membrane surface (denoted as "S" state). Meanwhile peptides accumulate into aggregates. Then, some of the peptide chains deform. The middle part of the peptide inserts into the membrane while the two ends still locate at the membrane surface, leading to the appearance of a U-shaped peptide conformation (denoted as "U" state). Here, such "U" conformation is defined based on the relative z-position of the kink and terminal residues of the peptide inside the membrane (Fig. 3(b)). That is, a "U" conformation is identified when the kink (represented with T11) is 1 nm lower than the surface of the outer leaflet (horizontal dashed line, Fig. 3(b)) while the two termini (i.e. G1 and Q26) are still left near the surface. In this state, the hydrophilic residue T11 of the peptide could contact the lipid heads of the inner leaflet, while simultaneously most residues inside the membrane are hydrophobic. Note that such U-shaped peptide is generally observed during melittin's interaction with membranes, even with different force fields or lipid environments.[12,16,21,23,49] Moreover, it is believed that the U-shaped melittin might work as a wedge and facilitate the peptide insertion and membrane poration.[49] During our simulation process, the U-shaped peptide could be stable (Fig. S2 in Appendix), or it could further change its conformation through translocating the $N$ terminus across the membrane (Figs. 3(a) and 3(b)). In this situation, the peptide penetrates vertically across the membrane and resides in the pore in a membrane-spanning state (denoted as "T" state).
In addition, the configuration evolution of key residues of the peptide during the membrane interaction process can provide more details of the T-pore formation on a molecular level. For example, based on analyzing the changes in orientation of the residues, the specific relationship between some key residues and the formation of U- or T-shaped peptide configuration is obtained (Fig. 3(c) and S2 in Appendix). Here, a parameter of tilt angle is used to describe the orientation of a specific residue, defined as the direction of its side chain relative to the normal direction of the membrane. It is found that, the flip of residue T11 (in the kink region) is probably accompanied by the building of a "U" conformation of the whole peptide; while the reorientation of residue K7 (the only charged residue in helix-1) would significantly facilitate the translocation of $N$ terminus of the peptide and finally realize its transmembrane insertion in a "T" state. In addition, the decreased contacting possibility between N terminus of the peptide and the outer leaflet lipids might also help the transition of a peptide from a "U" state to a "T" state (Fig S3 in Appendix).
On the other hand, the U-pore, composed only by U-shaped peptides, is also observed in our simulations. This type of pores mostly appears in the case of melittin, and its variants with few-site mutation (e.g. MelP1 and MelP3) or MelP5 at low $P/L$ ratios (e.g. 1/85, Fig. 2(a)). Especially, in comparison with the variants, the native melittin is more inclined to induce unstable and transient U-pores. As shown in Fig. S4 in Appendix, the "U" conformation of melittin repeatedly forms and disappears, and up-and-down flipping of the side chain of residue T11 iteratively occurs inside the membrane ($P/L=1/43$).
To further understand the sequence-induced differences in membrane activity between melittin and its variants, the residue-specialized interactions between peptides and membrane are analyzed. Fig. 4 quantitatively demonstrates the interaction energy between each residue of the typical peptide (e.g., the red one in Fig. 3 and the green one in Fig. S4 in Appendix) and the two leaflets of bilayer, respectively. Firstly, in the "S" state, it is reasonably found that both melittin and MelP5 mainly interact with the outer leaflet of the bilayer instead of the inner one. However, compared with melittin, the interaction strength of most residues of MelP5 is weaker, especially for the mutated ones (T10A and R22A-R24Q) and those in helix-2 (e.g., residues G13-I17). Such a decrease indicates a relatively weaker binding of MelP5 to the membrane surface. Then, in the "U" state, the peptides interact with both leaflets simultaneously. However, it is clearly observed that in comparison with melittin, the interaction of MelP5 with the inner leaflet is significantly stronger (e.g., residue K7 in helix-1, and T11-G12 in the kink region) and its interaction with the outer leaflet is weaker (especially for the two termini G1-G3 and R22A-R24Q). Such differences explain why it is easier for MelP5 to further penetrate the membrane while melittin is more inclined to keep switching between "U" and "S" states. Furthermore, MelP5 could finally reach a "T" state, in which the $N$ terminus mainly interacts with the inner leaflet instead of the outer one. In general, the differences in the membrane interactions between melittin and its variants, particularly of the mutated residues and some other key residues (e.g. K7 at the kink region and residues at the termini), provide the useful information to understand the improved membrane activity of MelP5 over the native melittin on a residue-specialized level.

Fig. 4 (Color online) Residue-specialized interaction energy distribution between lipid bilayer and peptide in various states (i.e., "S", "U" or "T"). Left: melittin; Right: MelP5. In all cases, $P/L$=1/43. |
3.3 Free Energy Landscapes of the Peptide-Membrane Interactions
Thermodynamic description of the peptide-membrane interactions could give an insight into the Sequence-Structure-Function relationship of a peptide. To this end, more information is required for proper selection of the collective variables (CVs) to construct such mechanistic landscapes. As demonstrated above, U-shaped configuration of peptides is one of the featured intermediate states in the membrane interaction process of both melittin and its variants. As demonstrated in the unbiased simulations (Fig. 5(a)), in comparison with the native melittin, it is much easier for the variants to build a "U" conformation; moreover, the percentages of U-shaped peptides are almost the same for the three variants finally. These results are consistent with the calculations shown in Figs. S4(b) and S5 in Appendix, which quantitatively represent the free energy profiles for the different peptides to form a "U" conformation. In consideration of the changes in amino acid sequence among these four types of peptides, it is clearly suggested that the mutation of residue T10A, from hydrophilic Thr to hydrophobic Ala, is crucial for the formation of U-shaped peptide. To build such a conformation, the insertion of kink part into the hydrophobic core of membrane is necessary. Therefore, the increased hydrophobicity of kink region due to mutated T10A is helpful to decrease the energy barrier for membrane insertion of the kink (see Fig. 4). Moreover, such mutation would reduce the affinity between the residues at kink region (e.g., T10) and the lipid headgroups of outer monolayer, which consequently facilitate the insertion of the kink for the formation of U-shaped peptide conformation (Fig. 4). Furthermore, to further elucidate the effect of the kink, control simulations with a variant of MelP5 without the kink region are performed. The results clearly confirm the role of the kink structure in the membrane insertion (Fig. S6 in Appendix). All these results reveal the critical role of the non $\alpha$-helical kink part in pore formation of the peptides.

Fig. 5 (Color online) Different ability of different peptides, including melittin and its variants, to form "U" conformation during the membrane interactions. (a) Percentage of the peptides with U-shaped conformation during the membrane interaction process. Here, $P/L$=1/43. (b) Free energy profiles indicating the possibility to realize "U" conformation of each type of peptides. Inset shows definition of the CVs of $Z_N$ and $Z_{\rm kink}$. |
Influence of residue mutation, especially at the kink region, on membrane activity of melittin could be clearly demonstrated by the free energy landscape of transmembrane penetration of a single peptide. Here, forming U-shaped configuration of a peptide is described with the CV of $Z_{\rm kink}$ and is further used to construct the free energy landscape with $Z_N$ (Figs. 6(a) and S7 in Appendix). From the landscape, it is attractive to find that the corresponding free energy distribution of melittin and MelP5 are completely different, which is helpful to understand the big difference in pore formation situations between these two peptides observed in the unbiased simulations (Fig. 2(a)). Two basins, which denote the initial membrane-binding state and the final transmembrane-penetration state of the peptide, respectively, appear in the landscape (i.e., A1/A2, E1/E2, Fig. 6(a)). However, compared with MelP5, the basin of the poration state of melittin (E1, Fig. 6(a)) is shallower, indicating its preference to membrane-binding state. Moreover, the middle region of the landscape, which corresponds to the possible barriers to the transition between the binding and poration states of the peptide, is totally different for the two peptides. Accordingly, the minimum free energy path (MFEP) of a single peptide (i.e. melittin or MelP5) from these two states is obtained (Fig. 6). It is observed that melittin tends to penetrate the bilayer with the $N$ terminus slantwise ($A_1\rightarrow C_1\rightarrow E_1$), while MelP5 strongly favors penetration by deforming its chain into "U" conformation ($A_2\rightarrow C_2\rightarrow E_2$). Moreover, the energy barrier for MelP5 to achieve transmembrane penetration is decreased by approximately 7 kJ/mol in comparison of that of melittin (calculated by $\Delta\Delta F$=$\Delta F_{A1\rightarrow C1}-\Delta F_{A2\rightarrow C2}$), indicating a promoted pore formation ability of MelP5 especially at a much lower $P/L$ ratio. Generally, it is indicated by these results that the formation of "U" conformation of a peptide, which could be regulated by the characters of the corresponding residues (e.g., T10A) at the kink region, can facilitate the transmembrane penetration of the peptide.

Fig. 6 (Color online) Free energy landscape of the transmembrane insertion of a single melittin or MelP5. (a) Landscape with the CVs of $Z_N$ and $Z_{\rm kink}$. (b) Corresponding minimum free energy pathways obtained from (a). Red lines demonstrate two leaflets of the membrane. $N$ terminus and residue 11 (at the kink region) are colored in red and green, respectively. |
Additionally, aggregation of peptides on/in the membrane is also an important intermediate state during the peptide-membrane interaction process. In our unbiased simulations, a strong sequence-dependence of aggregation conditions for melittin and its variants is found (Fig. 7(a)). In comparison with melittin, its variants, especially MelP5, demonstrate a stronger aggregation tendency. The free energy landscape of peptide aggregation further confirms these observations (Fig. 7(b)). Here, the CVs of $\Delta D$ and $\theta$ (Fig. 6(c)-inset, see Methods) are used to characterize the relative position of the peptides and to construct the free energy landscape. The complexity of the landscape, for both melittin and MelP5, indicates the complicated assembly manners between peptides. Moreover, in the $\theta$ projection profiles, the minimum of the free energy at approximately $\theta$=0 (black arrow, Figs. 7(c) and S8 in Appendix) demonstrates the inclination of both melittin and MelP5 molecules to be in a parallel manner. However, the $\Delta D$ projection profiles indicate that molecules of MelP5 favor to approach each other much closer ($\Delta D\rightarrow$1.08 nm) than melittin ($\Delta D\rightarrow$1.80 nm) (blue and red arrowheads, Figs. 7(c) and S8 in Appendix). According to the variance in peptide sequence, it is suggested that the mutated residues near C terminus (i.e., R22A, K23A, R24Q, and Q26L) are mainly responsible for the enhanced aggregation of the variants. This is further verified by the control simulations with MelP5'(A10T), another variant of MelP5 (Fig. S9 in Appendix). In brief, the combination of these biased and unbiased simulations demonstrates that the residues approaching $C$ terminus of the peptide have an important effect on the aggregation of a peptide during its interactions with a membrane.

Fig. 7 (Color online) Aggregation of peptides on/in the membrane during the peptide-membrane interactions. (a) Evolution of peptide aggregation during the interaction process demonstrated by the cluster number (top) and the peptide number in the largest cluster (bottom). $P/L$=1/43. (b), (c) Free energy landscape of the aggregation of two peptides (b) and the projection along different CVs (c). Inset in (c) represents definition of the two CVs, $\Delta D$ and $\theta$, which are used to describe the aggregation condition of the two peptides. |
Importantly, peptide aggregation has a complicated effect on the peptide-membrane interactions. For example, it could affect the formation probability of U-shaped peptide. Here, we take melittin as an example. Actually, it is difficult for a single melittin to form "U" conformation inside the membrane (Fig. 5(b)).
However, even in the two-melittin case, situation is totally changed. In the corresponding free energy landscape (Figs. 8(a) and S10 in Appendix), several energy minima appear, which are associated with "U" conformation of melittin (III-V, Figs. 8(a) and 8(c)), in addition to the basin referring to the initial membrane binding state of the two peptides (I, Figs. 8(a) and 8(c)); accordingly, the free energy of forming U-shaped peptide (for each peptide) is significantly reduced as compared with the single-peptide case (solid and dashed lines in Fig. 8(b)). This indicates that the realization of "U" conformation of a peptide could be greatly facilitated with the help of a neighbor one, which is also helpful for understanding the membrane poration of melittin at a higher $P/L$ ratio.

Fig. 8 (Color online) Free energy landscape of the interaction between membrane and two melittin peptides. (a) Landscape with the CVs of $Z_{\rm kink}$ values of the two peptides. (b) Energy projection along the CV of $Z_{\rm kink1}$. (c) Snapshots corresponding to the energy minima states in (a). |
4 Conclusion
The sequence-determined structure and function of peptides and proteins are one of the most fundamental biophysical issues. Herein, with the combination of CG MD and MetaD simulations, the pore-forming ability of melittin and its gain-of-function variants is investigated in a residue-specialized way. Molecular details of the kinetics of membrane poration by peptides, including the residue-based energy between peptide and the membrane leaflets, are analyzed. Formation of U-shaped conformation and aggregation of peptides, as key intermediate states for pore formation, are demonstrated in the unbiased simulations, which are further included as CVs for the reconstruction of multi-dimensional free energy landscapes of peptide-membrane interactions. Based on these kinetic and thermodynamic descriptions of peptide-membrane interactions, the roles of different residues in determining the configuration and ability of a peptide in pore formation are elucidated. For example, the conformational changes of residues K7 and T11 are directly related to the membrane translocation of the $N$ terminus of the peptide; residue T10 could affect the function of the kink region, and in turn has a significant influence on the formation of U-shaped conformation of the peptide (the intermediate interaction state) and the final pore formation; peptide aggregation is regulated by residues close to $C$ terminus and facilitates membrane poration of the peptide. These results are helpful for understanding the molecular mechanism of membrane activity of pore-forming peptides, and are also useful to guide the design of novel peptides for biomedical applications.
Appendix
Table S1 Decrease of membrane thicknes(-∆h/h)×100% |
 |
Table S2 Increase of membrane area(-∆A/A)×100% |
 |
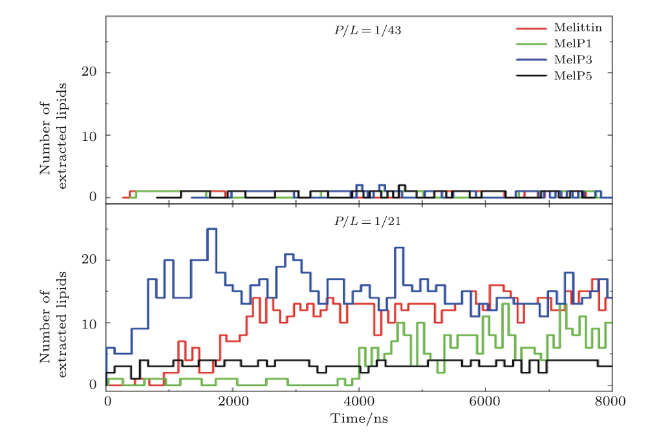
Fig. S1 (Color online) Number of lipids extracted from the bilayer membranes by melittin or its variants at $P/L$=1/43 (top) or 1/21 (bottom). Lipid extraction behavior occurs mostly at the high $P/L$ ratio. |
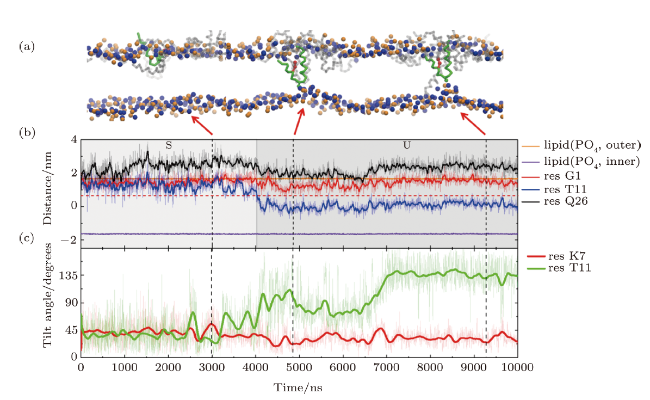
Fig. S2 (Color online) U-shaped MelP5 in a T-pore (the same trajectory as shown in Fig. 3). (a)Snapshots showing different interaction states between MelP5 and membrane (S and U). The peptide,which can have a U-shaped conformation, is colored with green, and the others are grey (includethe T-shaped MelP5). (b) Evolution of locations of termini (residues G1 and Q26) and kink part(residue T11) of the peptide (the green one in (a)). For comparison, the locations of lipid heads(PO4 groups) of outer and inner leaflet are also shown, respectively. (c) Changes of tilt angles (inset)of residues K7 and T11. For the U-shaped MelP5, flip of the side chain of residue T11 occurs while the configuration change of basic residue K7 does not, compared with the T-shaped MelP5 (see Fig. 3 in main text). The similarity in configuration changes of residue T11 and the difference in K7 indicate their roles in the formation of U-shape conformation of a peptide and the translocation of its $N$ terminus, respectively. $P/L$=1/43. |
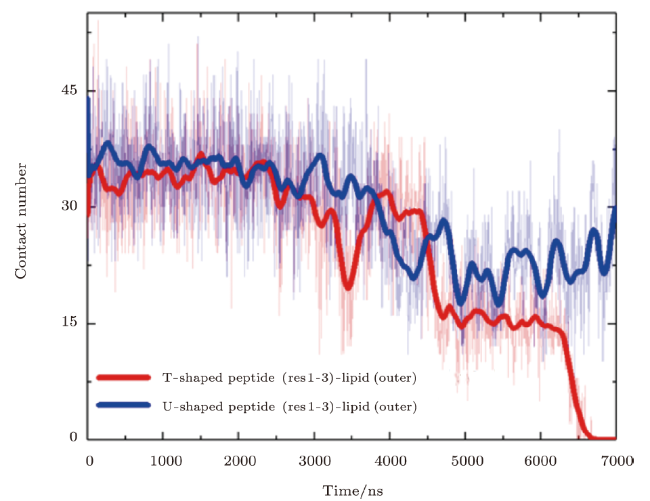
Fig. S3 (Color online) Contact situations of the $N$ terminus of a MelP5 with the transmembrane conformation (denoted as T-shaped) or a MelP5 with U-shaped conformation with the lipid heads in the outer leaflet of the bilayer. After the formation of U-shaped conformation ($\geq$4000 ns), the contact number between the $N$ terminus of the T-shaped MelP5 and lipid heads in the outer leaflet becomes obviously smaller than that of the U-shaped MelP5, and decrease to zero finally. This difference possibly caused by the peptide aggregation, along with flip of side chain of K7 of the peptide (as shown in Figs. 3 and S2), weakens the interaction between the $N$ terminus of the peptide and lipid heads, and facilitates the membrane translocation of the $N$ terminus of the peptide. $P/L$=1/43. |
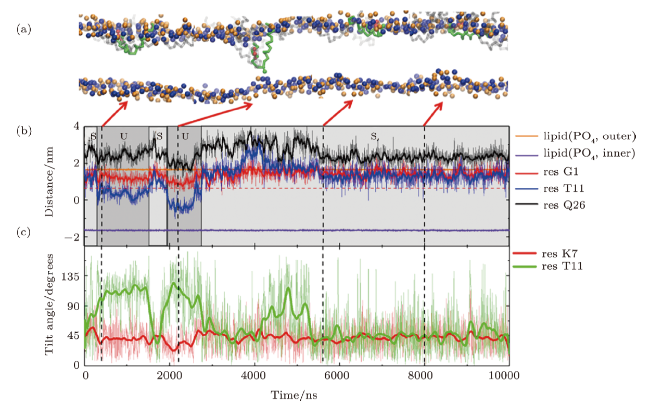
Fig. S4 (Color online) Formation process of an unstable U-pore under the action of melittin at $P/L$=1/43. (a) Snapshots showing different interaction states between melittin and membrane ("S" and "U"). One U-shaped peptide is tracked and colored green (with residue K7 in red), while the others are grey. (b), (c) Time-dependent evolution of the z-position (b) and tilt angle (c) of key residues during the interaction process, including G1, Q26, T11, and K7. |
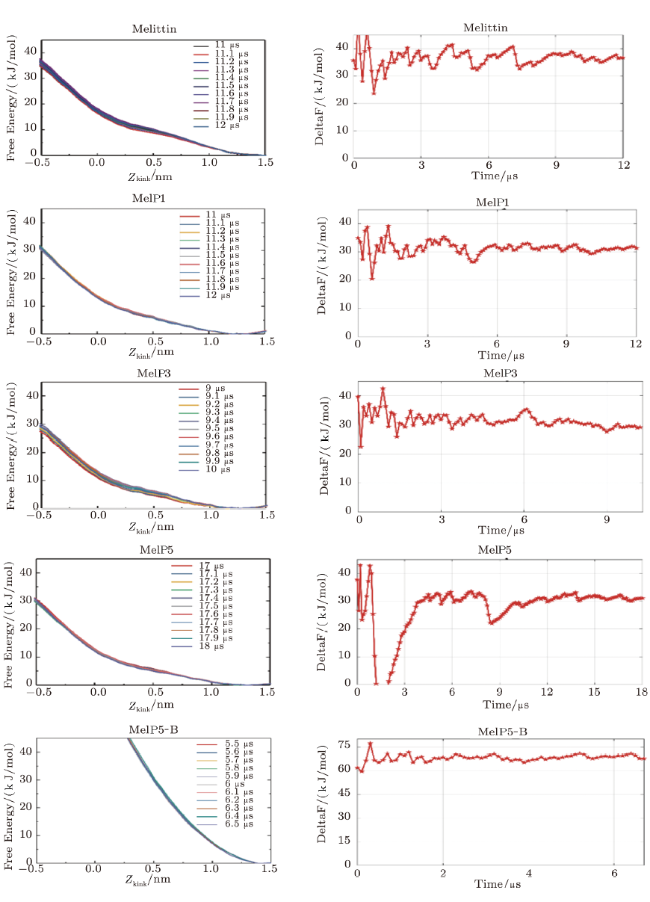
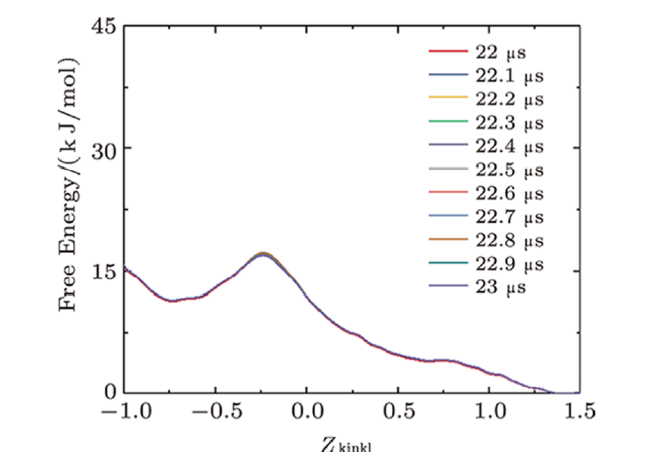
Fig. S5 (Color online) Convergence of the free energy of the formation of U-shaped peptides. Left: Evolution of the free energy profile with time; Right: the line refers to the free energy difference between the membrane binding state ($Z_{\rm kink}=1.2\sim1.5)$ and the U-shaped conformation state ($Z_{\rm kink}=-0.5$) of the peptide. For MelP5\_B. the convergence is judged by the free energy difference between the membrane binding state ($Z_{\rm kink}=1.2\sim1.5$) and that at $Z_{\rm kink}$=0. |
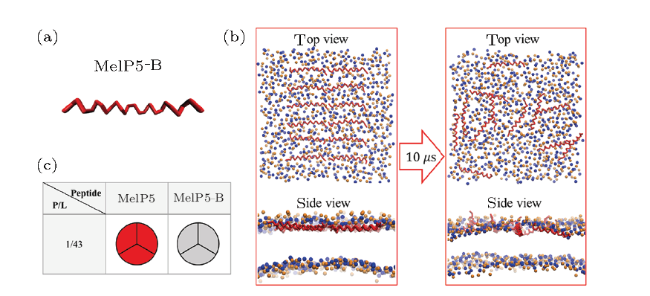
Fig. S6 (Color online) (a) Conformational structure of MelP5-B which is the structure-variant of MelP5. (b) Interaction states between MelP5-B and the lipid bilayer. (c) Formation probability of membrane pore under the action of MelP5-B at $P/L$=1/43. For each parameter, three independent runs are performed to make statistics. Red: T-pore; grey: no pore. Herein, control simulations are carried out to confirm the important role of the kink structure of the peptide. A variant of MelP5, named MelP5-B, is built. MelP5-B has the same amino acid sequence as MelP5 while with a full $\alpha$-helical chain structure, but without the non $\alpha$-helical kink region (Fig. S6(a)). Energy calculations show that it is rather difficult for this peptide to form a "U" conformation (dashed line in Fig. 6(b) in main text); simultaneously, transmembrane pore is hard to form (Figs. S6(b)-S6(c)). |
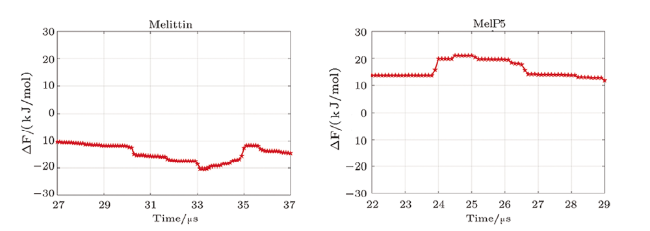
Fig. S7 (Color online) Convergence of the free energy of the transmembrane penetration of a melittin and MelP5.The lines refer to the free energy difference between the two saddle-points of two pathways (path U or T) in each free energy surface. The ranges of two saddle-points of two pathways are: for melittin, ($Z_{\rm kink}=(1.21\sim1.27$) nm, $Z_N=(0\sim0.15)$ nm) and ($Z_{\rm kink}=(-0.92\sim-0.87$) nm, $Z_N=(-0.4\sim-0.2$) nm); for MelP5, ($Z_{\rm kink}=(1.17\sim1.21$) nm, $Z_N=(-0.1\sim0.03$) nm) and ($Z_{\rm kink}=(-0.8\sim-0.75$) nm, $Z_N=(0.15\sim0.25)$ nm). The fluctuation range of $\Delta F$ is less than 10 KJ/mol. |
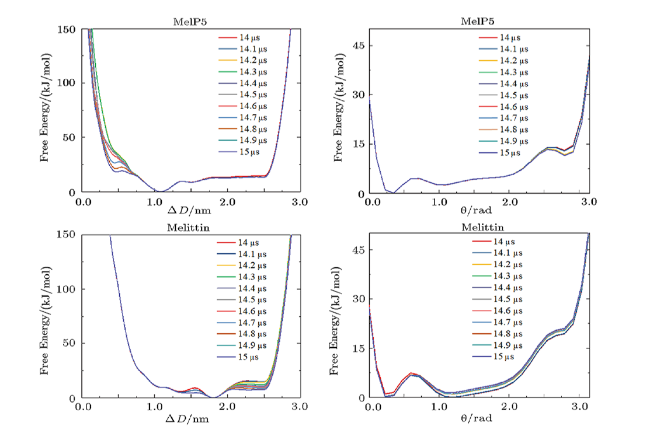
Fig. S8 (Color online) Convergence of the free energy of the aggregation of two peptides on a membrane surface. Lines show the evolution of the free energy profile along with different CVs. |
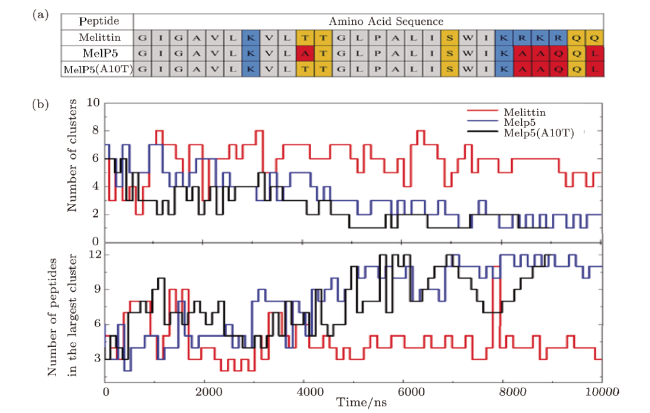
Fig. S9 (Color online) (a) Amino acid sequences of a variant of MelP5, named MelP5'(A10T).Color codes are same as those in Fig. 1 in the main text. (b) Peptide aggregation on the membrane surface indicated by cluster number (top) and the peptide number in the largest cluster (bottom).$P/L=43$. The results shown here show the aggregation situation of MelP5'(A10T). It is found that,although the 10th residue is changed back from A to T in MelP5'(A10T) (Fig. S9(a)),its aggregation situation is almost the same as that of MelP5 (Fig. S9(b)). |
Fig. S10 (Color online) Convergence of the free energy of the interaction between two melittins and the membrane. Lines show the evolution of the free energy profile along with CV of $Z_{\rm kink1}$. |