


1 Introduction
Scale-invariance behaviors have been observed in the written text, such as the famous Zipf's law and Heaps' law.[1]-[5] Zipf's law satisfies that if we rank words in a descending order of their appearance frequencies, the relationship of the frequency to the rank is a power-law (or called scale-invariance). Heaps' law describes another form of power-law: the number of distinct words, i.e., vocabulary, in a text is a power law function of the text length. These two laws are characterized by scaling exponents. In particular, the scaling exponent of Zipf's law and Heaps's law is around 1.0 and around 0.8, respectively.[2]-[5] Interestingly, each exponent is slightly different between distinct authors or distinct types of documents. Therefore, the values of exponents are suggested to reflect the writing style and to be a potential index to identify distinct authors.
Zipf's law and Heaps' law focus on the level of words. Additionally, the scale-invariance in higher levels, e.g. sentence and paragraph, have also been observed in the written text. Reference [6] investigated series of sentence lengths (the number of words for one sentence) and found the scale-invariance behavior in more than one hundred classical novels from around the world. Recently, we found that the scale-invariance behavior and the scaling exponent around 0.6 also exist in multiple levels, including the series of the number of strokes for one Chinese character, the series of the length of one sentence (the number of characters for one sentence), and the length of one paragraph (the number of sentences for one paragraph).[7]-[8] The scaling-exponent larger than 0.5 in each level suggests that there is a long-range correlation in these series.
In the present study, we examine the scale-invariance in the series of character intervals for the four great Chinese novels by the method of detrended fluctuation analysis (DFA).[9] In addition, each novel is divided into three parts of equal number of chapters, and then, the DFA is applied to the series of intervals for each part. The rest of the articles is organized as the following. In Sec. 2, we present the definition for series of character intervals and briefly introduce the DFA; in Sec. 3, the results are presented, including the analysis of integrated series for each novel and the analysis of series for each part; at last, the conclusions and discussions are included in Sec. 4.
2 Methods
2.1 Definition for Series of Character Intervals
In addition, each novel was divided into three parts with equal number of chapters. For instance, the three parts are from 1 to 40 chapters, from 41 to 80 chapters, and from 81 to 120 chapters, respectively, in A dream of red mansions. Within each part, the interval series $x_i$ was recalculated by the method of Fig. 1.
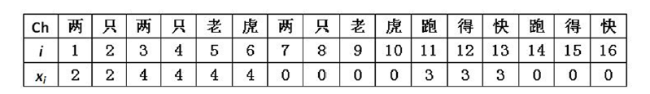
Fig. 1 An example for the definition for the interval series $x_i$. $i$ represents the ordinal number of the character. "Ch" is abbreviation of "character". Here, the length of the series is $N=16$. |
2.2 Description of Detrended Fluctuation Analysis
The scale-invariance behavior (or power-law) in non-stationary time series was widely examined by the method of detrended fluctuation analysis (DFA).[9] Based on this method, it has been observed that the scale-invariance behavior exists in the DNA nucleotides, physiological signals, behavioral activities, long-range weather forecasting, economical time series, solid-state dynamics as well as written text.[7]-[11] The steps for the calculation of the DFA are as follows.
Step 1 The original series $x_i$, $i=1,\ldots,N$, was altered to be $y_i=\sum_{j=1}^i (x_j-\langle x\rangle)$, $i=1,\ldots,N$, where the value of $y_i$ is the cumulative sum of $x_i$ and $\langle x\rangle$ is the mean of the whole series ($\langle x\rangle={\sum_{k=1}^N x_k}/{N}$).
Step 2 The integrated series $y_i$ was divided into $m$ non-overlapping windows with equal length (the number of data points) of $n={N}/{m}$, where $n$ represents the time scale.
Step 3 In each window, the $n$ data points $y_i$ were fitted by a second-order polynomial function, which was used as a local trend. Then, these $n$ data points were subtracted from the local trends to obtain the residuals $z_i$.
Step 4 For the entire integrated time series, the fluctuation $F(n)$ is equal to $\sqrt{{\sum_{i=1}^N z_i^2}/{N}}$.
Step 5 We changed the time scale $n$ ($4 \le n \le {N}/{10}$), and repeated Steps. 1—4.
Step 6 The amplitude fluctuation $F(n)$ was plotted as a function of the time scale $n$ in a double-logarithmic coordinate.
If the relationship of $F(n)$ to $n$ is linear in the double-logarithmic coordination, there is a power law form for $F(n)$ ($F(n)=n^r$), where the scaling exponent $r$ is the slope of the linear relationship. The value of $r$ quantifies the scale-invariant correlation of the fluctuations. If $r$ is equal to 0.5, there is no correlation in the interval fluctuations, which corresponds to white noise. If $r$ is smaller than 0.5, there is negative correlation in the fluctuations, i.e., smaller values are more likely to be followed by larger values and vice versa. If $r$ is larger than 0.5, positive correlation exists in the fluctuations, i.e., larger values have larger possibility of being followed by larger values and vice versa.
3 Results
In this section, in order to examine the scale-invariance behaviors, we apply the DFA to the interval series for each novel as well as the interval series for each part of each novel. The scale-invariance behaviors in the series of character intervals for each novel are shown in Fig. 2.
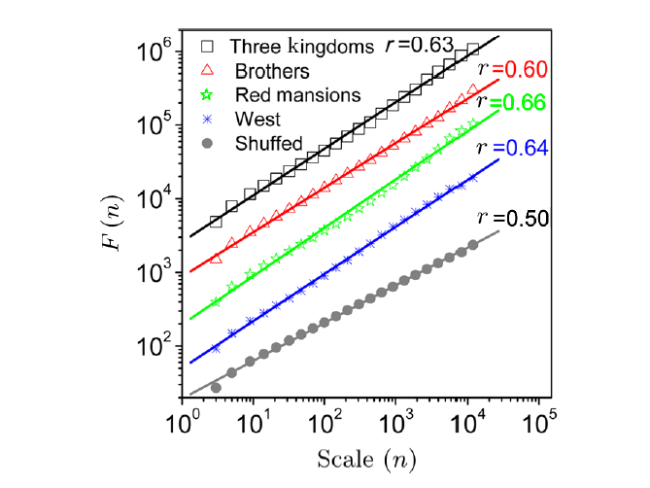
Fig. 2 (Color online) The scale-invariance behavior in the series of character intervals for the four great Chinese novels. "Three Kingdoms", "Brothers", "Red Mansions" and "West" represent Romance of the three kingdoms, All men are brothers, A dream of red mansions and The journal to west, respectively. Shuffled data is produced from the interval series of A dream of red mansions. Note that, for visibility, the value of $F(n)$ is divided by 4, 16, 64, 256 for Brothers of the scale-invariance behavior, Red Mansions, West and Shuffled, respectively. |
It is visible that, all the four novels maintain the scale-free behaviors characterized by scaling exponents $r$ across multiple scales from $n=3$ to $10^4$. The scaling exponents $r$ are around 0.60 for all the novels, which are significantly larger than the scaling exponents $r=0.50$ for the shuffled data (paired $t$-test, $p=0.008)$. This suggests that there is a long range correlation of the series. Additionally, there is difference in the exponents $r$ between these four novels. In particular, the exponent is largest ($r=0.66$) for Red mansion, and is smallest $r=0.60$ for The brothers. This difference implies that the exponents may reflect the writing styles, and can potentially identify different authors. Accordingly, we examine whether one novel shows more than one writing style based on the values of the scaling exponents in the follows.
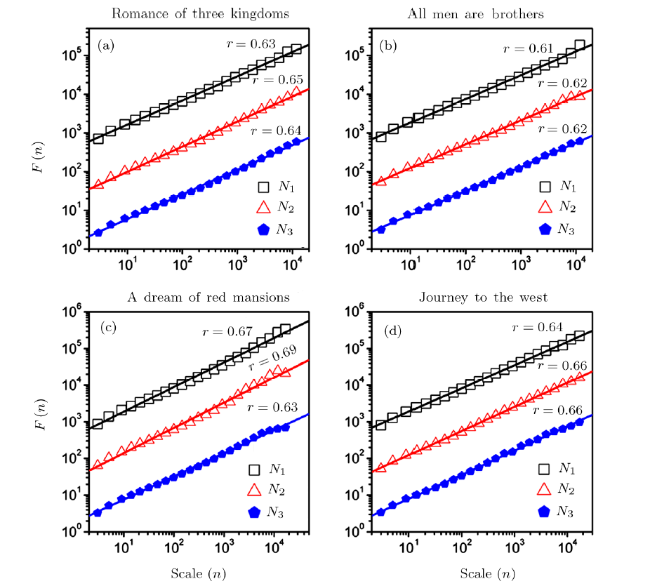
Next, the scale-invariance behaviors in the time series of character intervals for individual part within each novel are shown in Fig. 3. We observe that the scale-free behaviors exits in each part for all the four novels, and all the scaling exponents $r$ are around 0.60 which are not significantly different with the scaling exponents of novels in Fig. 2 ($t$-test, $p=0.26$) and significantly different with the scaling exponents of shuffle data (paired $t$-test, $p=0.0001$). Apparently, the largest difference of the scaling exponents $r$ between individual parts is observed in A dream of red mansions. In particular, the differences are $d_{12}= |r_1-r_2|= |0.67-0.69|=0.02$, $d_{23}= |0.69-0.63|=0.06$ and $d_{31}=|0.63-0.67|=0.04$, and the differences are relatively small in the other three novels, maximal value of which is $d_c=0.02$. Therefore, in A dream of red mansions, both $d_{23}$ and $d_{31}$ are larger than $d_c$, whereas $d_{12}$ is equal to $d_c$. Accordingly, the scaling exponents $r$ are possibly different between the first (or second) part and the third part in A dream of red mansions.
Fig. 3 (Color online) The scale-invariance behavior in the series of character intervals for individual parts within each novel, in Romance of the three kingdoms (a), All men are brothers (b), A dream of red mansions (c) and The journal to west (d). $N_1$, $N_2$ and $N_3$ represent the first part, second part and the last part within one novel. $r$ is the scaling exponent. Note that, for visibility, the value of $F(n)$ is divided by 4 and 16, for $N_2$ and $N_3$, respectively. Note that the mean of exponents for the three parts is not equal to the exponent for the whole novel, because the interval series for each part is redefined based on the method of Fig. 1, but not directly selected from the integrated interval-time-sires of the whole novel. |
Finally, we examine this possibility based on the confidence bound on the significance of the scaling exponents $r$ in the following steps. Firstly, each part of A dream of red mansions is divided into four subparts ($n=4$) of equal length, for which the scaling exponents $r$ are calculated. Secondly, based on these scaling exponents for subparts, we calculate the mean and standard deviation for each part ($n=4$), i.e., $0.67\pm0.01$, $0.69\pm0.02$ and $0.63\pm0.01$ for the first, second and third part, respectively. Thirdly, the 95% confidence bound on the significance of $r$ (Mean-2*SD, Mean+2*SD) is obtained: (0.65,0.69), (0.65,0.73) and (0.61,0.65) for each part, respectively. Hence, the scaling exponents $r$ are different between the first (or second) part and the third part. Our findings suggest that there are two writing styles based on this analysis, i.e., one is for the former two parts and the other is for the latter part in A dream of red mansions.
4 Conclusion and Discussion
In the present study, the method of DFA was applied to the series of character intervals for four Chinese great novels. We found that the scale-invariance behaviors exist in all series across multiple scales that are characterized by the scaling exponents about 0.60. Because these scaling exponents are larger than 0.5, there are long-range correlations in the interval series of the novels. This is consistent with the existence of long range in the series of other parameters in text, such as the number of strokes for one Chinese character, the length of one sentence and the length of one paragraph.[7]-[8]
In addition, each novel was divided into three parts, and the scaling-invariance behaviors were examined for each part of the novels. We found that the top two largest differences of scaling exponents exist between the first and the third part, and between the second and the third part in A red dream of mansions. Therefore, we suggest that there be two writing styles for A red dream of mansions and the number of writing styles be not more than one for the other novels. Our findings support the prevailing view that the first 80 chapters and the last 40 chapters were accomplished by Xueqin Cao and E Gao, respectively, in A red dream of mansions, while there is no convincing evidence can reveal that the number of authors for the other three novels is more than one. Our method may shed light on the writing styles.
In the previous studies, the difference of the scale-free behaviors in the word organization, such as the distribution of word frequency, Zipf rank of frequency and Heaps scaling law, was observed between different written languages[12]-[13] and between written language and spoken language,[14] respectively. In addition, the scale-free behaviors also differ in distinct books of the same written language.[13] It is interesting to examine whether the scale-free behaviors are the same in books written by the same author based on current method or traditional methods in future.