


1. Introduction
2. Quantum walk with PDC
2.1. Classification of probability distributions
2.1.1. Free localized walk
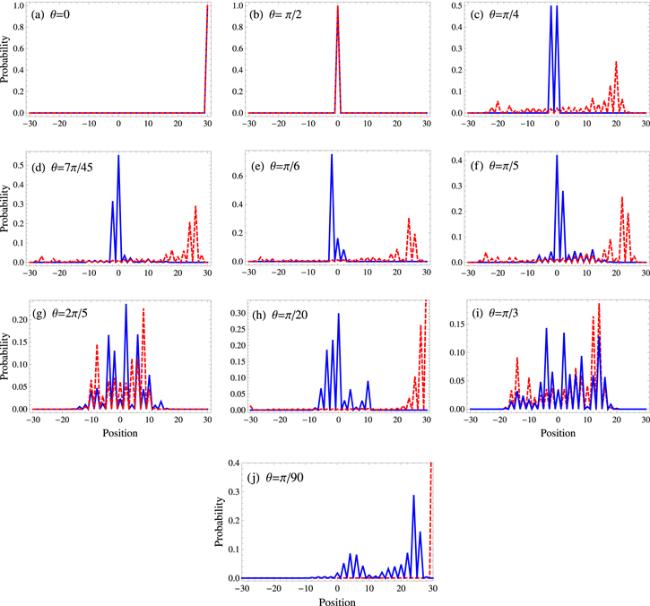
Figure 1. Probability distribution of the walk after T = 30 for different rotation angles θ (indicated in the inset). The solid blue line represents the quantum walk with a position-dependent coin, and the dashed red line represents the quantum walk with a position-independent coin. |
2.1.2. Bounded localized walk
2.1.3. Bounded periodic walk
2.1.4. Classical-like walk
2.1.5. Bounded classical-like walk
2.1.6. Fast classical-like walk
2.1.7. Semi-classical-like walk
2.1.8. Bounded semi-classical-like walk
2.1.9. Fast semi-classical-like walk
2.1.10. Bounded quantum-like walk
2.2. Shannon entropy
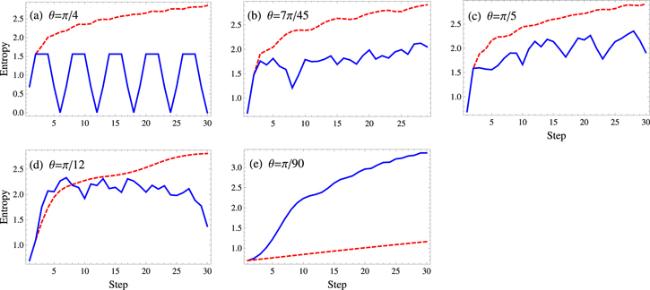
| • | Entropy is a measure of uncertainty in the state of the walker. Thus for a localized walk the entropy is always zero. This is the case for the two classes of walk, i.e. free localized walk (θ = 0) and bounded localized walk (θ = π/2). |
| • | For other rotation angles, the evolution of entropy shows three types of behavior, i.e. bounded periodic, bounded, and unbounded. |
| • | For a bounded periodic walk (θ = π/4) the entropy is bounded periodic as the uncertainty in the position state of the system periodically changes. Whenever the walker is localized the entropy of the state is 0, for the two-peak-zone entropy is 0.7, and for the three-peak-zone the entropy is 1, as shown in figure 2(a). |
| • | Entropies of the bounded walks are bounded but non-periodic. In this case the entropies of the walk do not increase after reaching their corresponding maximum limit, as shown in figures 2(b), (e), (h). |
| • | For other classes of walk the behavior of the Shannon entropy is unbounded, i.e. it increases with the number of steps, as shown in figures 2(c), (d), (f), (g). |
| • | The entropy for a quantum walk with PDC is lower as compared to PIC except for the bounded quantum-like walk. The exception is because this class of walk is observed for a small rotation angle (closer to 0). In this case, a quantum walk with PIC shows localized-like behavior and hence the corresponding entropy of the walk becomes lower. The same trend in the entropy is seen in the case of a bounded semi-classical-like walk. However, here this holds only for a smaller number of steps. For semi-classical-like and fast semi-classical-like walks the entropy has the same behavior for PDC and PIC. In both types of walk, the entropy increases with the number of steps. |
| • | For a periodic walk SC shows periodic behavior. When the walk is localized then SC is zero, similar to SP. This takes place for specific values of T in a periodic walk. |
| • | For all subclasses of the classical-like walks SC is lower compared to their PIC counterparts. Generally, our results show that SC of a walk with PDC is lower compared to PIC except for the bounded semi-classical-like and bounded quantum-like walks. For semi-classical-like and fast semi-classical-like walks, SC is almost same and increases with the number of steps in both PDC and PIC cases. |
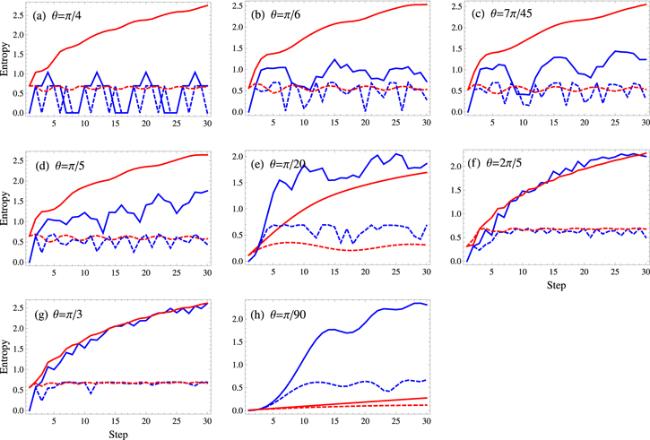
Figure 2. Shannon entropy versus the number of steps T. The blue line represents the quantum walk with PDC and the red line represents the quantum walk with PIC. The solid (dashed) line indicates the Shannon entropy associated with the position (coin) space. |
Table 1. Classification of the probability distribution for quantum walks with a position-dependent coin. |
| Classes of walk | Rotation angle (θ) |
|---|---|
| Free localized walk | 0 |
| Bounded localized walk | π/2 |
| Bounded periodic walk | π/4 |
| Classical-like walk | 7π/45 |
| Bounded classical-like walk | π/6 |
| Fast classical-like walk | π/5 |
| Semi-classical-like walk | 2π/5 |
| Bounded semi-classical-like walk | π/20 |
| Fast semi-classical-like walk | π/3 |
| Bounded quantum-like walk | π/90 |
2.3. Standard deviation
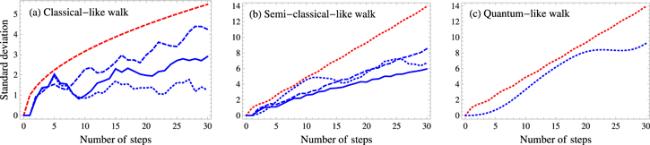
Figure 3. Standard deviation (σ) versus the number of steps of the walk for T = 30. (a) The dashed red line shows the standard deviation of a simple classical random walk ($\sigma =\sqrt{T}$). The dotted blue line represents a bounded classical-like walk, the solid blue line represents a normal classical-like walk, and the dashed blue line represents a fast classical-like walk. (b) The dotted red line shows the standard deviation of a simple Hadamard walk with position-independent coin ($\sigma \approx T$). The dotted blue line represents a bounded semi-classical-like walk, the solid blue line represents a normal semi-classical-like walk, and the dashed blue line represents a fast semi-classical-like walk. (c) The dotted red line shows the standard deviation of a simple Hadamard walk with a position-independent coin ($\sigma \approx T$). The dotted blue line represents a bounded quantum-like walk. |
2.3.1. Classical-like walk
2.3.2. Semi-classical-like walk
2.3.3. Quantum-like walk
3. Quantum walk with PDEC
3.1. Probability distribution
| 1. For θ = 0, in figure 4(a) the probability distribution of both types of walk, i.e. a quantum walk with PDEC and one with PIEC, show similar behavior. After T steps of both types of walk, the walker occupies positions x = ±T each with probability 0.5. | |
| 2. For θ = π/2, in figure 4(b) the probability distribution of the quantum walk with PDEC shows similar behavior to the one with PIEC. The walker is localized at position x = 0 for an even number of steps. For odd values of T the probability of the walker splits equally on two lattice sites x = ±1. | |
| 3. For θ = π/4, in figure 4(c) the probability distribution of the quantum walk with PDEC is periodic and bounded to the range of lattice sites x = ±2. For any value of T there are three possible configurations of the probability distribution: (a) the walker has probability 1 at position x = 0 (localized), (b) the walker occupies positions x = ±1 each with probability 1/2, (c) the walker occupies positions x = 0, ±1 each with 1/4 probability, and x = ±2 both with 1/8 probability. For this rotation angle, the probability distribution of the walk with PIEC shows a three-peak-zone. By increasing the number of steps the probability increases at the initial position. The behavior of the probability distribution does not depend on the choice of the initial state in contrast to the case of PDEC. | |
| 4. For θ = 7π/45, in figure 4(d) the probability distribution of the walk with PDEC shows bounded behavior. Moreover, the walker has a higher probability at the initial position as compared to the other accessible lattice sites. In the case of PIEC, the number of occupied positions increases with the number of steps and the maximum probability is at positions x = ±T. | |
| 5. For θ = π/5, in figure 4(e) the probability distribution of the walk with PDEC increases with T at the initial position, i.e. the walker becomes more localized as compared to the walk with PIEC. | |
| 6. For θ = π/90, in figure 4(f) the quantum walk with PDEC shows maximum probability towards the sides. Although there is a small probability near the initial position of the walker, it increases with the number of steps of the walk. For a quantum walk with PIEC the probability is maximum at positions x = ±T, which resembles the case of θ = 0. |
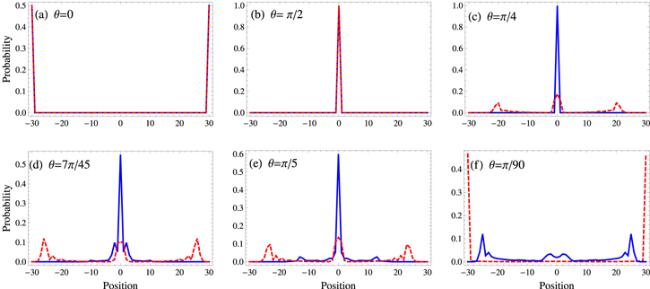
Figure 4. Probability versus position for T = 30 and initial state Φint1. The solid blue line represents position-dependent entangled coins (PDEC), and the dashed red line represents position-independent entangled coins (PIEC). |
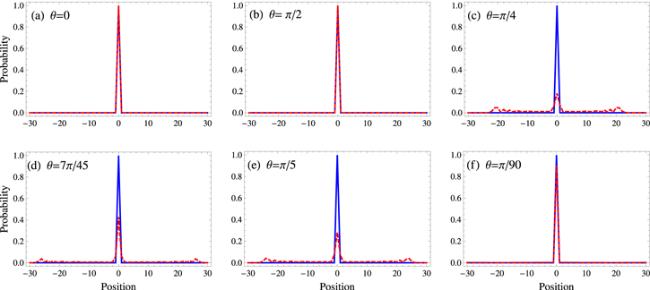
Figure 5. Probability versus position for T = 30 and initial state Φint2. The solid blue line represents position-dependent entangled coins, and the dashed red line represents position-independent entangled coins. |
3.2. Shannon entropy
Figure 6. Entropy versus the number of steps of the walk up to T = 30 and initial state Φint1. The solid blue line represents the Shannon entropy of the quantum walk with position-dependent entangled coins (PDEC) and the dashed red line represents the case of position-independent entangled coins (PIEC). Entropy is lower for PDEC as compared to PIEC for different rotation angles except for θ = π/90. |