


1. Introduction
In 2012, the Higgs boson, with a mass $\sim 125$ GeV, was discovered by experiments at the Large Hadron Collider (LHC) [1, 2], which opens a window for us to understand electroweak symmetry breaking. However, the Higgs mass in the standard model (SM) is quadratically divergent, which leads to fine-tuning problems [3]. In order to solve this problem, many new physics models beyond the SM have been proposed, such as extra dimensions [4], composite Higgs [5], little Higgs [6], twin Higgs [7], supersymmetric models [8], etc. In these models, vector-like quarks (VLQs) are introduced in order to alleviate the fine-tuning problem. VLQs are hypothetical spin-1/2 colored particles with left-handed and right-handed components that transform in the same way as the SM gauge group. The vector-like top partners in the VLQs have attracted a great deal of attention, since they cancel the largest quadratic divergence induced by the top quark loop. Many relevant studies of the vector-like top partner have been conducted in recent years [9].
The search for vector-like top partner T at LHC-13 TeV has been analyzed by ATLAS and CMS collaborations [10, 11]. This excludes top partner masses in the range $900\sim 1300\,\mathrm{GeV}$ at a 95% confidence level, and with an integrated luminosity of about 36 fb−1. Compared to the LHC, however, lepton colliders have a cleaner background, enabling the precise investigation of the properties of various particles. In recent years, many lepton collider schemes have been put forward, such as the Circular Electron Positron Collider (CEPC) [12], the International Linear Collider (ILC)[13], and the Compact Linear Collider (CLIC)[14]; these can run at variable center-of-mass energy ($\sqrt{s}$) ranging from 500 GeV to 3 TeV. In addition to ${e}^{+}{e}^{-}$ collision, these colliders can also realize γγ and eγ collisions by means of the backward Compton scattering of incident electron- and laser beams. For the ${e}^{+}{e}^{-}$ and γγ collision modes, the top partner needs to be pair produced (${e}^{+}{e}^{-}/\gamma \gamma \to T\bar{T}$), or single produced with four-body final state (${e}^{+}{e}^{-}/\gamma \gamma \to {e}^{-}{\nu }_{e}T\bar{b}$), so that their cross sections are much smaller than that at the eγ collision. The eγ collision exhibits unique properties to enable further investigations in the field of of single top partner physics, particularly in the case of polarized beams. It has the capacity to perform precise cross section measurements, due to large counting rates, and the absence of $t\bar{t}$ pair production background. In this work, we will study the search for single vector-like top partner production through the tZ channel at eγ collision in the littlest Higgs model with T-parity (LHT) model [15].
The remainder of this paper is organized as follows: Firstly, we briefly introduce the top partner in the LHT model in section 2 . Next, we generate the the signal and background events, and study the discovery potentiality of the T-even top partner T+ decaying to tZ at the high energy eγ collision in section 3 , where two decay final states are considered. Finally, we give our conclusions in section 4 .
2. Top partner in the LHT model
The LHT model is a non-linear sigma model, based on a SU(5) global symmetry, broken down to SO(5) at scale $f\sim { \mathcal O }$(TeV) by the vacuum expectation value (VEV) of the Σ field:
$ \begin{eqnarray}{{\rm{\Sigma }}}_{0}=\left(\begin{array}{rcl} & & {1}_{2\times 2}\\ & 1 & \\ {{\bf{1}}}_{2\times 2} & & \end{array}\right).\end{eqnarray}$
The breaking of global symmetry gives rise to 14 Goldstone bosons. Simultaneously, the gauge group ${\left[{SU}(2)\times U(1)\right]}_{1}\,\times {\left[{SU}(2)\times U(1)\right]}_{2}$ is also broken down to the diagonal SM electroweak group ${SU}{(2)}_{L}\times U{(1)}_{Y}$. Following the breaking of electroweak symmetry, 4 new gauge bosons ${W}_{H}^{\pm },{Z}_{H},{A}_{H}$ eat 4 Goldstone bosons and acquire mass, given at ${ \mathcal O }({v}^{2}/{f}^{2})$ by $ \begin{eqnarray}\begin{array}{rcl}{M}_{{W}_{H}} & = & {M}_{{Z}_{H}}={gf}\left(1-\displaystyle \frac{{v}^{2}}{8{f}^{2}}\right),\\ {M}_{{A}_{H}} & = & \displaystyle \frac{g^{\prime} f}{\sqrt{5}}\left(1-\displaystyle \frac{5{v}^{2}}{8{f}^{2}}\right),\end{array}\end{eqnarray}$
where g and $g^{\prime} $ are respectively the SM SU(2)L and U(1)Y gauge couplings, and the VEV v must be redefined as: $ \begin{eqnarray}\begin{array}{rcl}v & = & \displaystyle \frac{f}{\sqrt{2}}\arccos \left(1-\displaystyle \frac{{v}_{\mathrm{SM}}^{2}}{{f}^{2}}\right)\\ & \simeq & {v}_{\mathrm{SM}}\left(1+\displaystyle \frac{1}{12}\displaystyle \frac{{v}_{\mathrm{SM}}^{2}}{{f}^{2}}\right),\end{array}\end{eqnarray}$
with vSM = 246 GeV.In the top sector of this model, an additional vector-like top partner T+ is introduced to cancel the quadratically divergent contribution to Higgs mass caused by the top quark loop. The top partner T+ is T-even, the implementation of T-parity also requires its T-odd mirror partner T−. Following symmetry breaking, the top quark and its partners acquire mass, given at ${ \mathcal O }({v}^{2}/{f}^{2})$, by:
$ \begin{eqnarray}\begin{array}{rcl}{m}_{t} & = & \displaystyle \frac{{\lambda }_{2}{vR}}{\sqrt{1+{R}^{2}}}\left[1+\displaystyle \frac{{v}^{2}}{{f}^{2}}\left(-\displaystyle \frac{1}{3}+\displaystyle \frac{1}{2}\displaystyle \frac{{R}^{2}}{{\left(1+{R}^{2}\right)}^{2}}\right)\right]\\ {m}_{{T}_{+}} & = & \displaystyle \frac{f}{v}\displaystyle \frac{{m}_{t}(1+{R}^{2})}{R}\left[1+\displaystyle \frac{{v}^{2}}{{f}^{2}}\left(\displaystyle \frac{1}{3}-\displaystyle \frac{{R}^{2}}{{\left(1+{R}^{2}\right)}^{2}}\right)\right]\\ {m}_{{T}_{-}} & = & \displaystyle \frac{f}{v}\displaystyle \frac{{m}_{t}\sqrt{1+{R}^{2}}}{R}\left[1+\displaystyle \frac{{v}^{2}}{{f}^{2}}\left(\displaystyle \frac{1}{3}-\displaystyle \frac{1}{2}\displaystyle \frac{{R}^{2}}{{\left(1+{R}^{2}\right)}^{2}}\right)\right],\end{array}\end{eqnarray}$
where $R={\lambda }_{1}/{\lambda }_{2}$ is a dimensionless ratio, and λ1 and λ2 are two top quark Yukawa couplings. Since the T+ mass is always larger than the T-odd top partner T− mass, T+ can then decay into AHT−, apart from the usual decay modes (Wb, tZ, th).3. Event generation and discovery potentiality
In figure 1, we show the leading order Feynman diagrams of single ${\bar{T}}_{+}$ production at ${e}^{-}\gamma $ collision in the LHT model. We can see that these Feynman diagrams are the same as those of the SM, except that the SM top quark is replaced here by the heavy top partner. The new coupling vertexes, ${\bar{T}}_{+}{Wb}$ and ${\bar{T}}_{+}{Zt}$, involved in our calculation are given by:
$ \begin{eqnarray}{\bar{T}}_{+}{W}^{+\mu }b:\quad \displaystyle \frac{{\rm{i}}g}{\sqrt{2}}{({V}_{\mathrm{CKM}})}_{{tb}}\displaystyle \frac{{R}^{2}}{1+{R}^{2}}\displaystyle \frac{v}{f}[1+\displaystyle \frac{{v}^{2}}{{f}^{2}}{d}_{2}]{\gamma }^{\mu }{P}_{L}\end{eqnarray}$
$ \begin{eqnarray}{\bar{T}}_{+}{Z}^{\mu }t:\quad \displaystyle \frac{\mathrm{ig}}{{\rm{\cos }}{\theta }_{W}}\displaystyle \frac{R}{2}\displaystyle \frac{v}{f}\left[1+\displaystyle \frac{{v}^{2}}{{f}^{2}}\left({d}_{2}-\displaystyle \frac{{R}^{2}}{2}\right)\right]{\gamma }^{\mu }{P}_{L}\end{eqnarray}$
$ \begin{eqnarray}\mathrm{with}:\quad {d}_{2}=-\displaystyle \frac{5}{6}+\displaystyle \frac{1}{2}{\left(\displaystyle \frac{R}{1+{R}^{2}}\right)}^{2}({R}^{2}+4),\end{eqnarray}$
where ${P}_{L}=\displaystyle \frac{1-{\gamma }_{5}}{2}$ is the chiral projection operator and ${({V}_{\mathrm{CKM}})}_{{tb}}$ is one CKM element.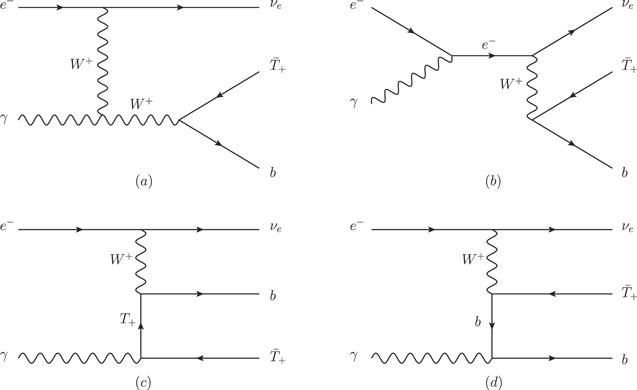
Figure 1. The leading order Feynman diagrams of single ${\bar{T}}_{+}$ production at ${e}^{-}\gamma $ collision. |
In the eγ collision mode, the use of polarized e− beams and photon beams is advantageous. Therefore, we show the ratio ${\sigma }_{P}/\sigma $ of ${e}^{-}\gamma \to {\bar{T}}_{+}b{\nu }_{e}$ cross sections at two different polarizations, ${P}_{{e}^{-}}$ and Pγ , in figure 2, where f = 800 GeV, R = 1 (corresponding to ${m}_{T}\,\approx $ 1120 GeV), and $\sqrt{s}$ = 2 TeV are selected as examples. We can see that the cross section has the largest value at Pe = − 1, and Pγ = 1, which can be explained as follows:
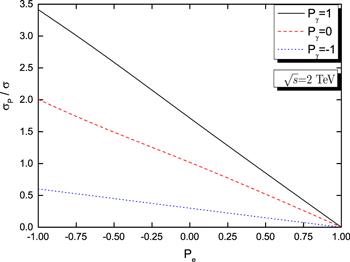
Figure 2. The ratio ${\sigma }_{P}/\sigma $ of ${e}^{-}\gamma \to {\bar{T}}_{+}b{\nu }_{e}$ cross sections at polarizations ${P}_{{e}^{-}}$ and ${P}_{\gamma }$, for f = 800 GeV, R = 1 (${m}_{T}\,\approx $ 1120 GeV) at $\sqrt{s}$ = 2 TeV. ${\sigma }_{P}$ denotes the polarized cross section, and σ denotes the unpolarized cross section. |
In the case of extreme relativity, the electron, neutrino, and b quark tend to be left-handed and their anti-particles tend to be right-handed. Due to weak V − A interaction, only the left-handed electron exhibits coupling with the W boson, so that the polarized cross sections decrease as the value ${P}_{e}\to 1$, and vanish when Pe = 1. Due to the conservation of angular momentum, the initial photon in vertex $\gamma {e}^{-}{e}^{+}$ of figure 1(b) tends to be left-handed, based on the initial left-handed electron, and the photon in vertex $\gamma b\bar{b}$ of figure 1 (d) tends to be right-handed, based on the final left-handed b quark. The initial photons in figure 1 (a) and figure 1 (c) can be left-handed or right-handed. Moreover, the largest contribution comes from the figure 1(d), so that the total cross section is dominated by the right-hand photon.
We can see that the proper polarized beam effectively enhances the cross section. Due to the technical limit of maximum polarization, we can only reach a value close to ${P}_{{e}^{-}}\times {P}_{\gamma }=-0.8$ for the incident beam. Therefore, we have selected ${P}_{{e}^{-}}=-0.8$ and Pγ = +1 for the following calculations.
In this work, we consider single vector-like top partner production in the tZ channel at eγ collision. For comparison, we have selected two decay modes for the final state signals, dependent on the leptonic or the hadronic decays of the W− and Z from the top partner, thus:
Following analysis, the main backgrounds originate from the processes ${e}^{-}\gamma \to {W}^{-}{ZZ}{\nu }_{e}$, ${e}^{-}\gamma \to t\bar{t}{W}^{-}{\nu }_{e}$, ${e}^{-}\gamma \to {{ZW}}^{-}h{\nu }_{e}$, and ${e}^{-}\gamma \to \bar{t}{bZ}{\nu }_{e}$. For clarity, we summarize these signal and background processes in table 1.
| • | Mode A: ${e}^{-}\gamma $ $\to $ ${\bar{T}}_{+}b{\nu }_{e}$ $\to $ $(\bar{t}Z)b{\nu }_{e}$ $\to $ $({W}^{-}\bar{b}{l}^{+}{l}^{-})b{\nu }_{e}\,\to ({jj}\bar{b}{l}^{+}{l}^{-})b{\nu }_{e}$. |
| • | Mode B: ${e}^{-}\gamma $ $\to $ ${\bar{T}}_{+}b{\nu }_{e}$ $\to $ $(\bar{t}Z)b{\nu }_{e}$ $\to $ $({W}^{-}\bar{b}{jj})b{\nu }_{e}\,\to ({l}^{-}\bar{{\nu }_{l}}\bar{b}{jj})b{\nu }_{e}$. |
Table 1. The processes of signals (S) and backgrounds (B) for two modes. |
| Process | Mode A | Mode B | |
|---|---|---|---|
| S | ${e}^{-}\gamma \to {\bar{T}}_{+}b{\nu }_{e}$ | ${\bar{T}}_{+}\to \bar{t}Z$, $\bar{t}\to {jj}\bar{b}$, $Z\to {l}^{+}{l}^{-}$ | ${\bar{T}}_{+}\to \bar{t}Z$, $\bar{t}\to {l}^{-}\bar{{\nu }_{l}}\bar{b}$, $Z\to {jj}$ |
| B1 | ${e}^{-}\gamma \to {W}^{-}{ZZ}{\nu }_{e}$ | ${W}^{-}\to {jj}$, ${Z}_{1}\to {l}^{+}{l}^{-}$, ${Z}_{2}\to b\bar{b}$ | ${W}^{-}\to {l}^{-}\bar{{\nu }_{l}}$, ${Z}_{1}\to {jj}$, ${Z}_{2}\to b\bar{b}$ |
| B2 | ${e}^{-}\gamma \to t\bar{t}{W}^{-}{\nu }_{e}$ | $t\to {l}^{+}{\nu }_{l}b$, $\bar{t}\to {W}^{-}\bar{b}$ ${W}_{1}^{-}\to {l}^{-}{\bar{\nu }}_{l}$, ${W}_{2}^{-}\to {jj}$ | $t\to {jjb}$, $\bar{t}\to {W}^{-}\bar{b}$ ${W}_{1}^{-}\to {l}^{-}{\bar{\nu }}_{l}$, ${W}_{2}^{-}\to {jj}$ |
| B3 | ${e}^{-}\gamma \to {{ZW}}^{-}h{\nu }_{e}$ | $Z\to {l}^{+}{l}^{-}$, ${W}^{-}\to {jj}$, $h\to b\bar{b}$ | $Z\to {jj}$, ${W}^{-}\to {l}^{-}\bar{{\nu }_{l}}$, $h\to b\bar{b}$ |
| B4 | ${e}^{-}\gamma \to \bar{t}{bZ}{\nu }_{e}$ | $\bar{t}\to {jj}\bar{b}$, $Z\to {l}^{+}{l}^{-}$ | $\bar{t}\to {l}^{-}\bar{{\nu }_{l}}\bar{b}$, $Z\to {jj}$ |
In the following calculations, there are only two relevant LHT model parameters, i.e. the scale f and the ratio R. The relevant SM input parameters [16] are taken as follows:
$ \begin{eqnarray*}\begin{array}{rcl}{m}_{t}=173.0\,\mathrm{GeV},{m}_{Z} & = & 91.1876\,\mathrm{GeV},\quad {m}_{h}=125\,\mathrm{GeV},\\ {\sin }^{2}{\theta }_{W} & = & 0.231,\quad \alpha ({m}_{Z})=1/128.\end{array}\end{eqnarray*}$
We generate signal and background events with MG5_aMC_v2.3.3 [17], then transmit these parton-level events to Pythia 6 [18] for showering and hadronization. We construct fast detector simulations using Delphes [19], and cluster jets by Fastjet [20] with the anti − kt algorithm [21], where the distance parameter ΔR = 0.4. Finally, we analyze the reconstructed-level events using MadAnalysis 5 [22]. We use EasyScan_HEP [23] to connect these programs, and to scan the parameter space.
In this paper, we have selected four signal benchmark points as examples:
| • | f800_R1: f = 800 GeV, R = 1 (${m}_{T}\,\approx $ 1120 GeV); |
| • | f800_R2: f = 800 GeV, R = 2 (${m}_{T}\,\approx $ 1440 GeV); |
| • | f1000_R1: f = 1000 GeV, R = 1 (${m}_{T}\,\approx $ 1440 GeV); |
| • | f1000_R2: f = 1000 GeV, R = 2 (${m}_{T}\,\approx $ 1750 GeV). |
3.1. Mode A, ${W}^{-}\, \rightarrow \,{jj}$ and $Z\, \rightarrow \,{l}^{+}{l}^{-}$
In this section, we will study the exclusion ability of eγ collision relating to top partner mass in mode A. In order to improve the signal-to-background ratio, some cuts of kinematic distributions for the final states are required. Since the Z boson in the signal originates from top partner decay, whereas other Z bosons in the backgrounds originate from direct production during the processes, this will provide the main difference between the signal and the backgrounds. Therefore we will focus on this feature when selecting the cuts. Although the b-jets exhibit high tagging efficiency, we find that there is no good distinction between the b-jet distributions of signals and backgrounds. In addition, we find the kinematic distributions of the signals and backgrounds for the center-of-mass energy $\sqrt{s}=2$ TeV are similar to those for $\sqrt{s}=3$ TeV. In figure 3, we show the related normalized distributions of ${{sp}}_{T}({j}_{1},{j}_{2})$, ${{sp}}_{T}({l}_{1},{l}_{2})$, ${\rm{\Delta }}R({j}_{1},{j}_{2})$, and ${\rm{\Delta }}R({l}_{1},{l}_{2})$ in the polarized signals and backgrounds for the four signal benchmark points at $\sqrt{s}$ = 2 TeV, where ${{sp}}_{T}=| {p}_{T}^{1}| +| {p}_{T}^{2}| $ is the sum of the transverse momentum of the related particles, ${\rm{\Delta }}R(x,y)=\sqrt{{\left({\rm{\Delta }}\phi \right)}^{2}+{\left({\rm{\Delta }}\eta \right)}^{2}}$ with ${\rm{\Delta }}\phi $ is the difference of azimuthal angle between object x and y, and ${\rm{\Delta }}\eta $ gives the difference of pseudo-rapidity between them, $x,y=l,j$. We note that the final state jets and leptons in the signal events demonstrate greater transverse momentum and closer distance than in the backgrounds, due to the large mass of the top partner. Based on the behavioral characteristics of these distributions, we impose the following cuts, in order to enhance the signal significance:
$ \begin{eqnarray*}\begin{array}{l}\mathrm{Trigger}:\ N(j)\geqslant 2,N(l)\geqslant 2;\\ \mathrm{Cut}-1:\ {{sp}}_{T}({j}_{1},{j}_{2})\gt 300\,\mathrm{GeV};\\ \mathrm{Cut}-2:\ {{sp}}_{T}({l}_{1},{l}_{2})\gt 300\,\mathrm{GeV};\\ \mathrm{Cut}-3:\ {\rm{\Delta }}R({j}_{1},{j}_{2})\lt 1.0;\\ \mathrm{Cut}-4:\ {\rm{\Delta }}R({l}_{1},{l}_{2})\lt 0.6.\end{array}\end{eqnarray*}$
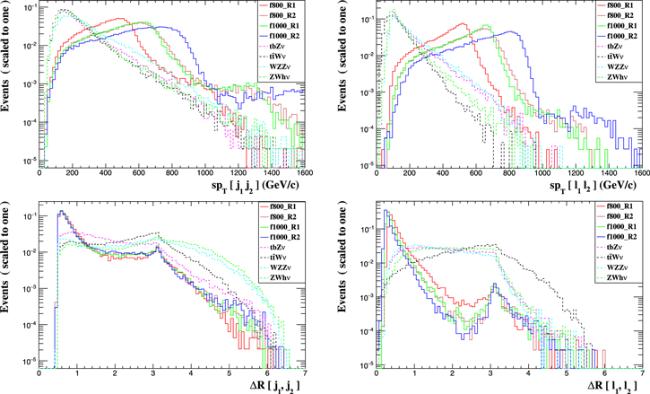
Figure 3. Normalized distributions of ${{sp}}_{T}({j}_{1},{j}_{2})$, ${{sp}}_{T}({l}_{1},{l}_{2})$, ${\rm{\Delta }}R({j}_{1},{j}_{2})$, ${\rm{\Delta }}R({l}_{1},{l}_{2})$ in the polarized signals and backgrounds for the four signal benchmark points at $\sqrt{s}$ = 2 TeV in mode A. |
For clarity, we summarize the cut flows of the signals and backgrounds for the four signal benchmark points in table 2. We note that the dominant background is process WZZν, which is followed by process $t\bar{t}W\nu $. These cuts suppress the backgrounds and isolate the signal effectively. For the four benchmarks, the total cut efficiencies of the signals achieve 33% (32%), 34% (31%), 34% (32%), and 31% (27%) for the $\sqrt{s}=2$ TeV ($\sqrt{s}=3$ TeV), respectively. Conservatively, we take the same cuts for all the signal parameter points at $\sqrt{s}=2,3$ TeV in the following calculations.
Table 2. Cut flows of the signals and backgrounds at $\sqrt{s}=2$ TeV and $\sqrt{s}=3$ TeV (in parentheses) with polarized beam for the four signal benchmark points in mode A. |
| Signals ($\times {10}^{-3}$fb) | Backgrounds ($\times {10}^{-3}$fb) | |||||||
|---|---|---|---|---|---|---|---|---|
| Benchmarks | f800_R1 | f800_R2 | f1000_R1 | f1000_R2 | ${tbZ}\nu $ | $t\bar{t}W\nu $ | ${WZZ}\nu $ | ${ZWh}\nu $ |
| | ||||||||
| Original | 21(35) | 24(71) | 7.9(20) | 3.3(32) | 192(302) | 439(806) | 559(1099) | 232(464) |
| Trigger | 14(24) | 15(44) | 5.1(13) | 1.9(18) | 109(161) | 204(293) | 329(604) | 130(235) |
| cut1 | 11(19) | 13(39) | 4.4(11) | 1.7(16) | 24(51) | 35(68) | 106(254) | 28(69) |
| cut2 | 11(18) | 13(38) | 4.3(11) | 1.7(16) | 7.7(19) | 2.8(8.2) | 26(80) | 5.6(17) |
| cut3 | 7.9(12) | 8.7(23) | 2.9(6.9) | 1.1(9.1) | 4.1(8.9) | 0.8(2.4) | 4.9(12) | 1.8(4.7) |
| cut4 | 7.0(11) | 8.2(22) | 2.7(6.5) | 1.0(8.7) | 2.5(5.6) | 0.009(0.06) | 2.9(8.2) | 0.9(2.8) |
| Total Eff. | 33% (32%) | 34% (31%) | 34% (32%) | 31% (27%) | 1.3% (1.9%) | 0.002% (0.008%) | 0.5% (0.75%) | 0.4% (0.6%) |
Initial state radiation (ISR) significantly affects cross sections [24], particularly in the case of lepton colliders. We calculate these effects with a plugin for adding ISR in MadGraph [25], and find that the cross sections are reduced by approximately 10%. For the sake of convenience, we use a uniform reduced ratio of 10% to estimate these effects when calculating signal significance.
We evaluate statistical significance (SS) using the Poisson formula [26] as follows:
$ \begin{eqnarray}{SS}=\sqrt{2L[({\sigma }_{S}+{\sigma }_{B})\mathrm{ln}(1+\displaystyle \frac{{\sigma }_{S}}{{\sigma }_{B}})-{\sigma }_{S}]},\end{eqnarray}$
where L is the integrated luminosity of the collider, and ${\sigma }_{S},{\sigma }_{B}$ are the signal and background cross sections after our cuts, respectively.The 2σ exclusion limit in $R-{m}_{{T}_{+}}$ plane at $\sqrt{s}$ = 2, 3 TeV is shown in figure 4, where we also display the limit from the direct search at LHC-13 TeV [27], and the indirect limit based on a global fit of electroweak precision observables (EWPO) and Higgs data. A global fit of the EWPO and the latest Higgs data was conducted in our previous paper [28]; here, we consider the limit for case A, which is the default case in the literature. We note that the limit on the top partner mass (${m}_{{T}_{+}}\gt 1300$ GeV) from the current direct search is consistent with indirect measurements, i.e., the global fit of the EWPO and the Higgs data. For $\sqrt{s}$ = 2 TeV, we note that the excluding ability of $e\gamma $ collision is comparable to the LHC-13 TeV limit, if an integrated luminosity of 2000 fb−1 is achieved. For $\sqrt{s}$ = 3 TeV, we note that the excluding ability of eγ collision is noticeably enhanced, as compared with the case at $\sqrt{s}$ = 2 TeV. The excluding ability of eγ collision at $\sqrt{s}$ = 3 TeV, with an integrated luminosity of 1000 fb−1, is comparable to the LHC-13 TeV limit. If an integrated luminosity of 3000 fb−1 can be achieved, then top partner mass ${m}_{{T}_{+}}$ can be excluded up to 1350 GeV. If we consider ISR effects, the limits on the top partner mass are reduced by approximately 10 GeV. In addition, we note that the excluding ability for the LHT parameter space at eγ collision, and the current experimental limits, complement each other.
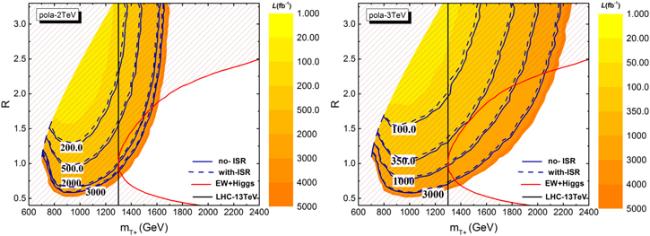
Figure 4. 2σ exclusion limit in $R-{m}_{{T}_{+}}$ plane at $\sqrt{s}$ = 2 TeV (left) and $\sqrt{s}$ = 3 TeV (right). Contour plot of excluding capability at different integrated luminosities, where ISR effects are indicated by dashed blue lines, and solid blue lines indicate where ISR effects are not included. The black numbers in white box denote different integrated luminosities. The red solid line denotes the 2σ limit from the global fit of EWPO and Higgs data, and the black solid lines denote the limit based on the LHC-13 TeV. |
3.2. Mode B, ${W}^{-} \rightarrow {l}^{-}\bar{{\nu }_{l}}$ and $Z \rightarrow {jj}$
In this section, we will study the excluding ability of eγ collision on top partner mass in mode B. As with mode A, the main difference between the signal and the backgrounds originates from the Z boson and its decay products. In addition, we find that there is no good distinction between the b-jet and lepton distributions of signals and backgrounds. We therefore select light jet cuts in order to improve the signal-to-background ratio. In regard to $\sqrt{s}=2$ TeV, and $\sqrt{s}=3$ TeV, these also exhibit similar kinematic distributions, and we therefore use the same cuts for them. In figure 5, we show the related normalized distributions of ${p}_{T}({j}_{1})$, ${\rm{\Delta }}R({j}_{1},{j}_{2})$, $\eta ({j}_{1})$, and $\eta ({j}_{2})$ as the polarized signals and backgrounds for the four signal benchmark points at $\sqrt{s}$ = 2 TeV. We note that the leading order jet in signal events exhibits greater transverse momentum than in the backgrounds, due to the large mass of the top partner. The peak of ${\rm{\Delta }}R({j}_{1},{j}_{2})$ is at $\sim 3.14$, which indicates that the two jets incline to fly back-to-back. Following analysis, we impose the following cuts to enhance signal significance:
$ \begin{eqnarray*}\begin{array}{c}\mathrm{Trigger}:N(j)\geqslant 2;\\ \mathrm{Cut}-1:{p}_{T}({j}_{1})\gt 300\,\mathrm{GeV};\\ \mathrm{Cut}-2:{\rm{\Delta }}R({j}_{1},{j}_{2})\gt 2.8;\\ \mathrm{Cut}-3:-1.0\lt \eta ({j}_{1})\lt 1.0;\\ \mathrm{Cut}-4:-1.4\lt \eta ({j}_{2})\lt 0.2.\end{array}\end{eqnarray*}$
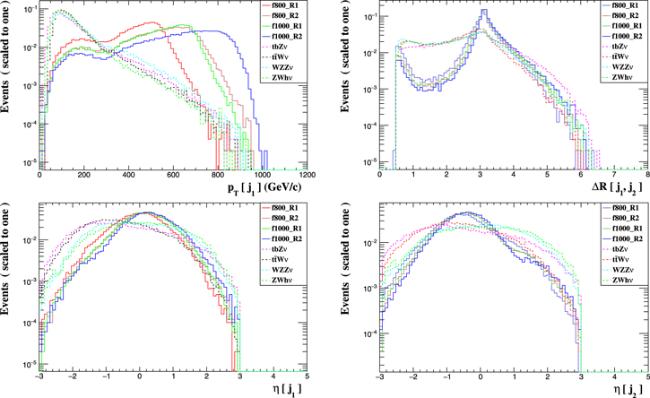
Figure 5. Normalized distributions of ${p}_{T}({j}_{1})$, ${\rm{\Delta }}R({j}_{1},{j}_{2})$, $\eta ({j}_{1})$, $\eta ({j}_{2})$ in the polarized signals and backgrounds for the four signal benchmark points at $\sqrt{s}$ = 2 TeV in mode B. |
For clarity, we summarize the cut flows of the signals and backgrounds for the four signal benchmark points in table 3. After these cuts, we note that the backgrounds are suppressed, and the signals are effectively retained. For the four benchmarks, the cut efficiencies of the signal achieve 46%(34%), 55%(50%), 56%(47%), and 56%(57.8%) for $\sqrt{s}=2$ TeV, and ($\sqrt{s}=3$ TeV), respectively. In the following calculations, we use the same cuts for all signal parameter points at $\sqrt{s}=2,3$ TeV. Similarly to mode A, we apply a uniform reduced ratio of 10% in order to estimate ISR effects on calculations for signal significance.
Table 3. Cut flows of signal and backgrounds at $\sqrt{s}=2.0$ TeV and $\sqrt{s}=3.0$ TeV (in parentheses), with polarized beam, for the four signal benchmark points. |
| Signals ($\times {10}^{-3}$fb) | Backgrounds ($\times {10}^{-3}$fb) | |||||||
|---|---|---|---|---|---|---|---|---|
| Benchmarks | f800_R1 | f800_R2 | f1000_R1 | f1000_R2 | ${tbZ}\nu $ | $t\bar{t}W\nu $ | ${WZZ}\nu $ | ${ZWh}\nu $ |
| | ||||||||
| Original | 55(93) | 63(185) | 20(52) | 8.6(85) | 501(787) | 1315(2413) | 1459(2873) | 606(1213) |
| Trigger | 54(91) | 62(182) | 20(51) | 8.5(84) | 487(757) | 1314(2411) | 1448(2844) | 603(1204) |
| cut1 | 40(69) | 52(157) | 17(43) | 7.5(76) | 53(141) | 119(343) | 207(632) | 43(141) |
| cut2 | 33(55) | 47(138) | 15(38) | 7.0(70) | 28(80) | 63(183) | 100(333) | 23(84) |
| cut3 | 31(45) | 43(120) | 14(33) | 6.1(61) | 22(50) | 48(106) | 75(195) | 19(56) |
| cut4 | 25(32) | 35(93) | 12(25) | 4.9(49) | 14(24) | 33(51) | 38(79) | 11(23) |
| Total Eff. | 46% (34%) | 55% (50%) | 56% (47%) | 56% (57.8%) | 2.7% (3%) | 2.5% (2.1%) | 2.6% (1.9%) | 1.8% (1.9%) |
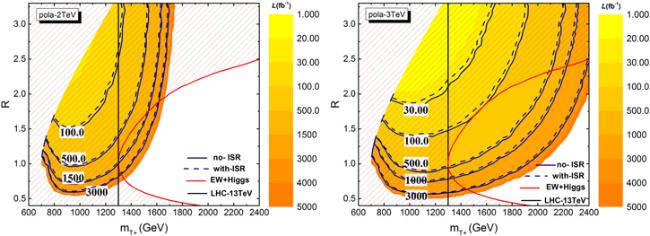
The 2σ exclusion limit in $R-{m}_{{T}_{+}}$ plane at $\sqrt{s}$ = 2, 3 TeV is shown in figure 6, where the limit from the direct search at LHC-13 TeV and the indirect limit from the global fit of EWPO and Higgs data are also displayed. We note that the excluding ability of eγ collision in mode B is stronger than that in mode A. For $\sqrt{s}$ = 2 TeV, the excluding ability of eγ collision with an integrated luminosity of 1500 fb−1 is comparable to the LHC-13 TeV limit. For $\sqrt{s}$ = 3 TeV, the excluding ability of eγ collision with an integrated luminosity of 500 fb−1 is comparable to the LHC-13 TeV limit. If an integrated luminosity of 3000 fb−1 is achieved, the top partner mass ${m}_{{T}_{+}}$ can be excluded up to 1440 GeV. Similarly, ISR effects will reduce the limits on the top partner mass by approximately 10 GeV. In addition, the signals in mode B have bigger cross sections, meaning that they can be detected more easily than those in mode A.
Figure 6. Data displayed as in figure 4, in relation to mode B. |
4. Conclusions
Based on the LHT model, we investigated the single production of the T-even top partner at the eγ collider through channels ${e}^{-}\gamma \to {\bar{T}}_{+}b{\nu }_{e}\to (\bar{t}Z)b{\nu }_{e}$ $\to ({W}^{-}\bar{b}{l}^{+}{l}^{-})b{\nu }_{e}$ $\to ({jj}\bar{b}{l}^{+}{l}^{-})b{\nu }_{e}$ (mode A) and ${e}^{-}\gamma \to {\bar{T}}_{+}b{\nu }_{e}$ $\to (\bar{t}Z)b{\nu }_{e}$ $\to ({W}^{-}\bar{b}{jj})b{\nu }_{e}$ $\to ({l}^{-}\bar{{\nu }_{l}}\bar{b}{jj})b{\nu }_{e}$ (mode B). We selected polarization degrees ${P}_{{e}^{-}}=-0.8$, and ${P}_{\gamma }=+1$, and center-mass energy values $\sqrt{s}=2$ TeV, and $\sqrt{s}=3$ TeV. We performed a fast detector simulation and selected kinematic cuts in order to improve statistical significance. For $\sqrt{s}=2$ TeV, the excluding ability of the two modes do not exhibit great improvement compared with the current experimental limits. For $\sqrt{s}=3$ TeV, however, the excluding ability of the two modes improved significantly. This is comparable to the current LHC-13 TeV limit with an integrated luminosity L = 1000 (500) fb−1 for mode A (B). If the integrated luminosity achieves 3000 fb−1, then top partner mass ${m}_{{T}_{+}}\leqslant $ 1350 (1440) GeV can be excluded at 2σ level for mode A (B). For both modes, we also considered ISR effects, and found that the excluding ability of eγ collision on the the top partner mass would be reduced by approximately 10 GeV. Moreover, the excluding ability for the LHT parameter space at eγ collision complements the current experimental limits.