


1. Introduction
2. Methodology
2.1. Magnitude statistics
2.2. Flux statistics
2.3. Improved flux statistics
2.4. Other observational data
3. Cosmology fit results
3.1. Searching the best FA recipe for IFS
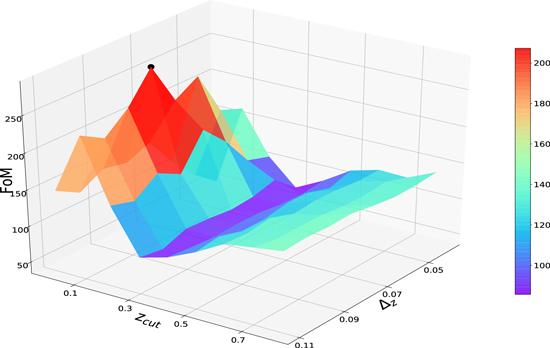
Figure 1. 3D graph of the values of FoM, which are given by different sets of (zcut, Δz), for the wCDM model. The black dot represents the best FA recipe (zcut, Δz) = (0.1, 0.08) for IFS, which gives the FoM = 278.34. |
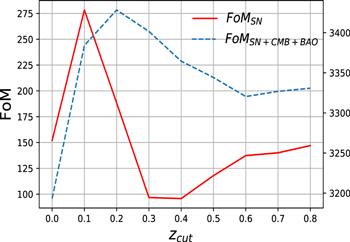
Figure 2. FoM values given by different zcut, for wCDM. The solid red line represents the results constrained only by SN samples. The blue dashed line represents results constrained by the combined SN+BAO+CMB data. |
3.2. The differences between the cosmological consequences of Pantheon and JLA
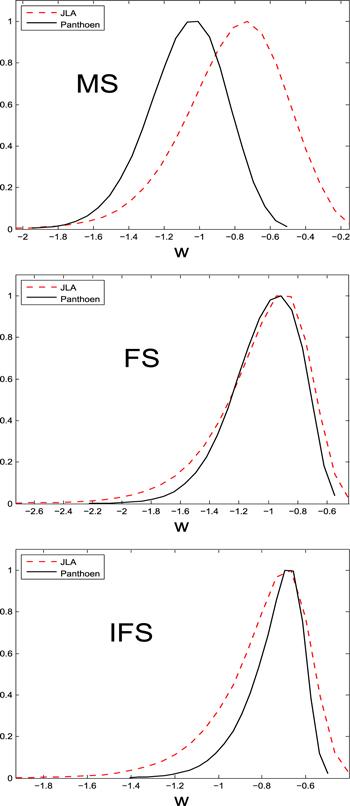
Figure 3. 1D marginalized probability distributions of w for three SN Ia statistics techniques. The solid black lines denote the result from Pantheon and the dashed red lines represent the result from JLA. For all the statistics techniques, the new dataset, Pantheon, gives tighter constraint on w than that constrained by the JLA dataset. |
Table 1. The FoM and CL of w for the JLA and Pantheon datasets. |
| Parameters | MS | FS | IFS |
|---|---|---|---|
| 1σ CL of wJLA | (−1.485, −0.311) | (−1.965, −0.513) | (−1.426, −0.457) |
| 1σ CL of wPantheon | (−1.407, −0.761) | (−1.460, −0.634) | (−0.965, −0.547) |
| Decrease of the 1σ error bar | 45% | 43% | 56% |
| | |||
| 2σ CL of wJLA | (−1.903, −0.218) | (−2.667, −0.459) | (−1.878, −0.426) |
| 2σ CL of wPantheon | (−1.666, −0.615) | (−1.769, −0.604) | (−1.206, −0.520) |
| Decrease of 2σ error bar | 38% | 47% | 53% |
| | |||
| FoM of JLA | 34.2 | 61.2 | 109.8 |
| FoM of Pantheon | 161.8 | 139.2 | 278.3 |
| Increase of FoM | 373% | 127% | 153% |
3.3. The differences between the cosmological consequences of MS, FS and IFS
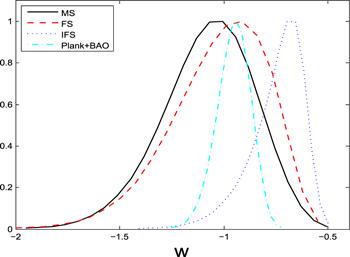
Figure 4. 1D marginalized probability distributions of w produced by the Pantheon dataset. The solid black, dashed red and dotted blue lines denote the results given by MS, FS and IFS, respectively. As a comparison, we also constrain the wCDM model by adopting the combined CMB+BAO data, which is represented by the dash-dotted cyan line. |
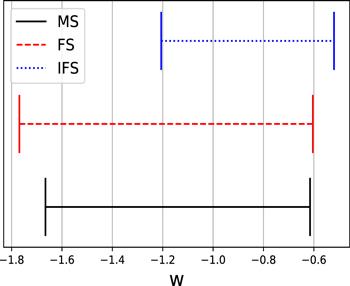
Figure 5. 2σ error bars of EoS w given by three SN Ia statistics techniques. The solid black, dashed red and dotted blue lines denote the results given by MS, FS and IFS, respectively. It’s clear that the IFS yields the tightest constraint on w. |
4. Conclusions and discussions
| • | For IFS, we find the best FA recipe (zcut, Δz) = 0.1, 0.08), which can give the largest FoM = 278.34 (see figure 1). Comparing to the case of adopting the combined SN+CMB+BAO dataset, using SN data alone will yield a smaller value of zcut (see figure 2). |
| • | Comparing to the JLA dataset, the Pantheon dataset can give tighter DE constraints (see figure 3). Specifically, the Pantheon data can decrease the 2σ error bars of w by 38% 47% and 53%, for MS, FS and IFS, respectively. In addition, using Pantheon data can also increase the values of FoM by 373%, 127% and 153%, for MS, FS and IFS, respectively (see table 1). |
| • | FS gives closer results to other observations, such as BAO and CMB (see figure 4). In addition, among the three SN Ia statistics techniques, IFS yields the tightest constraint on w (see figure 5). |