


1. Introduction
Over the past few years, the discovery of graphene has paved the way for a considerable advancement in the field of materials and condensed matter physics. Based on the studies on graphene, a large number of novel properties of two-dimensional (2D) materials have been predicted and demonstrated, such as massless Dirac fermions, energy valley polarized electrons, and quantum spin Hall states [1–5]. Although graphene has a series of excellent physical properties, the two chiral pairs of Dirac cones open the energy gap at the K and K′ points to a very small value and exhibit the characteristics of semimetal, which restricts the application of graphene in devices to a certain extent [6–9]. To this end, studies on new two-dimensional (2D) materials and the determination of their properties have attracted considerable interest. 2D materials composed of group-IV elements with a graphene-like structure and same group as carbon, such as silylene, germanene, and stanene, have attracted considerable attention owing to their new features, such as the high strength of the lattice and high electronic mobility [10–14]. Among them, the 2D network stanene, composed of tin atoms, is promising because of its excellent properties. Due to its stronger spin–orbit coupling, stanene has been predicted by many theoretical physicists to have exotic physical properties that are not available in 2D materials such as graphene, silylene, and germanene, including a 2D quantum spin Hall state with a large energy gap, low-loss conductance at room temperature, topological superconductivity, quantum spin Hall state, and quantum anomalous Hall state [15–23]. One of its unique features is its high carrier mobility, which allows electrons to move freely. Stanene can possess a larger band gap obtained by regulation of the external field and chemistry [24–26]. The excellent properties of stanene make it a promising 2D material.
The relevant properties of stanene have been investigated in detail by theoretical calculations and experiments. By epitaxially straining gray tin (a-Sn), Falson et al obtained superconductors with few layers of stanene, which exhibit a unique type of Ising pairing between carriers residing in bands with different orbital indices near the Γ-point. The in-plane upper critical magnetic field is strongly enhanced and exhibited an upward trend at ultralow temperatures [27]. Rachel et al exposed the 2D topological insulators silene, germanene, and stannane with helical edge states to charge density wave order, superconductor, out-of-plane antiferromagnetic, and in-plane antiferromagnetic fields to study the global and local manipulations at the edges to achieve the quantum spin Hall effect without edge states [28]. Liao et al achieved superconductivity in a few-layer stanene grown on PbTe, while bulk α-tin is not superconductive, according to an analysis of the layer degree of freedom. Based on substrate engineering, they reported that transition from a single band to a two-band superconductor can be realized by doubling the transition temperature [29]. Using low-temperature molecular beam epitaxy, Deng et al successfully grew high-quality olefins on Cu (111). An abnormal ultralight monoene is observed at the Γ point, with in-plane s–p band inversion and topological gap induced by spin–orbit coupling (∼0.3 eV), which represents the most important group-IV ultralight graphene-like topology material in the experiment [30]. Based on the Sn/PbI2 heterostructure, Zhang et al proposed a very stable basic device with a quantum anomalous Hall effect. The experimental results showed that the quantum anomalous Hall effect can be easily realized in the tin/lead iodide heterostructure [31]. Using the first-principle method based on density functional, Pamungkas et al thoroughly investigated the influences of hydrogenation and Al/P doping on the electronic structure and magnetic properties of stanene. The hydrogenation opened the band gap of stanene and converted it from nonmagnetic to ferromagnetic through the hybridization of H 1s and Sn 5p states [32]. Xiong et al studied the electronic structure and magnetic properties of stanene nanoribbons. They reported that all considered armchair-type stanene nanoribbons are nonmagnetic semiconductors and that the gap is a periodic oscillation function of the band width [33]. Based on Monte Carlo simulations, Fadil et al investigated the magnetic properties of a bilayer nanostanene structure with Ruderman–Kittel–Kasuya–Yoshida (RKKY) interactions. By studying the effect of RKKY interactions on the magnetic properties of the system, they discovered that, when the number of nonmagnetic layers is reduced, the blocking temperature increases under nonzero temperature conditions [34]. Using the multi-orbital tight coupling model, Hattori et al systematically studied the edge states of stanene nanoribbons in the presence of Coulomb interactions and vertical electric fields. Owing to the multi-orbital effect, the resulting edge states have nonlinear energy dispersion and the stanene nanoribbons exhibit induced magnetization at the edges [35]. Wu et al proposed a quantum anomalous Hall platform with a large energy gap of 0.34 eV and 0.06 eV on honeycomb lattices comprised of Sn and Ge by ab-initio band structure calculations, respectively. The results indicated that the ferromagnetic sequence is formed in a sublattice of the honeycomb structure by controlling surface functionalization instead of diluting magnetic doping [36]. In our previous studies, we successfully employed the EFT to assess the magnetic characteristics of nanomaterials [37–39].
The aim of this study is to investigate the magnetic and thermodynamic properties of the system. The model and theory of the nano-stanene-like bilayer with the RKKY interaction are introduced in section 2 . In section 3 , the magnetization, magnetic susceptibility, internal energy, and specific heat are discussed. The conclusions of this paper are presented in section 4 .
2. Calculation method
A schematic of the bilayer nano-stanene-like structure, separated by nonmagnetic layers, is shown in figure 1. The red and blue balls in layers A and B represent spin atoms, respectively. There is a ferrimagnetic exchange coupling (J) between them. The two types of magnetic atoms had spins of $\sigma ={\rm{7}}/{\rm{2}}$ and spin $S=-{\rm{3}}/{\rm{2}}.$ A mixed spin Ising model is developed to describe this bilayer nano-stanene-like structure. For simplicity, the exchange coupling RKKY JRKKY [40–42] between the spin atoms of layers A and B is assumed. The bilayer nano-stanene-like structure with the exchange coupling RKKY is investigated using the effective-field theory with correlations. The Hamiltonian for the bilayer nano-stanene-like structure is
$\begin{eqnarray}\begin{array}{l}H=-J\displaystyle \sum _{ij}{S}_{i}^{z}{\sigma }_{j}^{z}-{J}_{{\rm{RKKY}}}\displaystyle \sum _{im}{S}_{i}^{z}{S}_{m}^{z}-{J}_{{\rm{RKKY}}}\displaystyle \sum _{jn}{\sigma }_{j}^{z}{\sigma }_{n}^{z}\\ \,\,\,\,\,-{D}_{{\rm{1}}}\displaystyle \sum _{i}{\left({S}_{i}^{z}\right)}^{2}-{D}_{{\rm{2}}}\displaystyle \sum _{j}{\left({\sigma }_{j}^{z}\right)}^{2}-h\left(\displaystyle \sum _{i}{S}_{i}^{z}+\displaystyle \sum _{j}{\sigma }_{j}^{z}\right),\end{array}\end{eqnarray}$
where ${S}_{i}^{z}$ and ${\sigma }_{j}^{z}$ are the spin operators with possible values of $\pm 7/2,\,\pm 5/2,\,\pm 3/2,\,\pm 1/2$ and $\pm 3/2,\,\pm 1/2,$ respectively, J (<0) is the ferrimagnetic exchange coupling, JRKKY is the RKKY exchange coupling system, D1 (D2) is the anisotropy of the red (blue) spin atoms, and h is the longitudinal magnetic field.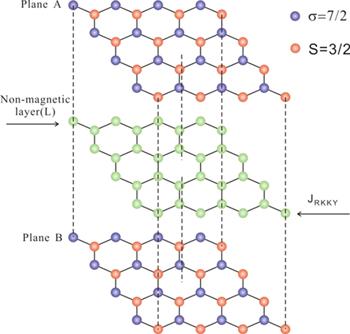
Figure 1. A sketch of bilayer nano-stanene-like with RKKY coupling. |
The JRKKY coupling between the magnetic bilayers is defined by [34]
$\begin{eqnarray}{J}_{{\rm{RKKY}}}=\displaystyle \frac{{a}^{2}{J}_{0}}{{L}^{2}}\,\cos ({K}_{f}L).\end{eqnarray}$
Within the framework of the effective-field theory with correlations, two types of sublattice magnetization (M1 and M2) can be calculated [45–47]:
$\begin{eqnarray}\begin{array}{l}{M}_{{\rm{1}}}={\left[\cosh \left({a}_{2}\right)+\displaystyle \frac{{M}_{2}}{{\eta }_{2}}\,\sinh \left({a}_{2}\right)\right]}^{3}\\ \,\,\,\,\times \left[\cosh \left({b}_{1}\right)+\displaystyle \frac{{M}_{1}}{{\eta }_{1}}\,\sinh \left({b}_{1}\right)\right]{\left.{F}_{{a}}\left(x\right)\right|}_{x=0},\end{array}\end{eqnarray}$
$\begin{eqnarray}\begin{array}{l}{M}_{{\rm{2}}}={\left[\cosh \left({a}_{{\rm{1}}}\right)+\displaystyle \frac{{M}_{{\rm{1}}}}{{\eta }_{{\rm{1}}}}\,\sinh \left({a}_{{\rm{1}}}\right)\right]}^{3}\\ \,\,\,\,\,\times \left[\cosh \left({b}_{{\rm{2}}}\right)+\displaystyle \frac{{M}_{{\rm{2}}}}{{\eta }_{{\rm{2}}}}\,\sinh \left({b}_{{\rm{2}}}\right)\right]{\left.{F}_{{b}}\left(x\right)\right|}_{x=0},\end{array}\end{eqnarray}$
where ${a}_{1}=J{\eta }_{1}{\rm{\nabla }},$ ${a}_{{\rm{2}}}=J{\eta }_{{\rm{2}}}{\rm{\nabla }},$ ${b}_{1}={J}_{{\rm{RKKY}}}{\eta }_{1}{\rm{\nabla }},$ ${b}_{{\rm{2}}}={J}_{{\rm{RKKY}}}{\eta }_{{\rm{2}}}{\rm{\nabla }}$ and ${\rm{\nabla }}=\partial /\partial x$ is the differential operator and $\begin{eqnarray}\begin{array}{l}{\eta }_{{\rm{1}}}^{{\rm{2}}}={\left[\cosh \left({a}_{{\rm{2}}}\right)+\displaystyle \frac{{M}_{{\rm{2}}}}{{\eta }_{{\rm{2}}}}\,\sinh \left({a}_{{\rm{2}}}\right)\right]}^{3}\\ \,\,\,\times \left[\cosh \left({b}_{{\rm{1}}}\right)+\displaystyle \frac{{M}_{{\rm{1}}}}{{\eta }_{{\rm{1}}}}\,\sinh \left({b}_{{\rm{1}}}\right)\right]{\left.{G}_{{a}}\left(x\right)\right|}_{x=0},\end{array}\end{eqnarray}$
$\begin{eqnarray}\begin{array}{l}{\eta }_{{\rm{2}}}^{{\rm{2}}}={\left[\cosh \left({a}_{{\rm{1}}}\right)+\displaystyle \frac{{M}_{{\rm{1}}}}{{\eta }_{{\rm{1}}}}\,\sinh \left({a}_{{\rm{1}}}\right)\right]}^{3}\\ \,\,\,\,\times \left[\cosh \left({b}_{{\rm{2}}}\right)+\displaystyle \frac{{M}_{{\rm{2}}}}{{\eta }_{{\rm{2}}}}\,\sinh \left({b}_{{\rm{2}}}\right)\right]{\left.{G}_{{b}}\left(x\right)\right|}_{x=0}.\end{array}\end{eqnarray}$
The total average magnetization M per magnetic atom is calculated by
$\begin{eqnarray}M=\left({M}_{{\rm{1}}}+{M}_{{\rm{2}}}\right)/2.\end{eqnarray}$
The functions ${F}_{{a}}\left(x\right),$ ${F}_{{b}}\left(x\right)$ and ${G}_{{a}}\left(x\right),$ ${G}_{{b}}\left(x\right)$ can be expressed as
$\begin{eqnarray}{F}_{{a}}\left(x\right)=\displaystyle \frac{1}{\displaystyle {\sum }_{i}^{8}\exp \left(\beta {\lambda }_{i}\right)}\left\{\displaystyle \sum _{i=1}^{8}\left\langle {\varphi }_{i}\left|{S}_{i}^{z}\right|{\varphi }_{i}\right\rangle \exp \left(\beta {\lambda }_{i}\right)\right\},\end{eqnarray}$
$\begin{eqnarray}{G}_{{a}}\left(x\right)=\displaystyle \frac{1}{\displaystyle {\sum }_{i}^{8}\exp \left(\beta {\lambda }_{i}\right)}\left\{\displaystyle \sum _{i=1}^{8}\left\langle {\varphi }_{i}\left|{\left({S}_{i}^{z}\right)}^{2}\right|{\varphi }_{i}\right\rangle \exp \left(\beta {\lambda }_{i}\right)\right\},\end{eqnarray}$
$\begin{eqnarray}{F}_{{b}}\left(x\right)=\displaystyle \frac{1}{\displaystyle {\sum }_{j}^{{\rm{4}}}\exp \left(\beta {\lambda }_{j}\right)}\left\{\displaystyle \sum _{j=1}^{{\rm{4}}}\left\langle {\varphi }_{j}\left|{\sigma }_{j}^{z}\right|{\varphi }_{j}\right\rangle \exp \left(\beta {\lambda }_{j}\right)\right\},\end{eqnarray}$
$\begin{eqnarray}{G}_{{b}}\left(x\right)=\displaystyle \frac{1}{\displaystyle {\sum }_{j}^{{\rm{4}}}\exp \left(\beta {\lambda }_{j}\right)}\left\{\displaystyle \sum _{j=1}^{{\rm{4}}}\left\langle {\varphi }_{j}\left|{\left({\sigma }_{j}^{z}\right)}^{2}\right|{\varphi }_{j}\right\rangle \exp \left(\beta {\lambda }_{j}\right)\right\},\end{eqnarray}$
where $\lambda $ and $\varphi $ are the eigenvalues and eigenfunctions, respectively, which can be calculated using a computer program.The average magnetic susceptibility is
$\begin{eqnarray}\chi =\displaystyle \frac{\partial M}{\partial h}{| }_{h={h}_{0}}.\end{eqnarray}$
The specific heat of the bilayer nano-stanene-like structure is15 ) are complex, they are calculated using a computer program.
$\begin{eqnarray}{C}_{v}=\partial U/\partial T,\end{eqnarray}$
where U is the internal energy of the bilayer nano-stanene-like structure. It can be calculated by $\begin{eqnarray}\begin{array}{l}U=\left\langle H\right\rangle =-\displaystyle \frac{N}{2}\left(\left\langle {S}_{i}^{z}{E}_{i}\right\rangle +\left\langle {\sigma }_{j}^{z}{E}_{j}\right\rangle \right)-{D}_{{\rm{1}}}\left\langle {\left({S}_{i}^{z}\right)}^{2}\right\rangle \\ \,\,\,\,\,\,-\,{D}_{{\rm{2}}}\left\langle {\left({\sigma }_{j}^{z}\right)}^{2}\right\rangle \,-\,h\left(\left\langle {S}_{i}^{z}\right\rangle +\left\langle {\sigma }_{j}^{z}\right\rangle \right),\end{array}\end{eqnarray}$
where N is the number of sites. < > denotes expectation. Because the terms in equation (3. Numerical results and discussion
In this section, we discuss the magnetic and thermodynamic properties of bilayer nano-stanene-like structures. At zero temperature, we suppose that the two types of spins are arranged in opposite directions, where spin −7/2 is parallel to the longitudinal magnetic field (h), while spin −3/2 is antiparallel to the longitudinal magnetic field (h). Typical numerical results for the bilayer nano-stanene-like structure are presented in figures 2–6. The influences of the ferrimagnetic exchange coupling (J) and anisotropies (D1, D2) on the magnetic and thermodynamic properties are presented.
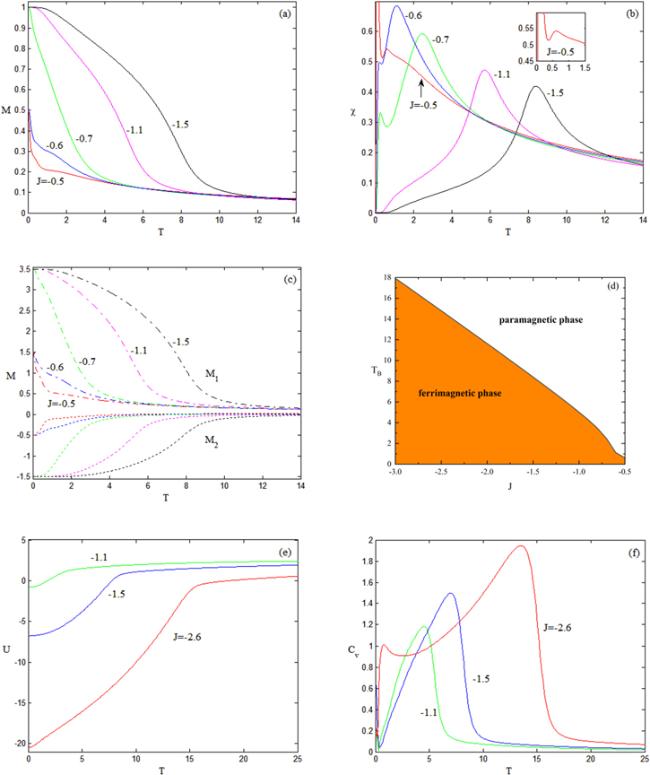
Figure 2. Thermal variations of the (a) magnetization, (b) sublattice magnetizations, (c) susceptibility, (d) internal energy, and (e) specific heat with D1 = −0.6, D2 = −2.0, h = 0.4, N = 2 and various J. |
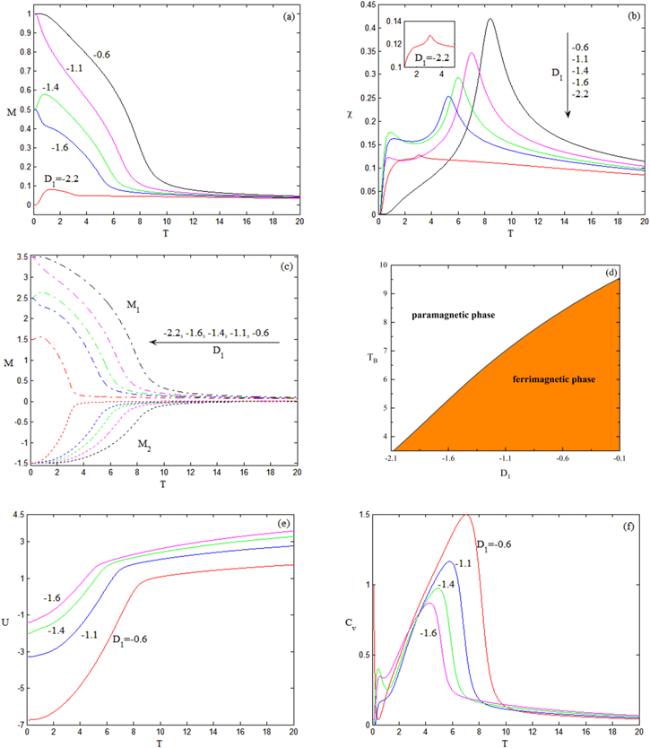
Figure 3. Thermal variations of the (a) magnetization, (b) sublattice magnetizations, (c) susceptibility, (d) internal energy, and (e) specific heat with J = −1.5, D2 = −2.0, h = 0.4, N = 2 and various D1. |
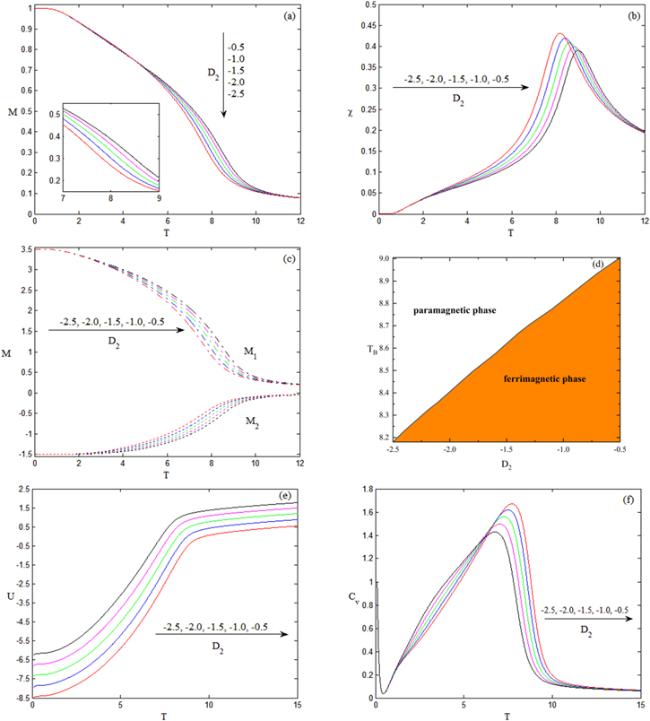
Figure 4. Thermal variations of the (a) magnetization, (b) sublattice magnetizations, (c) susceptibility, (d) internal energy, and (e) specific heat with J = −1.5, D1 = −0.6, h = 0.4, N = 2 and various D2. |
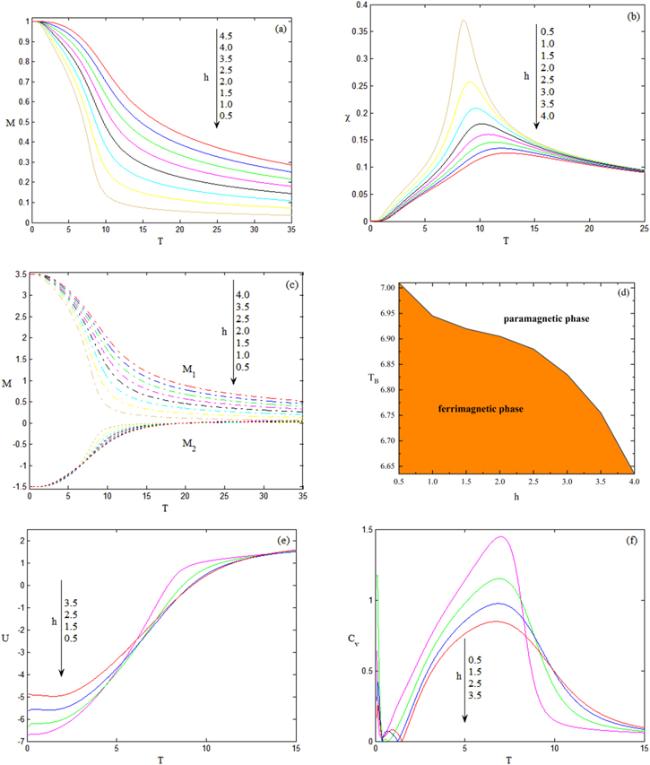
Figure 5. Thermal variations of the (a) magnetization, (b) sublattice magnetizations, (c) susceptibility, (d) internal energy, and (e) specific heat with J = −1.5, D1 = −0.6, D2 = −2.0, N = 2, and various h. |
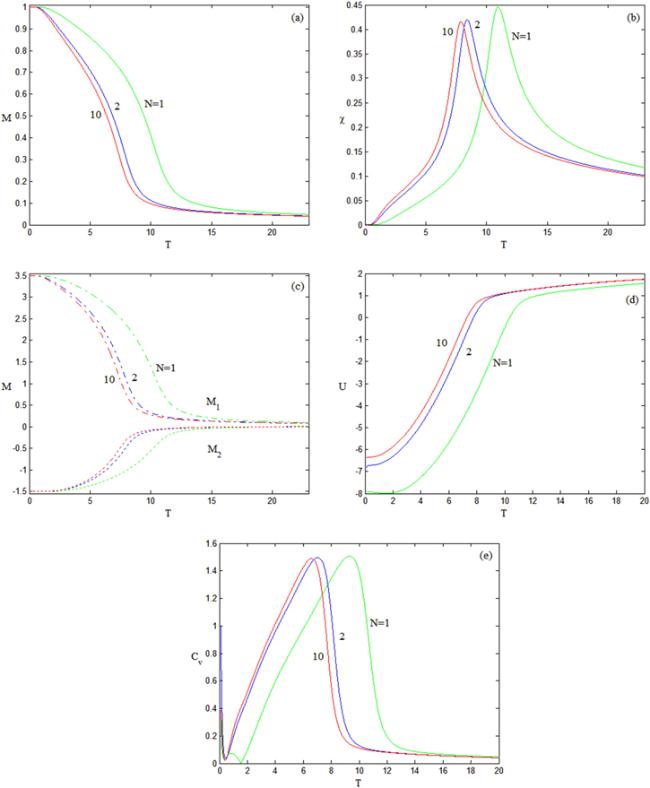
Figure 6. Thermal variations of the (a) magnetization, (b) sublattice magnetizations, (c) susceptibility, (d) internal energy, and (e) specific heat with J = −1.0, D1 = −1.4, D2 =−0.6, h = 0.4, and various N. |
The influences of the ferrimagnetic exchange coupling J on the magnetic and thermodynamic properties of the bilayer nano-stanene-like structure are shown in figures 2(a)–(f). The parameters are set to D1 = −0.6, D2 = −2.0, h = 0.4, and N = 2. The temperature dependence of the total magnetization of the system is shown in figure 2(a), which shows two different saturation magnetizations (Ms). For example, Ms = 0.5 and 1.0 for J = −0.5 (−0.6) and −0.7 (−1.1, −1.5), respectively. To evaluate the variation rule of the total system average magnetization M, we study the variations of the magnetizations M1 and M2 of the sublattices of layers A and B of the system with the ferrimagnetic exchange coupling J, as shown in figure 2(c). With the change in the ferrimagnetic exchange coupling J, the magnetization of the sublattice also changes. The total magnetization and sublattice magnetization satisfy equation (8 ). For example, for J = 1.1, M = (M1 + M2)/2 = (3.5 − 1.5)/2 = 1. The ferrimagnetic exchange coupling J mainly controls the change in the total magnetization by affecting the sublattice magnetization. According to equation (13 ), the susceptibility is the first derivative of the magnetization with respect to the longitudinal magnetic field. The temperature corresponding to its highest point is referred to as blocking temperature (TB). Figure 2(b) shows the curve of the system as a function of the temperature. With the increase in the ferrimagnetic exchange coupling ∣J∣, the highest point of the susceptibility curve shifts to the high-temperature region, that is, the blocking temperature TB increases with the ferrimagnetic exchange coupling ∣J∣. When ∣J∣ = 0.5, 0.6, 0.7, 1.1, and 1.5, the corresponding blocking temperatures of the system are TB = 0.615, 1.115, 2.47, 5.73, and 8.405, respectively. We studied the change in the system blocking temperature, as shown in figure 2(d). The blocking temperature divides the system into ferrimagnetic and paramagnetic phases. When the temperature is higher than the blocking temperature, the system is in the paramagnetic phase (white region); otherwise, it is in the ferrimagnetic phase (yellow region). The physical origin is the competition between ordered energy and disordered energy. At lower temperature, ordered energy dominates and the system is in a ferromagnetic phase. At higher temperature, the disordered energy dominates and the system transforms into a paramagnetic phase. The system blocking temperature increases linearly with the ferrimagnetic exchange coupling ∣J∣, which is consistent with the change in figure 2(b). The temperature dependence of the internal energy (U) for the bilayer nano-stanene-like structure is shown in figure 2(e). The increase of ∣J∣ can reduce the internal energy. With the increase in temperature, the ground state will increase. After reaching a certain temperature, the system can hardly change, mainly as, at low temperatures, each sublattice is less affected by the thermal disturbance and the influence of the exchange effect J is dominant. However, with the increase in temperature, the thermal disturbance energy is dominant. The temperature corresponding to the inflection point of the internal energy curve is the blocking temperature. With the increase in ferrimagnetic exchange coupling ∣J∣, the system blocking temperature increases, which has the same trend as in figure 2(b). The temperature dependence of the specific heat (Cv) for the bilayer nano-stanene-like structure is shown in figure 2(f). A singular phenomenon at the blocking temperature was observed in the specific heat curve. When ∣J∣ increased, the blocking temperature at the singular position shifted toward a high temperature. This agrees with the observations in figure 2(e).
The influences of the anisotropy D1 on the magnetic and thermodynamic properties of the bilayer nano-stanene-like structure are shown in figures 3(a)–(f). The typical parameters are J = −1.5, D2 = −2.0, h = 0.4, and N = 2. The temperature dependence of the total magnetization of the system is presented in figure 3(a), which shows two different behaviors. In the first type, the magnetization curve initially rises, drops, and finally becomes flat with the increase in temperature at D1 = −1.4 and −2.2. In the other type, the magnetization curve increases with the decrease in temperature, and then becomes flat at D1 = −0.6, −1.1, and −1.6. In the selected parameter range, the saturation magnetization (Ms) has three different values, Ms = 0, 0.5, and 1.0, when D1 = −2.2, −1.6 (−1.4), and −1.1 (−0.6), respectively. To better understand the variation rule of the total magnetization M of the system, figure 3(c) shows the variations of the magnetizations M1 and M2 of the sublattices of layers A and B of the system. With the change in D1, the magnetization of M1 changes significantly, M1 = 1.5, 2.5, and 3.5, for D1 = −2.2, −1.6 (−1.4), and −1.1 (−0.6), respectively. M2 is constant, −1.5. The anisotropy D1 mainly influences the magnetization of the A-layer sublattice. The temperature dependence of the susceptibility of the bilayer nano-stanene-like structure is shown in figure 3(b). A singular phenomenon at the blocking temperature is observed on the susceptibility curve. When ∣D1∣ increased, the blocking temperature at the singular position shifted toward a low temperature. TB = 8.450, 7.005, 6.015, 5.285, and 3.07 for ∣D1∣ = 2.2, 1.6, 1.4, 1.1, and 0.6, respectively. The anisotropy D1 dependence of the blocking temperature for the bilayer nano-stanene-like structure is shown in figure 3(d). The system blocking temperature decreases linearly with the increase in anisotropy ∣D1∣, which is consistent with the change in figure 3(b). When the temperature is higher than the blocking temperature, the system is in the paramagnetic phase (white region); otherwise, it is in the ferrimagnetic phase (yellow region). Similar results are also found in materials RKKY coupling [48]. The temperature dependence of the internal energy (U) for the bilayer nano-stanene-like structure is shown in figure 3(e). The system internal energy increases with the anisotropy ∣D1∣. However, the rate of increase gradually decreases. However, in the high-temperature region, the internal energy system almost directly increases with the increase in ∣D1∣, because, at low temperatures, the sublattices are slightly affected by the thermal disturbance energy and the influence of D1 is dominant. However, with the increase in temperature, the thermal disturbance energy is dominant. The temperature dependence of the specific heat (Cv) for the bilayer nano-stanene-like structure is shown in figure 3(f). The Cv curves have a sharp peak at the blocking temperature for different values of D1, which corresponds to the inflection point on the U curve. The blocking temperature increases with the decrease in the anisotropy ∣D1∣. In particular, the Cv curves showed distinct peaks at low temperatures, because the U curve showed an abnormal temperature dependence.
The influences of the anisotropy D2 on the magnetic and thermodynamic properties of the bilayer nano-stanene-like structure are shown in figures 4(a)–(f). The typical parameters are J = −1.5, D1 = −0.6, h = 0.4, and N = 2. The temperature dependence of the total average and sublattice magnetizations of the system are shown in figures 4(a) and (c). As shown in figure 4(a), the magnetization curves exhibited the same behavior types. The magnetization curve decreased with the increase in temperature T, and finally tended to a stable value of 0.078. In the selected parameter range, the saturation magnetization ∣Ms∣ is always 1. To explain the M curve, the sublattice M1 (dashed) and M2 (dotted) are shown in figure 4(c). With the increase in anisotropy D1, the magnetization of the system sublattice remained constant. At temperature T = 0, M1 = 3.5, M2 = −1.5. In figure 4(b), the susceptibility curve for the bilayer nano-stanene-like structure was obtained by changing D1. All curves drop rapidly at high temperatures, which indicates that the system is in the paramagnetic phase. The blocking temperature decreased when ∣D2∣ increased. This is in agreement with the M curves shown in figure 4(b). The thermal variations of the internal energy (U) of the bilayer nano-stanene-like structure are shown in figure 4(e). With the increase in D2, the internal energy of the system gradually increases. Unlike D1, the effect of D2 on the internal energy of the system is always proportional. The temperature dependence of the specific heat (Cv) for the bilayer nano-stanene-like structure is shown in figure 4(f). The Cv curves have a sharp peak at the blocking temperature for different D2 values, which corresponds to the inflection point on the U curve. The blocking temperature decreased with the increase in the anisotropy ∣D2∣. This is in agreement with figures 3(e)–(f). The maximum values corresponding to blocking temperature are found on the susceptibility curve and the specific heat curves in figures 4(b) and (f), which are in agreement with those obtained in figure 2 of [49].
The influences of the longitudinal magnetic field h on the magnetic and thermodynamic properties of the bilayer nano-stanene-like structure are shown in figures 5(a)–(f). The typical parameters are J = −1.5, D1 = −0.6, D2 = −2.0, N = 2. The temperature dependence of the total magnetization of the system is shown in figure 5(a). At T = 0, the saturation magnetization has only one value, Ms = 1. When T > 0, the magnetization increases with the longitudinal magnetic field h, mainly due to the competition between the thermal disturbance energy and longitudinal magnetic field energy. As the temperature T continues to increase, the magnetization curve tends to a stable value, which increases with the longitudinal magnetic field h. This shows that the magnetic properties of the system are mainly determined by the longitudinal magnetic field intensity when the temperature increases to a critical value. The magnetizations M1 and M2 of layer-A and layer-B sublattices are shown in figure 5(c). According to figure 5(c), the magnetization curve M2 almost does not change with the change in longitudinal magnetic field h and temperature T, while the change trend of the magnetization curve M1 is consistent with that of the total magnetization curve. The A-layer sublattice has a major effect on the magnetic properties of the system. In figure 5(b), the susceptibility curve for the bilayer nano-stanene-like structure was obtained by changing h. The temperature corresponding to the highest point is the blocking temperature. The blocking temperature decreases with the increase in external magnetic field h. For example, TB = 7.01, 6.945, 6.92, 6.905, 6.88, 6.83, 6.755, and 6.635 for h = 0.5, 1.0, 1.5, 2.0, 2.5, 3.0, 3.5, and 4.0, respectively. To study the influence of the blocking temperature on the system, the longitudinal magnetic field dependence of the blocking temperature is shown in figure 5(d). In contrast to the ferrimagnetic exchange coupling and anisotropy, there is no linear change between the blocking temperature and longitudinal magnetic field. The area of the ferrimagnetic phase (yellow area) is larger than that of the paramagnetic phase (white area), which indicates that the system is more likely to exhibit ferrimagnetism. The temperature dependence of the internal energy (U) for the bilayer nano-stanene-like structure is shown in figure 5(e). In the low-temperature region, the internal energy increases with h, while, in the high-temperature region, the internal energy does not change with the change in h, mainly because, in the intermediate temperature region, the internal energy is affected by the external field energy and thermal disturbance energy. At a smaller external field, the internal energy is more severely affected by the thermal disturbance energy and the internal energy increases faster. The temperature corresponding to the inflection point of the internal energy curve is the blocking temperature. With the increase in the longitudinal magnetic field h, the system blocking temperature decreases, which has the same trend as that in figure 5(b). The temperature dependence of the specific heat (Cv) for the bilayer nano-stanene-like structure is shown in figure 5(f). In the low-temperature region, the specific heat of the system is disturbed, which is mainly determined by the competition between the temperature and anisotropy.
The influence of the number of nonmagnetic layers N on the magnetic and thermodynamic properties of the bilayer nano-stanene-like structure was investigated, as shown in figures 6(a)–(e). The typical parameters are J = −1.5, D1 = −0.6, D2 = −2.0, h = 0.4. The temperature dependence of the total magnetization of the system is shown in figure 6(a). At T = 0, the saturation magnetization has only one value, Ms = 1. When the temperature is T > 0, the magnetization decreases with the increase in N. However, the difference between one and two layers is considerably larger than that between two and ten layers. This shows that, with the increase in the number of layers, the effect on the magnetic properties of the system decreases. The magnetizations M1 and M2 of layer-A and layer-B sublattices are shown in figure 6(c). According to figure 6(c), the magnetization curve M2 almost does not change with the change in N and temperature T, while the changing trend of the magnetization curve M1 is consistent with that of the total magnetization curve. The A-layer sublattice has a major effect on the magnetic properties of the system. In figure 5(b), the susceptibility curve for the bilayer nano-stanene-like structure was obtained by changing N. The temperature corresponding to the highest point is the blocking temperature, which decreases with the increase in N. For example, TB = 10.96, 8.45, and 7.9 for N = 1, 2, and 10, respectively. The temperature dependences of the internal energy (U) and specific heat (Cv) of the bilayer nano-stanene-like structure are shown in figures 6(d), (e). The internal energy of the system increases, while the specific heat decreases with the increase in the number of layers. The disturbance of the specific heat at low temperatures is mainly caused by the competition between the temperature and anisotropy. Moreover, with the increase in the number of layers, the effect on the magnetic and thermodynamic properties of the system decreases. It is worth noting that the results obtained may be useful in helping to understand the magnetic properties of other RKKY materials, such as Ce–Al metallic glasses [48], NdRhIn5 [49].
4. Conclusions
Based on the EFT, a bilayer nano-stanene-like structure described by mixed spin 7/2 and 3/2 Ising models was studied. The exchange coupling, anisotropy, external fields, and number of nonmagnetic layers regulated the magnetic and thermodynamic properties of the system. With the changes in exchange and anisotropy, the system could exhibit different magnetic configurations. The effect on the magnetic and thermodynamic properties of the system decreased with the increase in the number of non-magnetic layers.