


1. Introduction
Since the advent of laser, nonlinear optics, as a new subject, has been widely used in optoelectronics, biomedicine, quantum computing, quantum communication and other fields [1–3]. In particular, low-dimensional semiconductor microstructure materials, such as quantum wells [4], quantum dots [5, 6], quantum wires [7], quantum rings [8] and so on, have completely different optical properties from bulk materials. Nano semiconductor quantum dots, in which the electrons are limited by quantum localization in three directions, have more obvious nonlinear optical properties, and have very important application value in the design and manufacture of semiconductor quantum devices. Therefore, the research on the nonlinear optical properties of low-dimensional semiconductor quantum dot materials is a hot topic in the field of scientific research [9–12].
The research on the structure of the quantum dot system is of great interest to many researchers. Such as, T Ochiai [13] discussed electrostatics of optical rectification in metallic particles. M Choubani et al [14] studied linear, third-order nonlinear and total absorption coefficients of coupled InAs/GaAs lens-shaped core/shell quantum dots in the terahertz region. M Sayrac [15] considered the influence of applied external fields on the nonlinear optical rectification, second, and third-harmonic generation in an asymmetrical semi-exponential quantum well. P Hashemi et al [16] investigated the effect of polaron on the second and third-harmonic generation of tuned quantum dot/ring systems. However, the above work is studied in the case of a single limiting potential, but there is little research on the superposition of two limiting potentials. We think this is a very interesting topic. At the same time, the study of nonlinear optical properties can promote the development of optical quantum devices and semiconductor materials. Therefore, it is necessary to study this field. The structure of the paper is as follows: the second part is the interpretation of the theoretical model and optical rectification coefficient. In the third part, we discuss and analyze the numerical results. Finally, we summarize in the fourth part.
2. Theory
We try to explore the numerical solution of the Schrödinger equation, combined with the form of modified Kratzer–Coulomb potential [17–19].
$\begin{eqnarray}V\left(r\right)={V}_{0}{\left(\displaystyle \frac{r-R}{r}\right)}^{2}-\displaystyle \frac{A{{\rm{e}}}^{-{\alpha }r}}{r},\end{eqnarray}$
where ${V}_{0}$ represents the depth of limiting potential, $A$ is considered as ${V}_{0}\cdot R,$ ${\alpha }$ is the range of the potential and considered as ${\alpha }=1/R,$ $R$ signifies the radius of the quantum dot.The form of the radial Schrödinger equation is as follows
$\begin{eqnarray}\begin{array}{l}\displaystyle \frac{{{\rm{d}}}^{2}{R}_{{\rm{nl}}}\left(r\right)}{{\rm{d}}{r}^{2}}+\displaystyle \frac{2{m}^{* }\left({\eta },P,T\right)}{{\hslash }^{2}}\\ \,\times \left[{E}_{{\rm{nl}}}-V\left(r\right)-\displaystyle \frac{l\left(l+1\right){\hslash }^{2}}{2{m}^{* }\left({\eta },P,T\right){r}^{2}}\right]{R}_{{\rm{nl}}}\left(r\right)=0,\end{array}\end{eqnarray}$
where ${m}^{* }\left({\eta },P,T\right)$ is the effective mass of moving electron, which is affected by the mixture of Al-concentration (${\eta }$), hydrostatic pressure ($P$) and temperature ($T$) [20, 21].After substituting $V\left(r\right)$ into equation (2 ), it becomes
$\begin{eqnarray}\begin{array}{l}\displaystyle \frac{{{\rm{d}}}^{2}{R}_{{\rm{nl}}}\left(r\right)}{{\rm{d}}{r}^{2}}+\left[\displaystyle \frac{2{m}^{* }\left({\eta },P,T\right){E}_{{\rm{nl}}}}{{\hslash }^{2}}\right.-\displaystyle \frac{2{m}^{* }\left({\eta },P,T\right){V}_{0}}{{\hslash }^{2}}\\ \,+\displaystyle \frac{4{m}^{* }\left({\eta },P,T\right){V}_{0}R}{{\hslash }^{2}r}-\displaystyle \frac{2{m}^{* }\left({\eta },P,T\right){V}_{0}{R}^{2}}{{\hslash }^{2}{r}^{2}}\\ \,+\left.\displaystyle \frac{2{m}^{* }\left({\eta },P,T\right)A}{{\hslash }^{2}}\left(\displaystyle \frac{{{\rm{e}}}^{-{\alpha }r}}{r}\right)-\displaystyle \frac{l\left(l+1\right)}{{r}^{2}}\right]{R}_{{\rm{nl}}}\left(r\right)=0,\end{array}\end{eqnarray}$
for further simplification, the following approximations will be used [22] $\begin{eqnarray}\left\{\begin{array}{l}\displaystyle \frac{1}{{r}^{2}}\approx \displaystyle \frac{{{\alpha }}^{2}}{{\left(1-{{\rm{e}}}^{-{\alpha }r}\right)}^{2}},\\ \displaystyle \frac{1}{r}\approx \displaystyle \frac{{\alpha }}{\left(1-{{\rm{e}}}^{-{\alpha }r}\right)}.\end{array}\right.\end{eqnarray}$
Then equation (3 ) becomes
$\begin{eqnarray}\begin{array}{l}\displaystyle \frac{{{\rm{d}}}^{2}{R}_{{\rm{nl}}}\left(r\right)}{{\rm{d}}{r}^{2}}+\displaystyle \frac{1}{{\left(1-{{\rm{e}}}^{-{\alpha }r}\right)}^{2}}\times \left[-{{\varepsilon }}_{n}{\left(1-{{\rm{e}}}^{-{\alpha }r}\right)}^{2}\right.\\ \,\left.+{\beta }\left(1-{{\rm{e}}}^{-{\alpha }r}\right)+{\gamma }{{\rm{e}}}^{-{\alpha }r}\left(1-{{\rm{e}}}^{-{\alpha }r}\right)-{\delta }\right]{R}_{{\rm{nl}}}\left(r\right)=0,\end{array}\end{eqnarray}$
where $\begin{eqnarray}\begin{array}{l}{{\varepsilon }}_{n}=-\displaystyle \frac{2{m}^{* }\left({\eta },P,T\right)}{{\hslash }^{2}{{\alpha }}^{2}}\left({E}_{{\rm{nl}}}-{V}_{0}\right),\,{\beta }=\displaystyle \frac{4{m}^{* }\left({\eta },P,T\right){V}_{0}R}{{\hslash }^{2}{\alpha }},\\ {\gamma }=\displaystyle \frac{2{m}^{* }\left({\eta },P,T\right)A}{{\hslash }^{2}{\alpha }},\,{\delta }=\displaystyle \frac{2{m}^{* }\left({\eta },P,T\right){V}_{0}{R}^{2}}{{\hslash }^{2}}+l\left(l+1\right).\end{array}\end{eqnarray}$
The Nikiforov–Uvarov method is used to transform the Schrödinger-like equation into a solvable second-order differential equation in the form of5 ) after coordinate transformation $s={{\rm{e}}}^{-{\alpha }r}$ with equation (7 ), we can get
$\begin{eqnarray}{\psi }^{\prime\prime} \left(s\right)+\displaystyle \frac{\tilde{{\tau }}\left(s\right)}{{\sigma }\left(s\right)}{\psi }^{\prime} \left(s\right)+\displaystyle \frac{\tilde{{\sigma }}\left(s\right)}{{{\sigma }}^{2}\left(s\right)}{\psi }\left(s\right)=0,\end{eqnarray}$
after comparing equation ( $\begin{eqnarray}\begin{array}{l}\tilde{{\tau }}\left(s\right)=1-s,\,{\sigma }\left(s\right)=s\left(1-s\right),\\ \tilde{{\sigma }}\left(s\right)=-\left({{\varepsilon }}_{n}+{\gamma }\right){s}^{2}+\left(2{{\varepsilon }}_{n}+{\gamma }-{\beta }\right)s\\ \,-\left({{\varepsilon }}_{n}-{\beta }+{\delta }\right).\end{array}\end{eqnarray}$
After sorting, the expression of the corresponding energy level of the system is
$\begin{eqnarray}\begin{array}{l}{E}_{{\rm{nl}}}=\displaystyle \frac{{\hslash }^{2}{{\alpha }}^{2}}{2{m}^{* }\left({\eta },P,T\right)}\left[\displaystyle \frac{2{m}^{* }\left({\eta },P,T\right){V}_{0}{R}^{2}}{{\hslash }^{2}}+l\left(l+1\right)\right.\\ \left.\,-\displaystyle \frac{4{m}^{* }\left({\eta },P,T\right){V}_{0}R}{{\hslash }^{2}{{\alpha }}^{2}}\right]+{V}_{0}-\displaystyle \frac{{\hslash }^{2}{{\alpha }}^{2}}{2{m}^{* }\left({\eta },P,T\right)}\left[\displaystyle \frac{\left(n+{\zeta }\right)}{2}\right.\\ {\left.\,+\displaystyle \frac{\displaystyle \frac{2{m}^{* }\left({\eta },P,T\right){V}_{0}{R}^{2}}{{\hslash }^{2}}+l\left(l+1\right)-\displaystyle \frac{2{m}^{* }\left({\eta },P,T\right)\left(2{V}_{0}R+A\right)}{{\hslash }^{2}{\alpha }}}{2\left(n+{\zeta }\right)}\right]}^{2},\end{array}\end{eqnarray}$
where ${\zeta }=\tfrac{1}{2}\left(1+\sqrt{1+4{\delta }}\right),$ the wave function can be expressed as $\begin{eqnarray}{\psi }\left(s\right)={B}_{n}{s}^{\sqrt{{{\varepsilon }}_{n}+{\delta }}}{\left(1-s\right)}^{G}{P}_{n}^{\left(2\sqrt{{{\varepsilon }}_{n}+{\delta }},2G-1\right)}\left(1-2s\right),\end{eqnarray}$
among $G=\tfrac{1}{2}+\sqrt{\tfrac{1}{4}+{\beta }+{\delta }}.$The changes of optical rectification coefficients of intersubband transitions are calculated by the compact density matrix method and iterative method. The expression of the ORC can be obtained [23–25].
$\begin{eqnarray}\begin{array}{l}{{\chi }}_{0}^{\left(2\right)}=\\ \displaystyle \frac{4{\sigma }_{\nu }}{{{\varepsilon }}_{0}}{M}_{21}^{2}{\delta }_{12}\displaystyle \frac{{E}_{21}^{2}\left(1+\tfrac{{T}_{1}}{{T}_{2}}\right)+\left[{\left(\hslash {\omega }\right)}^{2}+{\left(\tfrac{\hslash }{{T}_{2}}\right)}^{2}\right]\left(\tfrac{{T}_{1}}{{T}_{2}}-1\right)}{\left[{\left({E}_{21}-\hslash {\omega }\right)}^{2}+{\left(\tfrac{\hslash }{{T}_{2}}\right)}^{2}\right]\left[{\left({E}_{21}+\hslash {\omega }\right)}^{2}+{\left(\tfrac{\hslash }{{T}_{2}}\right)}^{2}\right]}\end{array}\end{eqnarray}$
where ${E}_{ij}={E}_{i}-{E}_{j}$ is energy level interval, ${M}_{ij}\,=\left\langle {{\psi }}_{{n}_{i}{l}_{i}{m}_{i}}\left|ez\right|{{\psi }}_{{n}_{j}{l}_{j}{m}_{j}}\right\rangle $ is matrix element, ${\sigma }_{v}$ denotes carrier density, ${\delta }_{12}={M}_{22}-{M}_{11}.$3. Results and discussion
The ORC of GaAs/AlηGa1−ηAs quantum dots with MKCP will be systematically analyzed and discussed in this section, mainly discussing the effects of hydrostatic pressure $P,$ the depth of limiting potential ${V}_{0},$ temperature $T,$ Al-concentration $\eta $ and quantum dot radius R. The following are the fixed value and reference values we adopted in the calculation [23–25]: σv = 5 × 1024 m−3, ϵ0 = 8.85 × 10⁻¹² Fm−1 , T1 = 1 ps, T2 = 0.2 ps, η = 0.5, T = 300 K, R = 5 nm, P = 12 kbar, V0 = 200 meV.
Figure 1(a) shows the functional relationship between energy level interval E21 and quantum dot radius R at different limit potential depths. The trend of each curve in the figure shows different information. On the one hand, when the external conditions remain unchanged, all energy level intervals will decrease with the increase of quantum dot radius, because the increase of quantum dot radius will greatly enhance the influence of binding on electron motion. In order to achieve the purpose of equilibrium, the energy level interval will decrease. On the other hand, when the external conditions are determined, all energy level intervals decrease with the increase of limit potential depth. Because the limit effect is enhanced, there is no need for a larger energy level interval to meet the requirements. In figure 1(b), we plot the functional relationship between the product of matrix elements and the radius of quantum dots at different limit potential depths. The results show that the product of matrix element $\left|{M}_{12}^{2}{\delta }_{12}\right|$ will increase with the growth of quantum dot radius, and the matrix elements will decrease with the enlargement of limit potential depth. From the perspective of numerical calculation, it can be seen that the half diameter of quantum dots plays an indispensable role in the calculation of the density matrix. It is worth noting that the reason for this phenomenon is that the extended area and overlap of wave functions will increase with the increase of the number of atoms. At the same time, due to the rise of confinement potential depth, the matrix elements will be significantly reduced, that is, the increase of dissociation energy between quantum dots will lead to more obvious quantum confinement effect, and then affect the size of matrix elements.

Figure 1. The energy level interval along with rapid quantum dot radius R for different limiting potential depths. |
As shown in figure 2, take $P=12\,{\rm{kbar}},$ ${T}=300\,{\rm{K}},$ $R=5\,{\rm{nm}},$ ${\eta }=0.5.$ Two diagrams of the ORC and incident photon energy under different limit potential energy depths are made: ${V}_{0}$ = 150 meV, 200 meV, 250 meV. As can be seen from the figure: as the depth of the limiting potential grows, the ORC resonance peaks move towards the high-energy region, namely the ‘blueshift'. With increasing limiting potential depth ${V}_{0},$ increasing energy level interval, resulting in blueshift behavior. As can be seen from the figure, the ORC peaks diminish with the growth of the limiting potential depth, it can be seen from figure 1(b) that with the increase of the limiting potential depth, the matrix element $\left|{M}_{12}^{2}{\delta }_{12}\right|$ will decrease, which will affect the peak values of the ORC, so that the peaks of ORC show a downward trend.

Figure 2. ORC along with rapid the Photon Energy in situations of several different limiting potential depths. |
As shown in figure 3, take ${T}=300\,{\rm{K}},$ $\eta =0.5,$ ${V}_{0}=200\,{\rm{meV}},$ quantum dot radii are taken: R = 4 nm, 5 nm, 6 nm, respectively. As can be seen from the figure: with the increase of the radius of the quantum dot, the ORC resonance peaks move towards the low-energy region, that is, ‘redshift'occurs. As shown in figure 1(a), the increase of quantum dot radius will lead to the decrease of energy level interval ${E}_{21},$ so the resonant peak positions of the ORC are redshifted. At the same time, we can see from the figure that the ORC peaks continue to rise, because the dipole transition matrix elements $\left|{M}_{12}^{2}{\delta }_{12}\right|$ increase with the quantum dot radius R, and the wave function overlap becomes more and more obvious with the growing radius, which is the reason why this physical property appears.

Figure 3. ORC along with rapid the Photon Energy in situations of several different quantum dot radii. |
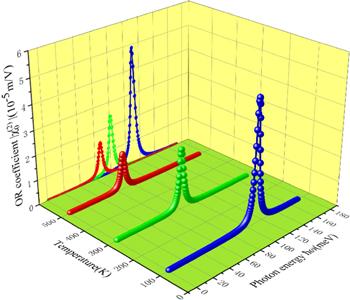
The following three figures respectively show the functional relationship between the ORC and incident light energy under different effective masses, which is specifically shown as Al-concentration (figure 4), hydrostatic pressure (figure 5) and temperature (figure 6). It can be seen from these three figures that the resonant peak position of the ORC moves to the low-energy region with the increase of hydrostatic pressure and temperature, that is, redshift, while the peak value of the ORC grows and decreases with hydrostatic pressure and temperature respectively. For aluminum concentration, the position of the ORC resonance peak is blue shifted, and the peak will be reduced. Consequently, from the perspective of the ORC peak, temperature and Al-concentration have similar effects, but their effects on the formant are opposite, which indicates that the size between the two physical quantities should be balanced in practical application, so as to achieve the ideal response. From the perspective of the ORC common peak, hydrostatic pressure and temperature have similar effects on the position of the formant, but will affect the peak of the ORC, Therefore, the values of these parameters need to be balanced when selecting the best working conditions.
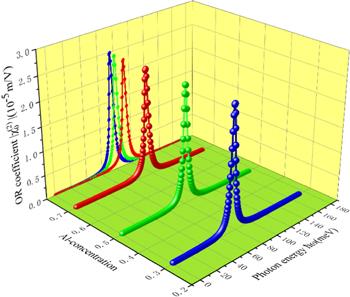
Figure 4. ORC along with rapid the Photon Energy in situations of several different Al-concentrations. |
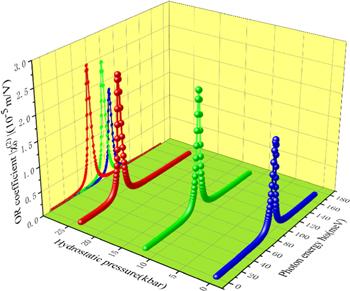
Figure 5. ORC along with rapid the Photon Energy in situations of several different hydrostatic pressures. |
Figure 6. ORC along with rapid the Photon Energy in situations of several different temperatures. |
4. Conclusions
To sum up, we systematically studied the effects of several factors on the nonlinear optical rectification coefficient of spherical quantum dots with MKCP. The numerical calculation shows that the peak value of the ORC will increase with the increase of quantum dot radius and hydrostatic pressure, and decrease with the increase of aluminum concentration, limit potential depth and temperature. In addition, the increase of hydrostatic pressure and temperature will make the resonance peak of the ORC blueshift, while the resonance peak of the ORC will redshift with the increase of quantum dot radius, limiting potential depth and Al-concentration. In short, this paper explores the different physical limits, radius and effective mass of quantum dots. Last but not least, this theoretical study is very important for predicting the behavior of this fine system under similar experimental conditions.