


1. Introduction
Since 2008, the measurements of cosmic-ray (CR) positrons by PAMELA [1], Fermi-LAT [2], and AMS-02 [3, 4] have shown an unexpected excess at energies ≳10 GeV. Possible interpretations for this excess include annihilating/decaying dark matter [5–8] and astrophysical sources like nearby pulsars within kpc [9, 10]. In particular, the middle-aged pulsar Geminga with a distance of ∼250 pc is widely assumed to produce high energy positrons that could propagate to the Earth [9–25].
In 2017, the HAWC experiment observed ∼10 TeV γ rays spatially extended about 2 degrees around Geminga, which would be produced by positrons and electrons of energies ∼100 TeV via inverse compton scattering (ICS) off low energy photons [26]. Therefore, this observation confirms that Geminga is a source of high energy positrons and electrons. But the surface brightness profile (SBP) measured by HAWC implies a diffusion coefficient smaller than the conventional value by at least two orders of magnitude. The recent observation of another extended halo around the middle-aged pulsar J0621 + 3749 by LHAASO further established the general conclusion of slow diffusion around pulsars [27]. Such slow diffusion results in much fewer CR positrons arriving at the Earth, unlikely to explain the positron excess. Nonetheless, by assuming a two-zone diffusion model with slow diffusion in a small zone around the source but normal diffusion outside the zone, positrons originating from Geminga can still sufficiently contribute to the positron excess [15, 16, 28].
In addition, positrons and electrons from Geminga are also expected to induce extended ICS γ rays in the energy range of Fermi-LAT. Based on two-zone diffusion templates, an analysis of 10 yr Fermi-LAT γ-ray data by Xi et al [19] (denoted as X19 below) did not find such extended emission and derive a stringent constraint on the γ-ray flux in the ∼5–100 GeV energy range. According to this constraint and the HAWC data, e± from Geminga with a single power-law injection spectrum can only contribute a small fraction to the CR positron spectrum observed by AMS-02.
On the other hand, taking into account both a larger region of interest and the proper motion of the Geminga pulsar, another analysis of Fermi-LAT data by Di Mauro et al [21] (denoted as D19 hereafter) claimed the discovery of extended γ-ray emissions around Geminga in the energy range of ∼10–100 GeV. However, considering both the corresponding γ-ray flux and the HAWC data, the Geminga contribution to the position flux they obtained is not enough for the AMS-02 excess.
Both the X19 and D19 analyses assumed a single power-law Geminga e± injection spectrum with a high energy cutoff. The inconsistency with the AMS-02 data may indicate that there are less low energy positrons and electrons producing GeV γ rays. Therefore, we will attempt to modify the injection spectrum by adding a low energy cutoff, in order to simultaneously explain the HAWC, Fermi-LAT, and AMS-02 data. The results of the γ-ray flux from the X19 and D19 analyses will be considered separately.
This paper is organized as follows. In section 2 , we describe the propagation of positrons and electrons produced by Geminga and the γ-ray flux induced by ICS. In section 3 , we simultaneously interpret the HAWC data, the Fermi-LAT γ-ray observation given by D19, and the AMS-02 positron spectrum assuming an e± injection spectrum with a low energy cutoff. In section 4 , we use the Fermi-LAT γ-ray constraint given by X19 to explore how much contribution Geminga can supply to the AMS-02 positron excess. Section 5 gives the summary and discussion.
2. Positrons and electrons from Geminga
The Geminga pulsar is a γ-ray source discovered by SAS-2 [29]. Its age is about 342 kyr [30], and the distance from the Earth is ${250}_{-62}^{+120}\,\mathrm{pc}$ [31]. Geminga is expected to emit lots of positrons and electrons, which diffuse away from Geminga and lose energies by upscatter low energy photons in the cosmic microwave background (CMB) and interstellar radiation backgrounds through ICS processes.
The propagation of CR e± is described by the diffusion-cooling equation
$\begin{eqnarray}\displaystyle \frac{\partial N}{\partial t}-{\rm{\nabla }}\cdot (D{\rm{\nabla }}N)-\displaystyle \frac{\partial }{\partial E}({bN})=Q,\end{eqnarray}$
where N is the e± differential density, E is the e± energy, D is the diffusion coefficient, and Q is the source term. The energy loss rate b includes both contributions from synchrotron radiation and ICS. The synchrotron energy loss rate in a magnetic field B is given by [32] $\begin{eqnarray}{b}_{\mathrm{syn}}=\displaystyle \frac{4{\sigma }_{{\rm{T}}}{\gamma }_{e}^{2}{U}_{B}}{3{m}_{e}c},\end{eqnarray}$
where σT is the Thomson cross section, γe = E/(mec2) is the e± Lorentz factor, and UB = B2/(8π) is the energy density of the magnetic field. The energy loss rate due to ICS is estimated following [33]. We convert the propagation equation to a difference equation, which is solved using the numerical method described in [15].We assume a spherically symmetrical two-zone diffusion scenario with the diffusion coefficient given by
$\begin{eqnarray}D(E,r)=\left\{\begin{array}{ll}{D}_{1}(E), & r\lt {r}_{\star },\\ {D}_{2}(E), & r\geqslant {r}_{\star }.\end{array}\right.\end{eqnarray}$
Here r is the distance from Geminga, and r⋆ denotes the boundary of the two diffusion zones. Both D1(E) and D2(E) are assumed to have a form of ${D}_{100}{\left(E/100\,\mathrm{TeV}\right)}^{\delta }$, where D100 is the diffusion coefficient at E = 100 TeV, and δ = 0.33 is adopted for a Kolmogorov-type diffusion [34].The morphological SBP study of the extended TeV γ-ray emissions around Geminga by HAWC gives a diffusion coefficient ${D}_{100}=({3.2}_{-1.0}^{+1.4})\times {10}^{27}\,{\mathrm{cm}}^{2}\,{{\rm{s}}}^{-1}$ for 100 TeV e± around Geminga, while a similar study of another nearby pulsar Monogen (PSR B0656+14) leads to ${D}_{100}\,=({15}_{-9}^{+49})\times {10}^{27}\,{\mathrm{cm}}^{2}\,{{\rm{s}}}^{-1}$ [26]. The joint fit of both results in D100 = (4.5 ± 1.2) × 1027 cm2 s−1. Thus, D100 for the inner zone with r < r⋆ is at the order of 1027 cm2 s−1. For the outer zone with r ≥ r⋆, positrons and electrons propagate through the ordinary interstellar medium (ISM), and we take the GALPROP [35] default value D100 = 1.7 × 1030 cm2 s−1, which is consistent with the measurements of CR secondary-to-primary ratios, particularly the B/C ratio.
The source term for high energy e± injected by Geminga is assumed as
$\begin{eqnarray}Q(t,E,r)=q(t,E)\delta (r),\end{eqnarray}$
where $\begin{eqnarray}\begin{array}{rcl}q(t,E) & = & {q}_{0}{\left(1+\displaystyle \frac{t}{\tau }\right)}^{-2}{E}^{-\gamma }\\ & & \times \exp \left(-\displaystyle \frac{E}{{E}_{\mathrm{hc}}}\right)\exp \left(-\displaystyle \frac{{E}_{\mathrm{lc}}}{E}\right).\end{array}\end{eqnarray}$
τ is the characteristic initial spin-down time scale of the Geminga pulsar, taken to be 12 kyr following [26]. γ is the injection spectral index for e±. Ehc and Elc are the high and low energy cutoffs, respectively. q0 is a constant determined by the normalization relation $\begin{eqnarray}{\int }_{{E}_{\min }}^{{E}_{\max }}q({t}_{{\rm{s}}},E)E{\rm{d}}E=\eta {\dot{E}}_{s},\end{eqnarray}$
with the Geminga age ts = 342 kyr and the spin-down luminosity ${\dot{E}}_{{\rm{s}}}=3.2\times {10}^{34}\,\mathrm{erg}\,{{\rm{s}}}^{-1}$ [30]. Here η is the conversion efficiency for the spin-down energy converted to e± energies. We will not consider the difference between the positrons and electrons when calculating the γ-ray flux, and the positron flux ${{\rm{\Phi }}}_{{e}^{+}}$ is just half of the total e± flux.The photon emissivity due to e± ICS based on the Klein–Nishina cross section is given by [36]
$\begin{eqnarray}\begin{array}{l}{Q}_{\mathrm{ICS}}(t,{E}_{\gamma },r)=4\pi \sum _{j}{\displaystyle \int }_{0}^{\infty }{\rm{d}}\epsilon \,{n}_{j}(\epsilon )\\ \quad \times {\displaystyle \int }_{{E}_{\min }}^{{E}_{\max }}{\rm{d}}E\,J(t,E,r)F(\epsilon ,{E}_{\gamma },E),\end{array}\end{eqnarray}$
nj(ε) is the number density of a background photon component j with energy ε, temperature Tj, and energy density Uj, expressed as $\begin{eqnarray}{n}_{j}(\epsilon )=\displaystyle \frac{15{U}_{j}}{{\left(\pi {{kT}}_{j}\right)}^{4}}\displaystyle \frac{{\epsilon }^{2}}{\exp (\epsilon /{{kT}}_{j})-1},\end{eqnarray}$
where k is the Boltzmann constant. The e± energy threshold for upscattering a target photon with energy ε to a photon with energy Eγ is $\begin{eqnarray}{E}_{\min }=\displaystyle \frac{1}{2}\left({E}_{\gamma }+\sqrt{{E}_{\gamma }^{2}+\displaystyle \frac{{E}_{\gamma }{m}_{e}^{2}{c}^{4}}{\epsilon }}\right).\end{eqnarray}$
J(t, E, r) = veN(t, E, r)/(4π) is the e± intensity, with ve denoting the e± speed, which approaches the light speed c for high energy e±. The function F is given by $\begin{eqnarray}\begin{array}{l}F(\epsilon ,{E}_{\gamma },E)=\displaystyle \frac{3{\sigma }_{{\rm{T}}}}{4{\gamma }_{e}^{2}\epsilon }\\ \quad \times \left[2q\mathrm{ln}q+(1+2q)(1-q)+\displaystyle \frac{{{\rm{\Gamma }}}^{2}{q}^{2}(1-q)}{2(1+{\rm{\Gamma }}q)}\right],\end{array}\end{eqnarray}$
with $\begin{eqnarray}{\rm{\Gamma }}=\displaystyle \frac{4\epsilon {\gamma }_{e}}{{m}_{e}{c}^{2}},\quad q=\displaystyle \frac{{E}_{\gamma }}{{\rm{\Gamma }}({E}_{e}-{E}_{\gamma })}.\end{eqnarray}$
Following [26], we consider three background photon components, including the CMB, the IR background, and the optical background, for the ICS processes. The temperatures and energy densities are presented in table 1. Integrating QICS(ts, Eγ, r) along the light of sight [37], we obtain the γ-ray flux for specific energy Eγ and angular separation θ
$\begin{eqnarray}I({E}_{\gamma },\theta )=\displaystyle \frac{1}{4\pi }{\int }_{{l}_{\min }}^{{l}_{\max }}{\rm{d}}l\,{Q}_{\mathrm{ICS}}({t}_{s},{E}_{\gamma },r).\end{eqnarray}$
Then we integrate out θ to get the energy spectrum of the γ-ray flux Φγ, or integrate out Eγ to derive the SBP as a function of θ. The angular separation θ is integrated up to 20°, which is consistent with the large regions of interest considered in the X19 [19] and D19 [21] analyses of Fermi-LAT data.Table 1. Temperature Tj and energy density Uj of three background photon components [26]. |
| Component j | Tj (K) | Uj (eV cm−3) |
| CMB | 2.7 | 0.26 |
| IR | 20 | 0.3 |
| Optical | 5000 | 0.3 |
3. Result according to the D19 gamma-ray observation
In this section, we try to interpret the HAWC and AMS-02 data according to the Fermi-LAT γ-ray observation from the D19 analysis [21]. Both the results without and with the low energy cutoff Elc in the e± injection spectrum are calculated for comparison.
Firstly, we consider an e± injection spectrum without Elc, and adjust the energy conversion efficiency η to meet the data. Setting the boundary radius r⋆ = 50 pc, the diffusion coefficient at E = 100 GeV in the inner diffusion zone D100 =3.5 × 1027 cm2 s−1, the ISM magnetic field B = 3 μG, the e± injection spectral index γ = 2.2, and the high energy cutoff Ehc = 511 TeV, we derive the γ-ray spectrum around Geminga, the Geminga SBP, and the CR positron spectrum at the Earth for η = 0.6, shown as the blue solid lines in figure 1.
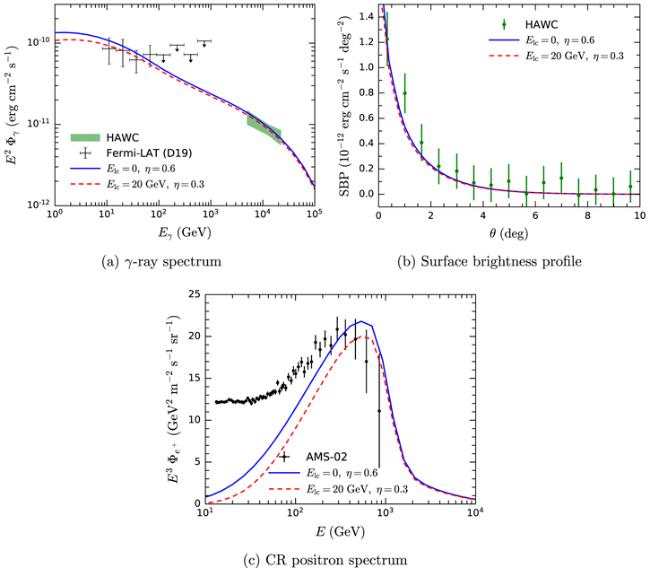
Figure 1. The γ-ray spectrum around Geminga (a), the Geminga SBP (b), and the CR positron spectrum (c) assuming e± injection spectra without a low energy cutoff for η = 0.6 (blue solid lines) and with Elc = 20 GeV for η = 0.3 (red dashed lines). In the upper left panel, the green region denotes the ∼10 TeV spectral data measured by HAWC [26], and the data points and upper limits in 10 GeV ≲ Eγ ≲ TeV are given by the D19 analysis of Fermi-LAT data [21]. The data points in the upper right panel show the HAWC observation of the Geminga SBP [26]. The lower panel displays the positron spectrum measured by AMS-02 [4] (a) γ-ray spectrum (b) surface brightness profile (c) CR positron spectrum. |
In order to compare the predictions and the observations, we show the ∼10 TeV spectral data measured by HAWC [26] and the Fermi-LAT data points and upper limits from ∼10 GeV to ∼ TeV given by the D19 analysis [21] in figure 1(a). The HAWC observation of the Geminga SBP [26] is demonstrated in figure 1(b), while the positron spectrum measured by AMS-02 [4] is displayed in figure 1(c). For the above setup with η = 0.6, we find that the γ-ray prediction can well interpret the γ-ray spectrum and the SBP, and the predicted e+ spectrum can explain the AMS-02 data at E ≳ 100 GeV. However, a 60% efficiency of the spin-down energy converted to e± energies looks unrealistic.
Secondly, we introduce a low energy cutoff Elc =20 GeV in the e± injection spectrum with other parameters unchanged and find that the observational data can be explained for η = 0.3, as illustrated as the red dashed lines in figure 1. Such a 30% conversion efficiency is much more reasonable than the previous one. Now the predicted positron flux at E ≲ 100 GeV seems slightly lower than the blue solid line, but we can still interpret the AMS-02 data at E ≳ 100 GeV very well.
4. Result according to the X19 gamma-ray constraint
In contrast to the D19 analysis [21], the X19 analysis of the Fermi-LAT data has not found any extended γ-ray emission around Geminga, deriving a rather stringent constraint on the γ-ray flux at ∼5−100 GeV [19]. In this section, we consider this constraint to see how it affects the Geminga contribution to the CR positron spectrum, assuming a low energy cutoff in the e± injection spectrum. However, we find it impossible to simultaneously explain the HAWC, Fermi-LAT, and AMS-02 data, because the X19 constraint is too strict. Instead, we would like to know how much contribution Geminga can provide to the AMS-02 positron excess.
For this purpose, we treat γ, Ehc, Elc, η, B, and D100 in the inner diffusion zone as free parameters and perform a scan in the parameter space with fixed r⋆, utilizing the MultiNest algorithm [38] to improve the fitting efficiency. The ranges for the free parameters in the scan are chosen to be
$\begin{eqnarray}\begin{array}{l}1.8\lt \gamma \lt 2.2,\quad 200\,\mathrm{TeV}\lt {E}_{\mathrm{hc}}\lt 600\,\mathrm{TeV},\\ \quad 100\,\mathrm{GeV}\lt {E}_{\mathrm{lc}}\lt 900\,\mathrm{GeV},\\ 0.1\lt \eta \lt 0.4,\quad 3\,\mu {\rm{G}}\lt B\lt 8\,\mu {\rm{G}},\\ \quad {10}^{26}\,{\mathrm{cm}}^{2}\,{{\rm{s}}}^{-1}\lt {D}_{100}\lt {10}^{27}\,{\mathrm{cm}}^{2}\,{{\rm{s}}}^{-1}.\end{array}\end{eqnarray}$
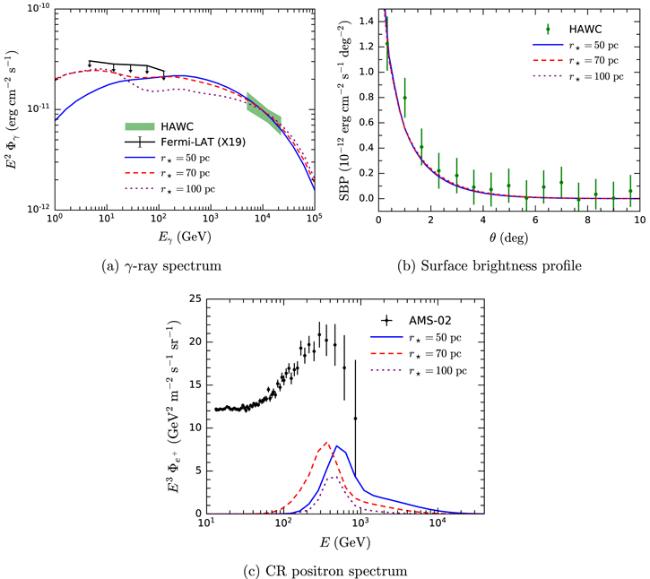
In order to get optimal results, we adopt the most loose upper limits on the γ-ray flux in 10−500 GeV derived by the X19 analysis, i.e. the upper limits in the upper panel of figure 6 in the X19 paper [19]. The parameters of the best results we obtain for r⋆ = 50, 70, 100 pc are listed in table 2. The corresponding predictions for the γ-ray spectrum, the SBP, and the positron spectrum are demonstrated in figure 2. While the HAWC data are properly fitted and the γ-ray flux in 5 GeV ≲ Eγ ≲ 100 GeV lies below the X19 upper limits, we find that Geminga can only supply less than 50% of the AMS-02 positron flux at E ∼ 400 GeV.
Figure 2. The best results for the γ-ray spectrum around Geminga (a), the Geminga SBP (b), and the CR positron spectrum (c) assuming r⋆ = 50 pc (blue solid lines), r⋆ = 70 pc (red dashed lines), and r⋆ = 100 pc (purple dotted lines). In the upper left panel, the upper limits in 5 GeV ≲ Eγ ≲ 100 GeV are given by the X19 analysis of Fermi-LAT data [19]. The other experimental data are the same as in figure 1 (a) γ-ray spectrum (b) surface brightness profile (c) CR positron spectrum. |
Table 2. Parameters in the best results for fixed r⋆. |
| r⋆ (pc) | 50 | 70 | 100 |
|---|---|---|---|
| γ | 2.10 | 1.93 | 1.70 |
| Ehc (TeV) | 520 | 537 | 463 |
| Elc (GeV) | 870 | 302 | 547 |
| η | 0.15 | 0.21 | 0.16 |
| B (μG) | 5.0 | 6.9 | 7.2 |
| D100 (1027 cm2 s−1) | 4.8 | 7.8 | 8.5 |
These results show that the X19 constraint favor γ < 2, η ≲ 0.21, and Elc of several hundred GeV, which suppresses the γ-ray flux at $\sim { \mathcal O }(10)\mathrm{GeV}$. According to an approximate relation [19]
$\begin{eqnarray}{E}_{\gamma }=20{\left(\displaystyle \frac{E}{100\,\mathrm{TeV}}\right)}^{2}\mathrm{TeV}\end{eqnarray}$
for e± ICS off CMB photons, ${ \mathcal O }(10)\mathrm{GeV}$ γ rays are induced by ${ \mathcal O }(\mathrm{TeV})$ e±. Thus, the X19 constraint implies less ${ \mathcal O }(\mathrm{TeV})$ positrons and electrons from Geminga, resulting in a lower CR positron flux for $E\sim { \mathcal O }(100)\mathrm{GeV}$ at the Earth, which is insufficient to explain the AMS-02 excess.5. Summary and discussion
In this work, we attempt to explain the AMS-02 positron excess by the nearby pulsar Geminga assuming a two-zone diffusion scenario and an e± injection spectrum with a low energy cutoff, taking into account the γ-ray data from HAWC and Fermi-LAT. The analyses of Fermi-LAT data for extended γ-ray emissions around Geminga by two groups have obtained different results. While the X19 analysis found no such emission and derive upper limits on the γ-ray flux, the D19 analysis claimed observation of the extended γ rays. We have considered both results separately.
By fitting the D19 observation and the HAWC data assuming no low energy cutoff in the injection spectrum, we find that the conversion efficiency η should be as large as 60% to account for the AMS-02 positron excess. Nonetheless, if a low energy cutoff Elc = 20 GeV is introduced, we would only need a 30% conversion efficiency, which is much more realistic. Therefore, it is plausible to interpret the positron excess by Geminga, according to the D19 analysis.
On the other hand, if the stringent constraint from the X19 analysis is considered, we find that Geminga could not account for the total positron excess. We carry out a scan in the parameter space for the boundary radius r⋆ = 50, 70, 100 pc and require it to fit the HAWC data and satisfy the X19 constraint. The best results we obtain can only explain a fraction of the AMS-02 positron flux lower than 50% at E ∼ 400 GeV. This may imply that more nearby pulsars or other sources are needed to interpret the positron excess.
Since the different conclusions obtained above come from the contradictory results of the two Fermi-LAT analyses, it is crucial to know whether the result is true. This may require more careful data analysis and more Fermi-LAT data.