


1. Introduction
Although the standard model (SM) has made unprecedented achievements [1, 2], there are still some problems that cannot be solved. In an experiment, the SM cannot explain the dark matter and dark energy in the Universe. In theory, the SM has a naturalness problem, in which the top quark and the Higgs boson play a key role [3, 4]. In order to explain the naturalness problem, the vector-like quarks (VLQs) are often introduced into the models beyond the SM, such as twin Higgs models [5], composite Higgs models [6], and the little Higgs models [7]. The vector-like quark model also provides a solution to the CP violation problem. Besides, vector-like quarks contribute to the unification of coupling constants and play an important role in explaining the VCKM unitary problem caused by the measurements of Vus and Vud [8-17, 19, 18]. In this paper, we will study the vector-like top quark T (VLT) with charge 2/3 in the framework of a simplified singlet model [20-22].
The VLT is spin-1/2 colored, and the left-handed and right-handed components have the same properties as the SM symmetric group transformations. So far, the ATLAS and CMS collaborations at the LHC have performed wide measurements of searching for VLT in various final states [23-27]. Based on the experimental data, the mass of the singlet T has been excluded up to 1.27 TeV with 139 fb−1 at 95% confidence level (CL) [28].
Compared to the complicated backgrounds at the LHC, the electron-positron colliders can provide a clean environment to detect the VLT. Especially, the polarized incident beams at electron-positron colliders can improve the discovery potential. So far, some electron-positron collider design plans have been put forward, such as the Circular Electron Positron Collider (CEPC) [29, 30] with 120 GeV, the Future Circular Collider in electron-positron mode (FCC-ee) [31] with 183 GeV, the International Linear Collider (ILC) [32] with 250 GeV, and the Compact Linear Collider (CLIC) [33] with 3 TeV. Among these design plans, the CLIC is expected to have collision energy up to 3 TeV so that the TeV VLT can be detected [34-37]. In this work, we will explore the single VLT production in association with Wb at the CLIC.
The paper is organized as follows: In section 2 , we give a brief review of the simplified model including an SU(2) singlet T and the relevant experiment limits. In section 3 , We analyzed the influence of initial-state radiation(ISR) and beam polarization. In section 4 , we present the event generation and the analysis of the signal. In section 5 , we display the exclusion and discovery regions for the T in two modes. Finally, we give a summary in section 6 .
2. A review of simplified model
2.1. model introduction
In this paper, the singlet T model is utilized assuming that the T only decays to third-generation quarks. The Lagrangian related to T decay can be expressed as follows [22, 38]:
$\begin{eqnarray}\begin{array}{rcl}{{ \mathcal L }}_{T} & = & {\kappa }_{T}\displaystyle \frac{g}{2}\left[{\bar{T}}_{L}{W}_{\mu }^{+}{\gamma }^{\mu }{b}_{L}\right]\\ & & +{\kappa }_{T}\displaystyle \frac{g}{2\sqrt{2}{\rm{\cos }}{\theta }_{W}}\left[{\bar{T}}_{L}{Z}_{\mu }{\gamma }^{\mu }{t}_{L}\right]\\ & & -{\kappa }_{T}\displaystyle \frac{{{gM}}_{T}}{2\sqrt{2}{m}_{W}}\left[{\bar{T}}_{R}{{Ht}}_{L}\right]+{\rm{h.c.}},\end{array}\end{eqnarray}$
where g is the SU(2) gauge coupling constant and θW is the Weinberg angle, MT denotes the T mass. The parameter κT represents the coupling strength and the independence of the branching ratio but will determine the strength of the single production.In this work, the Wb decay channel will be investigated since this channel has a large branching ratio and simple final states. When the T particle decays to Wb, the signal of the T particle is very similar to the top quark in SM. As a result, the top jet tagging technique can be used to distinguish the signal from SM backgrounds [41].
2.2. experiment constrain
In this model, only the top quark mixing with VLT, the relation between mass eigenstates (TL,R) and weak eigenstates (${T}_{L,R}^{0}$) can be factored by two 2 × 2 unitary matrices VL,R,
$\begin{eqnarray}\begin{array}{rcl}\left(\begin{array}{c}{t}_{L,R}\\ {T}_{L,R}\end{array}\right) & = & {V}_{L,R}\left(\begin{array}{c}{t}_{L,R}^{0}\\ {T}_{L,R}^{0}\end{array}\right)\\ & = & \left(\begin{array}{cc}\cos {\theta }_{L,R} & -\sin {\theta }_{L,R}{{\rm{e}}}^{{\rm{i}}\phi }\\ \sin {\theta }_{L,R}{{\rm{e}}}^{-{\rm{i}}\phi } & \cos {\theta }_{L,R}\end{array}\right)\left(\begin{array}{c}{t}_{L,R}^{0}\\ {T}_{L,R}^{0}\end{array}\right).\end{array}\end{eqnarray}$
Here, θ is the mixing angles between mass and weak eigenstates, $\phi$ is the CP-violation phase.The width of t decay to Wb is proportional to $(1-\sin {\theta }_{L}^{2})$ [42], that is
$\begin{eqnarray}\displaystyle \frac{{{\rm{\Gamma }}}_{t\to {Wb}}^{{\rm{SM}}}}{{{\rm{\Gamma }}}_{t\to {Wb}}^{{\rm{Singlet}}-T}}\propto \displaystyle \frac{1}{1-{\sin }^{2}{\theta }_{L}}.\end{eqnarray}$
So the mixing angle $(\sin {\theta }_{L})$ needs to confront with the experimental measurement of the top width. We take the top width $\begin{eqnarray}{{\rm{\Gamma }}}_{t\to {Wb}}^{{\rm{SM}}}={1.36}_{-0.15}^{+0.19}\mathrm{GeV},\end{eqnarray}$
and obtain the 2σ limit on $\sin {\theta }_{L}$ as follows $\begin{eqnarray}\sin {\theta }_{L}\leqslant 0.5.\end{eqnarray}$
Besides, most of the effect on electroweak precision observables (EWPO) can be described by the oblique parameters S, T, and U [43]. In the VLQ models, the new contributions to the oblique parameters have been discussed in [42, 44-46], and the constraints on the VLQ parameters have been given in [42]. Now that the experimental values of these oblique parameters have been updated, we also need to update these limits accordingly. The new contributions of the VLQ model to parameters S, T can be given by [47, 48]:
$\begin{eqnarray}\begin{array}{rcl}{S}_{{\rm{th}}} & = & {\sin }^{2}{\theta }_{L}\left.\displaystyle \frac{3}{6\pi }\left[({\sin }^{2}{\theta }_{L}-\displaystyle \frac{2}{3}\right)\mathrm{ln}x\right.\\ & & +\left(\displaystyle \frac{{\left(1+x\right)}^{2}}{{\left(1-x\right)}^{2}}+\displaystyle \frac{2{x}^{2}\left(3-x\right)}{{\left(1-x\right)}^{3}}\mathrm{ln}x-\displaystyle \frac{8}{3}\right)\\ & & \left.\times \left(1-{\sin }^{2}{\theta }_{L}\right)\right],\end{array}\end{eqnarray}$
$\begin{eqnarray}\begin{array}{rcl}{T}_{{\rm{th}}} & = & {\sin }^{2}{\theta }_{L}\displaystyle \frac{3}{16\pi }\displaystyle \frac{1}{{s}_{W}^{2}{c}_{W}^{2}}\displaystyle \frac{4\sqrt{2}{G}_{F}{c}_{W}^{2}{m}_{t}^{2}}{{g}^{2}}\left[\displaystyle \frac{{\sin }^{2}{\theta }_{L}}{x}\right.\\ & & -\left.(2-{\sin }^{2}{\theta }_{L})-\displaystyle \frac{2}{1-x}\left(1-{\sin }^{2}{\theta }_{L}\right)\mathrm{ln}x\right],\end{array}\end{eqnarray}$
with $x={m}_{t}^{2}/{m}_{T}^{2}$. Here, we assume U = 0 and define the χ2 as follows $\begin{eqnarray}{\chi }^{2}={\left(\begin{array}{c}\displaystyle \frac{{S}_{{\rm{th}}}-{S}_{{\rm{\exp }}}}{{S}_{{\rm{err}}}}\\ \displaystyle \frac{{T}_{{\rm{th}}}-{T}_{{\rm{\exp }}}}{{T}_{{\rm{err}}}}\end{array}\right)}^{{\rm{T}}}{\left(\begin{array}{cc}1 & C\\ C & 1\end{array}\right)}^{-1}\left(\begin{array}{c}\displaystyle \frac{{S}_{{\rm{th}}}-{S}_{{\rm{\exp }}}}{{S}_{{\rm{err}}}}\\ \displaystyle \frac{{T}_{{\rm{th}}}-{T}_{{\rm{\exp }}}}{{T}_{{\rm{err}}}}\end{array}\right),\end{eqnarray}$
where C = 0.92 is the correlation coefficient, the experimental values ${S}_{\exp }=0.00\pm 0.07$, ${T}_{\exp }=0.05\pm 0.06$ [49]. We obtain the 2σ confidence regions by χ2 < 6.18 and show the constraints in figure 4.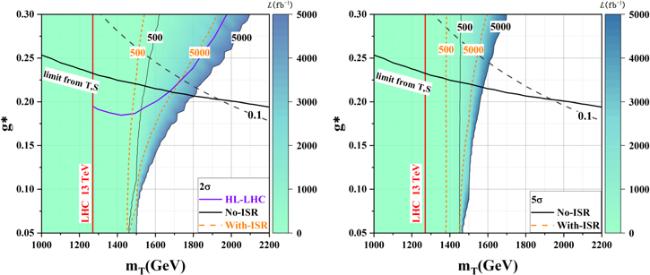
Figure 4. Contour plots of exclusion and discovery capability in the g* − mT plane at 3 TeV CLIC with ${P}_{{e}^{-}}=-0.8$. The red solid lines represent the limit from the LHC direct searches, the gray dashed lines represent the width-to-mass ratio ΓT/mT = 0.1, and the black solid lines represent the limit from T, S. The black and orange dashed lines represent the exclusion and discovery regions at different integrated luminosities without and with ISR, respectively. The purple line in the left panel stands for the result of T → Wb at 14 TeV HL-LHC [63], while there is no corresponding line in the right panel since the discovery region cannot reach the range of g* < 0.3. |
For the coupling coefficient, different symbols are used in different literature, which causes trouble for readers. By comparing different literature [38, 50], we deduce the relationship between various symbols of the coupling coefficient as follows:
$\begin{eqnarray}{g}^{\ast }=\sqrt{2}{\kappa }_{T}=2\sin {\theta }_{L}.\end{eqnarray}$
In the following numerical simulation, we scan a relatively relaxed region with the coupling coefficient: g* < 0.3 (corresponding to $\sin {\theta }_{L}\lt 0.15$).
3. Beam polarization and ISR effect
In the VLT extensions, T quark can be produced in two ways: single production and pair production. The cross section of pair production is independent of g* and chirality, even though it is suppressed by the phase space when T is massive. The cross section of single production is chirality-dependent and proportional to the g*.
When T mass is small, figure 1(a) plays a major role in the cross section of e+e− → TWb. Since this process is independent of chirality, the cross section does not increase if the e+e− polarizations are considered. However, when T mass is larger, the other figures in figure 1 will play an important role in the cross section. Consequently, the cross section will increase significantly considering the polarizations. We show the polarization cross section in figure 2 given that ${P}_{{e}^{+}}=0,{P}_{{e}^{-}}=-0.8$ according to the CLIC design report [33].
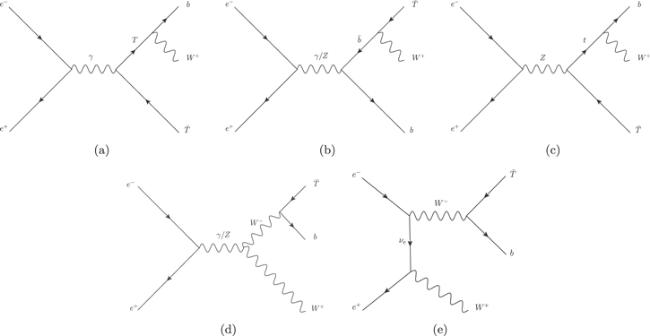
Figure 1. Leading order Feynman diagram of the process ${e}^{+}{e}^{-}\to \bar{T}{W}^{+}b$. |
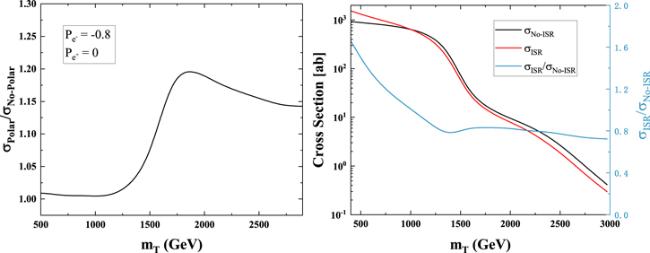
Figure 2. The left panel represents the polarization effect for different mT with g* = 0.2, where the black solid line denotes the enhancement ratio σPolar/σNo−Polar. The right panel represents the ISR effect for different mT with g* = 0.2 assuming ${P}_{{e}^{-}}=-0.8,{P}_{{e}^{+}}=0$, where the black and red solid lines denote cross sections σNo−ISR and σISR respectively. The blue solid line denotes the ratio σISR/σNo−ISR. |
We consider the ISR effects using the scheme named clic3000ll by MG5_aMCv3.2.0 and summarise the results in table 1 and the right panel of figure 2. The ISR effect will reduce the center of mass $\sqrt{s}$. When the T mass is small, the dominant contribution comes from the s-channel pair-produced process. The cross section of this process is inversely proportional to s2 so that the cross section increases after considering ISR. With the increase of mT, the single-produced process will gradually dominate the contribution and the cross section will decrease with the ISR. We can see that there is a balance point, that is σISR = σNo−ISR, at the mT = 970 GeV. Besides, there are many s-channel processes in the backgrounds so that the cross sections of backgrounds also increase after considering ISR as shown in the table 1.
Table 1. Cross sections without ISR (σNo−ISR) and with ISR (σISR) at the 3 TeV CLIC for g* = 0.2 and ${P}_{{e}^{-}}=-0.8,{P}_{{e}^{+}}=0$. |
| Signal (ab) | Backgrounds (ab) | |||||
|---|---|---|---|---|---|---|
| T1400 | T1500 | T1600 | ${{tW}}^{-}\bar{b}$ | W+W−Z | W+W−H | |
| σNo−ISR | 227.5 | 79 | 30 | 1700 | 270 | 66 |
| σISR | 164 | 53 | 24.85 | 3860 | 350 | 100 |
| σISR/σNo−ISR | 72.0% | 67.1% | 82.8% | 227.1% | 129.6% | 166.7% |
What's more, the cross section sharply changes around mT = 1500 GeV as shown in figure 2. As a result, mT = 1400, 1500, 1600 GeV are chosen as benchmarks to make our analysis more representative in the range of mT ∈ [1200, 2200] GeV under the LHC limit.
4. Event generation and analysis
In this paper, we consider the semileptonic decay modes as follows:
${e}^{+}{e}^{-}\to \bar{T}{W}^{+}b\to ({W}^{-}\bar{b})({W}^{+}b)\to ({l}^{-}\bar{\nu }\bar{b})({jjb})$
${e}^{+}{e}^{-}\to \bar{T}{W}^{+}b\to ({W}^{-}\bar{b})({W}^{+}b)\to ({jj}\bar{b})({l}^{+}\nu b).$
Based on the characteristics of final states, we consider the main SM backgrounds as: ${{tW}}^{-}\bar{b}$, W+W−Z, W+W−H. In our calculations, the conjugate processes of signal and backgrounds have been included, and the $t\bar{t}$ is included in the ${{tW}}^{-}\bar{b}$. According to the final states of signal, we consider the main SM backgrounds and their decay modes as follows:
| • | ${e}^{+}{e}^{-}\to {W}^{+}b\bar{t}\to ({W}^{+}b)({W}^{-}\bar{b})\to ({l}^{+}\nu b)({jj}\bar{b})$ |
| • | ${e}^{+}{e}^{-}\to {W}^{+}{W}^{-}Z\to ({l}^{+}\nu )({jj})(b\bar{b})$ |
| • | ${e}^{+}{e}^{-}\to {W}^{+}{W}^{-}H\to ({l}^{+}\nu )({jj})(b\bar{b}).$ |
We calculate the cross sections of signal and backgrounds and generate the parton-level events by using MG5_aMCv3.2.0 [51], where the basic cuts are chosen as follows:
$\begin{eqnarray*}\begin{array}{l}{\rm{\Delta }}R(x,y)\gt 0.4\ (x,y=j,b,l),\\ \left|{\eta }_{b,l}\right|\lt 2.5,\,\,\quad \left|{\eta }_{j}\right|\lt 5,\\ {p}_{T}^{j}\gt 20\,\mathrm{GeV},\,\,\quad {p}_{T}^{l,b}\gt 25\,\mathrm{GeV}.\end{array}\end{eqnarray*}$
Here, ${\rm{\Delta }}R=\sqrt{{({\rm{\Delta }}\phi )}^{2}+{({\rm{\Delta }}\eta )}^{2}}$, Δ$\phi$ and Δη are the azimuth difference and pseudo-rapidity difference of the two particles.We use Pythia8 [52] for the parton shower and make a fast detector simulation by Delphes [53] with 3 TeV CLIC_Card [54]. Then, we cluster jets by Fastjet [55] with the C-A algorithm [56], where we modify the distance parameter R = 1.5 and the momentum parameter JetPTMin = 200 GeV to identify the fat jet [57]. Finally, we use MadAnalysis 5 [58] to perform the event analysis.
In figure 3, we plot the distributions of the mass ${M}_{{j}_{2}}$, the transverse momentum ${p}_{T}^{{j}_{2}}$, ${p}_{T}^{{l}_{1}}$, the pseudorapidity ηj, ηl, and the MET for the signal and SM backgrounds at CLIC 3 TeV. We can see that the peaks in the ${M}_{{j}_{2}}$ distributions respectively appear at mW, mZ, mH, and mt, which means that the jet j2 can be identified as W-jet, Z-jet, H-jet, and t-jet.

Figure 3. Normalized distributions of ${p}_{T}^{{l}_{1}}$, ${p}_{T}^{{j}_{2}}$, ${m}_{{j}_{2}}$, MET, ${\eta }_{{j}_{1}}$, and ${\eta }_{{l}_{1}}$ for the signal (mT = 1500 GeV and g* = 0.2) and backgrounds at the 3 TeV CLIC. The black arrows indicate the selected cuts. |
Based on the analysis above, we take the cut criteria as follows:
| • | Trigger :1 < N(j) < 4, N(l) = 1 |
| • | Cut 1: M(j2) < 100 GeV |
| • | Cut 2: PT(j2) > 300 GeV |
| • | Cut 3: − 1 < η(l) < 1 |
| • | Cut 4: − 1 < η(j1) < 1 |
| • | Cut 5: pT(l) > 200 GeV |
| • | Cut 6: MET > 80 GeV |
We show the cut flows of the signal for three signal benchmark points (mT = 1400, 1500, 1600 GeV, and g* = 0.2) and backgrounds in table 2. According to the total efficiencies, we can see that the backgrounds are suppressed obviously while the signal is still retained effectively after all the cuts. The cut efficiencies of the signal can reach 24.04%, 21.73%, and 17.23% for three signal benchmark points, respectively.
Table 2. Cut flows of the signal and backgrounds at the 3 TeV CLIC with g* = 0.2 and ${P}_{{e}^{-}}=-0.8,{P}_{{e}^{+}}=0$. |
| Cuts | Signal (ab) | Backgrounds (ab) | ||||
|---|---|---|---|---|---|---|
| T1400 | T1500 | T1600 | ${{tW}}^{-}\bar{b}$ | W+W−Z | W+W−H | |
| Cross section | 227.5 | 79 | 30 | 1700 | 270 | 66 |
| Trigger | 194.89 | 66.74 | 25.42 | 878.4 | 64.5 | 18.44 |
| Cut 1 | 140.38 | 47.02 | 15.49 | 512.2 | 61.8 | 13.50 |
| Cut 2 | 115.52 | 37.43 | 12.43 | 259.7 | 26.6 | 6.18 |
| Cut 3 | 100.92 | 31.85 | 10.35 | 99.4 | 5.52 | 3.16 |
| Cut 4 | 82.22 | 26.3 | 8.34 | 67.39 | 1.78 | 1.38 |
| Cut 5 | 60.52 | 19.18 | 5.81 | 8.56 | 1.27 | 1.14 |
| Cut 6 | 54.68 | 17.28 | 5.28 | 7.16 | 0.99 | 1.04 |
| Total efficiency | 24.04% | 21.73% | 17.23% | 0.42% | 0.37% | 1.58% |
5. Exclusion and discovery significance
After all the cuts, the signal is effectively preserved, but the number of signal events is relatively small. In this situation, we calculate the signal significance by the following Poisson formula [63]
$\begin{eqnarray}S=\sqrt{2L[({\sigma }_{S}+{\sigma }_{B})\mathrm{ln}\left(1+\displaystyle \frac{{\sigma }_{S}}{{\sigma }_{B}}\right)-{\sigma }_{S}]},\end{eqnarray}$
where L is the integrated luminosity and σS, σB are the signal and background cross sections after all cuts, respectively. Considering the experimental and theoretical limits, we use the package EasyScan_HEP [59] to scan the following parameter space $\begin{eqnarray*}{g}^{* }\in [0.05,0.3],\,\,\quad {m}_{T}\in [1000\,\mathrm{GeV},2500\,\mathrm{GeV}].\end{eqnarray*}$
In the calculations, we take the average cut efficiency 21% of the three signal benchmark points as uniform cut efficiency for all the signal parameter points. Then, we show the contour plots of exclusion and discovery capability on the g* − mT plane at 3 TeV CLIC in figure 4. In the case without ISR, we can see that the correlated regions g* ∈ [0.05, 0.23] with mT ∈ [1270, 1800] GeV(g* ∈ [0.05, 0.23] with mT ∈ [1270, 1550] GeV) can be excluded (discovery) for the integrated luminosity of 5000 fb−1. In the case with ISR, we adopt the same cut efficiency as the case without ISR since they have similar kinematic distributions of final states. We can see that the correlated regions g* ∈ [0.05, 0.23] with mT ∈ [1270, 1600] GeV (g* ∈ [0.05, 0.23] with mT ∈ [1270, 1500] GeV) can be excluded (discovery) for the integrated luminosity of 5000 fb−1. For the same integrated luminosity, we can see that the ISR effect will reduce the exclusion and discovery regions visibly at 3TeV CLIC. Combining the LHC and EWPO limits on the singlet T model, we can find that only when the mass mT > 2 TeV, do the width effects [60-62] of T need to be considered.
6. Summary
In this paper, we study the VLT via the ${e}^{+}{e}^{-}\to \bar{T}{W}^{+}b\to ({W}^{-}\bar{b})({W}^{+}b)$ process at CLIC with $\sqrt{s}=3$ TeV. We consider the current experimental limits including the EWPO, the top quark width measurements, and the LHC direct searches, and make a detailed detector simulation for the signal and backgrounds. According to the characteristics of the CLIC, we also consider the polarization and ISR effects of beams. After considering the current experimental limits, the exclusion and discovery region can be increased by at least 200 to 500 GeV and be summarized in table 3 with the luminosity ${ \mathcal L }=$ 5000 fb−1 and ${P}_{{e}^{-}}=-0.8$.
Table 3. Summary of exclusion and discovery regions. |
| CLIC @ 3 TeV with ${ \mathcal L }=$ 5000 fb−1 and ${P}_{{e}^{-}}=-0.8,{P}_{{e}^{+}}=0$ | ||||
|---|---|---|---|---|
| Exclusion regions | Discovery regions | |||
| g* | mT (GeV) | g* | mT (GeV) | |
| No-ISR | $\left[0.05,0.23\right]$ | $\left[1270,1800\right]$ | $\left[0.05,0.23\right]$ | $\left[1270,1550\right]$ |
| With-ISR | $\left[0.05,0.23\right]$ | $\left[1270,1600\right]$ | $\left[0.05,0.23\right]$ | $\left[1270,1500\right]$ |
A large number of studies with regard to searches for T on future colliders are investigated in [37, 64-70], where the results are listed in table 4 for comparison. From this table, we can find that the exclusion (discovery) capability in this work is much better than that of the High-Luminosity Large Hadron Collider (HL-LHC) with 3000 fb−1 [63] for the region of g* < 0.2 (g* < 0.3) because of different search strategies. Note that compared with [37], we study the channel of T → Wb → jjb in addition. Finally, we hope that our results can provide a promising scheme to search for the VLT at the future high energy e+e− colliders.
Table 4. Comparison of results from searching for T at future colliders. |
| Collider | L/fb−1 | Decay | Excluding region | Discovery region | Reference | ||
|---|---|---|---|---|---|---|---|
| g* | mT GeV−1 | g* | mT GeV−1 | ||||
| 14 TeV HL-LHC | 3000 | T → W+b → l+νb | $\left[0.19,0.5\right]$ | $\left[1300,2420\right]$ | $\left[0.31,0.5\right]$ | $\left[1300,1910\right]$ | [63] |
| 3000 | T → tZ → bjjl+l− | $\left[0.085,0.5\right]$ | $\left[1000,1840\right]$ | $\left[0.15,0.5\right]$ | $\left[1000,1580\right]$ | [69] | |
| 3000 | T → tZ → l+νbl+l− | $\left[0.06,0.2\right]$ | $\left[900,1500\right]$ | $\left[0.1,0.42\right]$ | $\left[900,1500\right]$ | [67] | |
| 3000 | $T\to {tH}\to {l}^{+}\nu {{bl}}^{+}\nu {l}^{-}\bar{\nu }$ | $\left[0.06,0.2\right]$ | $\left[900,1500\right]$ | $\left[0.1,0.42\right]$ | $\left[900,1500\right]$ | [68] | |
| 3TeV CLIC | 5000 | T → W+b → l+νb | $\left[0.15,0.5\right]$ | $\left[1500,2650\right]$ | $\left[0.24,0.5\right]$ | $\left[1500,2450\right]$ | [37] |
| 5000 | T → tZ → bjjl+l− | $\left[0.26,0.5\right]$ | $\left[1300,2320\right]$ | $\left[0.4,0.5\right]$ | $\left[1300,1850\right]$ | [66] | |
| 5000 | $T\to {tZ}\to {bjj}\nu \bar{\nu }$ | $\left[0.21,0.5\right]$ | $\left[1300,2400\right]$ | $\left[0.35,0.5\right]$ | $\left[1300,2000\right]$ | [66] | |
| 5000 | T → W+b → jjb(l+νb) | $\left[0.05,0.23\right]$ | $\left[1270,1600\right]$ | $\left[0.05,0.23\right]$ | $\left[1270,1500\right]$ | this work | |