


1. Introduction
Magnetically tunable Feshbach resonances [1, 2] and photoassociation technology [3, 4] are widely used in the field of cold atom physics, which can realize cold diatomic molecules. The magnetically tunable Feshbach resonances bind a pair of atoms into molecules by adjusting the magnetic field, and the photoassociation technology excites the atomic pair to the molecular bound state by laser, which can be applied to both Bose gas and Fermi gas systems. Many activities in experiments have been focused primarily on converting ultracold atoms into ultracold molecules. Equivalent nuclear Bose atom pairs (133Cs2 [5], 23Na2 [6], 85Rb2 [7], 87Rb2 [8, 9]), equivalent nuclear Fermi atom pairs (40K2 [10–12], 6Li2 [13–15]), other heteronuclear Bose atom pairs (85Rb-87Rb [16], 41K-87Rb [17, 18], 85Rb-133Cs [19], 7Li-133Sc [20]), and other heteronuclear Fermi atom pairs (6Li-40K [21]) have been successfully converted into molecules in experiments. In particular, [22] reports the preparation of two-dimensional Bose–Einstein condensates (BECs) of spinning molecules by inducing pairing interactions in an atomic condensate near a g-wave Feshbach resonance. Considerable efforts have been devoted to improving the conversion efficiency [23, 24] and understanding the new physical properties of molecular BEC, such as long-range dipole interactions of polar molecules [25–27], collision chemical reactions [28, 29], ultra-solid states [30, 31] and so on.
Atom–molecular BEC system is a subject of great concern in the field of cold atoms and the nonlinearity of the system makes it show a wealth of physical phenomena. Research shows that the coupling strength between atoms and molecules has an important impact on the stability [32, 33], coherence [34, 35], phase separation [36], dynamics of matter waves [37], the prediction of the quantum phase transition between mixed atom–molecule and purely molecular condensates [38, 39] and so on. Moreover, depending on the physical system under consideration, the cloud shape of a molecular BEC in a disordered trap [40], 3D-quantized ring vortices in rotating coupled atom molecular BEC [41] and effects of molecular rotations on transition temperature and heat capacity [42] are recently investigated. The irregular oscillation [43] and chaotic dynamics [44] of BEC system with multi-component atom molecule coupling are also discussed.
We focus on the chaotic dynamics of a coupled three-level atom–molecular BEC system composed of one molecular mode and two atomic modes. We discuss the influence of atom–molecular coupling strength, intermolecular interaction and different initial states on the population difference of two atomic modes. For weak atom–molecular coupling strength, the minimum relative population difference can maintain the regularity and symmetry. The uniform and well-separated lines in spectral density and the regular orbits in phase space diagrams prove the existence of periodic motion. For strong coupling between molecular mode and atomic mode, the regularity and symmetry of the atomic mode minimum relative population difference are destroyed, and the chaotic and irregular oscillations can be seen from the spectral density and the phase space diagrams. The different effects of initial states on atomic population oscillations are revealed, where for more particles in the initial state of the molecular model, chaos appears in the larger parameter region of system dynamics. By discussing the influence of intermolecular interaction, we find that strong intermolecular interaction can suppress chaos caused by strong coupling of atomic and molecular modes.
2. Model and method
We consider a coupled three-level atom–molecular BEC system composed of one molecular mode and two atomic modes [45]. By adopting three-mode approximation(i.e. the spatial wave functions for all modes are fixed), ignoring atomic loss caused by three-body recombination, the system is governed by the following Gross–Pitaevskii (GP) equations [46]:
$\begin{eqnarray}\begin{array}{rcl}{\rm{i}}\displaystyle \frac{\partial {\psi }_{1}}{\partial t} & = & {\omega }_{1}{\psi }_{1}+{\gamma }_{11}| {\psi }_{1}{| }^{2}{\psi }_{1}+{\gamma }_{12}| {\psi }_{2}{| }^{2}{\psi }_{1}\\ & & +{\gamma }_{13}| {\psi }_{3}{| }^{2}{\psi }_{1}-J{\psi }_{2}-K{\psi }_{2}^{* }{\psi }_{3},\end{array}\end{eqnarray}$
$\begin{eqnarray}\begin{array}{rcl}{\rm{i}}\displaystyle \frac{\partial {\psi }_{2}}{\partial t} & = & {\omega }_{2}{\psi }_{2}+{\gamma }_{22}| {\psi }_{2}{| }^{2}{\psi }_{2}+{\gamma }_{12}| {\psi }_{1}{| }^{2}{\psi }_{2}\\ & & +{\gamma }_{23}| {\psi }_{3}{| }^{2}{\psi }_{2}-J{\psi }_{1}-K{\psi }_{1}^{* }{\psi }_{3},\end{array}\end{eqnarray}$
$\begin{eqnarray}\begin{array}{rcl}{\rm{i}}\displaystyle \frac{\partial {\psi }_{3}}{\partial t} & = & {\omega }_{3}{\psi }_{3}+{\gamma }_{33}| {\psi }_{3}{| }^{2}{\psi }_{3}+{\gamma }_{13}| {\psi }_{1}{| }^{2}{\psi }_{3}\\ & & +{\gamma }_{23}| {\psi }_{2}{| }^{2}{\psi }_{3}-K{\psi }_{1}{\psi }_{2},\end{array}\end{eqnarray}$
where ψ1, ψ2 denote the wave functions of two atomic modes and ψ3 is one molecular mode. ωj is the zero-point energy in the mode j; γjl(j, l = 1, 2, 3, j ≤ l) describes the interaction strength between mode j and mode l; J is the tunneling strength between the two atomic modes, and K represents the atom–molecule coupling. The total number of particles in the system is conserved, namely, ∣ψ1∣2 + ∣ψ2∣2 + 2∣ψ3∣2 = 1. For convenience, we focus on the symmetric interactions between atomic modes γ11 = γ12 = γ22 and zero interaction between atoms and molecules γ13 = γ23 = 0. The zero-point energy ωj in the mode j obeys ω1 = ω2 = ω and ω3 = 0.3. The effect of atom–molecular coupling on dynamics
In this section, we explore how the atom–molecular coupling K affects the dynamics of the system. The weak coupling (K = 0.001) and strong coupling (K = 1) are discussed, respectively. We set J = 1 and starting from the initial state ${\psi }_{\mathrm{int}}^{i}=[{\psi }_{1}(0),{\psi }_{2}(0),{\psi }_{3}(0)]=(\sqrt{2}/10,0,7/10)$. The evolution of the normalized atom imbalance
$\begin{eqnarray}{\rho }_{a}(t)=\displaystyle \frac{| {\psi }_{1}(t){| }^{2}-| {\psi }_{2}(t){| }^{2}}{| {\psi }_{1}(t){| }^{2}+| {\psi }_{2}(t){| }^{2}}\end{eqnarray}$
is calculated. And the minimal imbalance $\begin{eqnarray}{\rho }_{a}^{\min }={\min }_{t}[{\rho }_{a}(t)]\end{eqnarray}$
is a witness of self-trapping: a value ${\rho }_{a}^{\min }\simeq -1$ indicates an oscillating dynamics where atoms initially in component one eventually tunneled to component two, while the imbalance remains locked around ${\rho }_{a}^{\min }\simeq 1$, when self-trapping dominates the dynamics.In order to further study the dynamic properties of the system, we will calculate the spectral density and the Poincaré sections. The mathematical expression of atom spectral density gα(ν, γ) is
$\begin{eqnarray}{g}_{\alpha }(\nu ,\gamma )=\displaystyle \frac{| {f}_{1}(\nu ,\gamma ){| }^{2}+| {f}_{2}(\nu ,\gamma ){| }^{2}}{{{\rm{\Sigma }}}_{\nu }\left[| {f}_{1}(\nu ,\gamma ){| }^{2}+| {f}_{2}(\nu ,\gamma ){| }^{2}\right]}.\end{eqnarray}$
Here fj(ν) is the Fourier transform of ψj(t) for j = 1, 2. If the spectral density is composed of a finite number of separate lines, the system dynamics only includes a finite number of frequencies, indicating the presence of periodic or quasi-periodic motion. If the spectral density contains a lot of frequencies, it means that the dynamics of the system is in a chaotic state. The Poincaré section is also a widely recognized method to judge whether the system exhibits periodic motion. If there is only one or several discrete points on the section, the system exhibits periodic motion; if there is a closed curve on the section, it means that the system exhibits quasi-periodic motion; if there are patches of dense points or hierarchical structures on the section, it indicates the emergence of chaos.3.1. Weak coupling
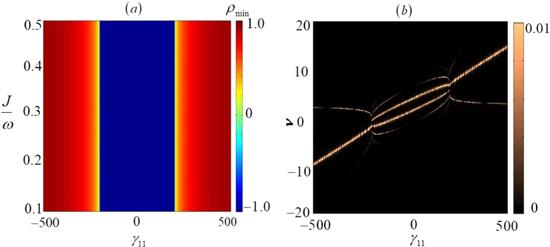
Considering weak atom–molecular coupling strength K =0.001 and molecular–molecular interaction strength γ33 = 0 and starting from the initial state ${\psi }_{\mathrm{int}}^{i}$, we show the diagram of ${\rho }_{a}^{\min }$ with the relative coupling J/ω and atomic interaction strength γ11 in figure 1(a). The blue region with ${\rho }_{a}^{\min }\simeq -1$ indicates that the atoms can transfer from one component to another corresponding to the Rabi oscillations and the red region with ${\rho }_{a}^{\min }\simeq 1$ means that the atoms are localized on one of the BEC components corresponding to the macroscopic quantum self-trapping (MQST). Figure 1(a) is similar to the traditional two-component atomic BEC system. When ∣γ11∣ increases to a critical value $| {\gamma }_{11}^{\min }| $, the system changes from Rabi oscillation to MQST and maintains good symmetry in the parameter regions of γ11 > 0 and γ11 < 0. We plot the spectral density in figure 1(b) for fixed J/ω = 0.25. It can be seen that for any γ11, the spectral density corresponds to a limited number of values, which shows that the system is the quasi-periodic motion. To better understand the dynamics, we also plot the phase space diagrams on plane (ρa, Δθa) in figure 1(c) with γ11 = −350 and in figure 1(d) with γ11 = 350 for fixed J/ω = 0.25 and K = 0.001, where Δθa is the phase difference between two atomic modes. The initial population differences are taken as ∣ψ1(0)∣2 − ∣ψ2(0)∣2 ∈ [−2/100, 2/100] with fixed particle number density of molecular mode ∣ψ3(0)∣2 = 49/100. Clearly, the phase space consists of regular orbits corresponding to the quasi-periodic or periodic collapses and the system will exhibit Rabi oscillations and MQST for suitable initial states. Taking the initial state ${\psi }_{\mathrm{int}}^{i}$, we plot the evolution of the normalized population imbalance ρa(t) in figure 2(a) with atomic interaction strength γ11 = −150 and in figure 2(b) with γ11 = −350 for fixed J/ω = 0.25 and K = 0.001. Clearly, the periodic Rabi oscillations appear in figure 2(a) for parameters J/ω and γ11 selected in the Rabi collapse region of figure 1(a). Figure 2(b) exhibits the MQST for parameters J/ω and γ11 selected in the MQST region of figure 1(a) and the regular oscillations also appear.
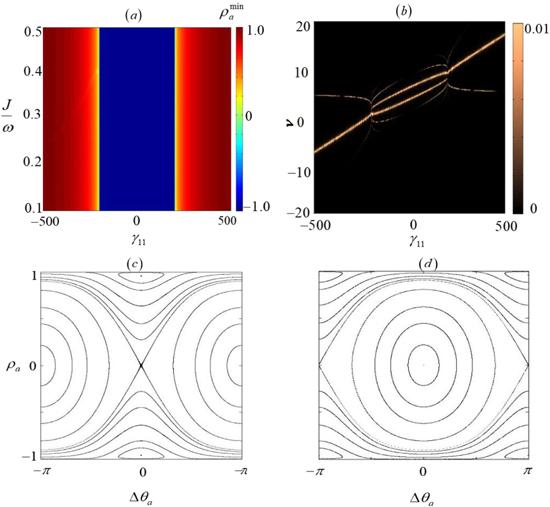
Figure 1. (a) The diagram of ${\rho }_{a}^{\min }$ as functions of relative coupling J/ω and atomic interaction strength γ11. (b) Spectral density at J/ω = 0.25. Phase space diagrams on plane (ρa, Δθa) in (c) with γ11 = −350 and in (d) with γ11 = 350. The atom–molecular coupling strength, molecular–molecular interaction strength and initial state are taken as K = 0.001, γ33 = 0 and ${\psi }_{\mathrm{int}}^{i}$. |
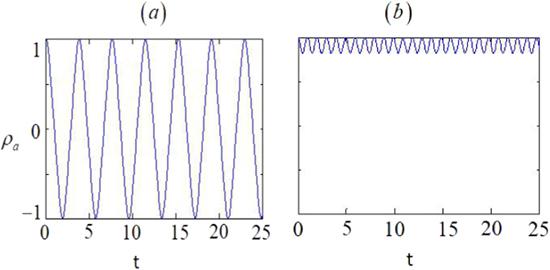
Figure 2. The evolution of the normalized population imbalance ρa(t) in (a) with atomic interaction strength γ11 = −350 and in (b) with γ11 = 350 for fixed J/ω = 0.25, K = 1.5, γ33 = 0 and same initial state ${\psi }_{\mathrm{int}}^{i}$. |
3.2. Strong coupling
We consider the strong coupling regime (K = 1.5) and numerically investigate the effect of atom–molecular coupling strength on atomic population balance. Starting from the same initial state ${\psi }_{\mathrm{int}}^{i}$, we show the diagram of ${\rho }_{a}^{\min }$ with the relative coupling J/ω and atomic interaction strength γ11 in figure 3(a), which has changed a lot compared with the weak coupling case. Clearly, the symmetry of the parameter region about γ11 = 0 is broken. For the case of interaction strength greater than zero (positive γ11), the boundary of MQST transition is tilted and the transition happens at multiple critical parameter values ${\gamma }_{11}^{\mathrm{critical}}$. For case γ11 < 0, irregular parameter regions of ${\rho }_{a}^{\min }\simeq -1$ and ${\rho }_{a}^{\min }\simeq 1$ appear. As the parameter J/ω increases from zero, there exist Rabi oscillation regions (${\rho }_{a}^{\min }\simeq -1$) in the original MQST region. We find that these regions do not necessarily correspond to Rabi oscillations, but may also contain chaos. Next, we will prove the emergence of chaos by plotting the spectral density with the fixed J/ω = 0.25 as shown in figure 3(b). For positive γ11, the spectral density contains only a finite number of frequencies, so the motion is periodic or quasi-periodic. The spectral density in the two-parameter regions of γ11 < 0 contains a large number of frequencies which is an indicator of the underlying chaotic dynamics, and the two-parameter regions are called chaotic regions. To obtain a more complete characterization of chaos, we also plot the phase space diagrams on plane (ρa, Δθa) in figure 3(c) with γ11 = −350 and in figure 3(d) with γ11 = 350 for fixed J/ω = 0.25 and K = 1.5. The initial population differences are taken as ∣ψ1(0)∣2 − ∣ψ2(0)∣2 ∈ [−2/100, 2/100]. Clearly, figure 3(c) shows deformed tori coexisting with chaotic orbits, but for positive γ11, these tori correspond to the quasi-periodic motion [figure 3(d)]. Taking parameters K = 1.5 and J/ω = 0.25 and initial state ${\psi }_{\mathrm{int}}^{i}$ which are the same as those of figure 3(b), we choose interaction strength γ11 = −350 localized in the chaotic region of figure 3(b), and show the time evolution of the population balance ρa in figure 4(a) where the chaotic and aperiodic evolutions are observed. Figure 4(b) shows the periodic collapses and MQST for γ11 = 350 localized in the regular region of figure 3(b).
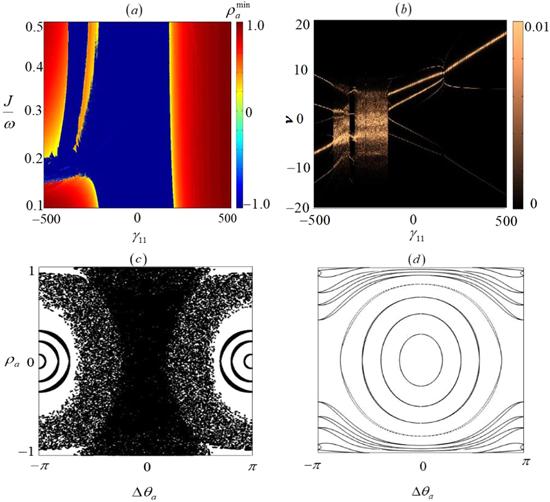
Figure 3. (a) The diagram of ${\rho }_{a}^{\min }$ as functions of relative coupling J/ω and atomic interaction strength γ11 with fixed atom–molecular coupling strength K = 1.5 and initial state ${\psi }_{\mathrm{int}}^{i}$. (b) Spectral density for fixed J/ω = 0.25. Phase space diagrams on plane (ρa, Δθa) in (c) with γ11 = −350 and in (d) with γ11 = 350. |

Figure 4. The evolution of the normalized population imbalance ρa(t) in (a) with atomic interaction strength γ11 = −150 and in (b) with γ11 = −350 for fixed J/ω = 0.25, K = 0.001 and same initial state ${\psi }_{\mathrm{int}}^{i}$. |
4. The effect of initial state on population balance
We fix the coupling strength K = 1 between atoms and molecules and study the influence of different initial states on population balance. The first initial state is ${\psi }_{\mathrm{int}}^{i}=[{\psi }_{1}(0),{\psi }_{2}(0),{\psi }_{3}(0)]=(\sqrt{2}/10,0,7/10)$, where most particles in the system are in molecular mode. The second initial state is ${\psi }_{\mathrm{int}}^{{ii}}=[{\psi }_{1}(0),{\psi }_{2}(0),{\psi }_{3}(0)]=(7\sqrt{2}/10,0,1/10)$, where the characteristic of this initial state is that most particles are in atomic mode at the initial time and the proportion of particles in molecular mode is very small. Starting from initial state ${\psi }_{\mathrm{int}}^{{ii}}$, we show the diagram of ${\rho }_{a}^{\min }$ with the relative coupling J/ω and atomic interaction strength γ11 in figure 5(a). We can see that when γ11 > 0, the occurrence of MQST has a definite boundary parameter value ${\gamma }_{11}^{\mathrm{critical}};$ while the boundary of the MQST transition region is uneven and irregular for γ11 < 0. Figure 5(b) is the diagram of ${\rho }_{a}^{\min }$ starting from the initial state ${\psi }_{\mathrm{int}}^{i}$. The MQST transition happens at multiple critical parameter values ${\gamma }_{11}^{\mathrm{critical}}$ for positive γ11. More interesting is the behavior for negative γ11. The boundary of MQST transition is more irregular and around this boundary, strong irregular oscillations of ${\rho }_{a}^{\min }$ will be observed. To better understand the dynamics in this parameter region, we also plot the spectral density at fixed J/ω = 0.25 for initial state ${\psi }_{\mathrm{int}}^{{ii}}$ in figure 5(c) and ${\psi }_{\mathrm{int}}^{i}$ in figure 5(d). Clearly, the presence of chaos occurs in the system under certain parameters, and the system starting from initial state ${\psi }_{\mathrm{int}}^{i}$ appears chaos in a wider parameter region. To sum up, as more particles in the initial state are distributed in the molecular mode, in the diagram of ${\rho }_{a}^{\min }$ the parameter region of ${\rho }_{a}^{\min }\simeq -1$ is obviously expanded and the system shows chaos in a larger parameter range.
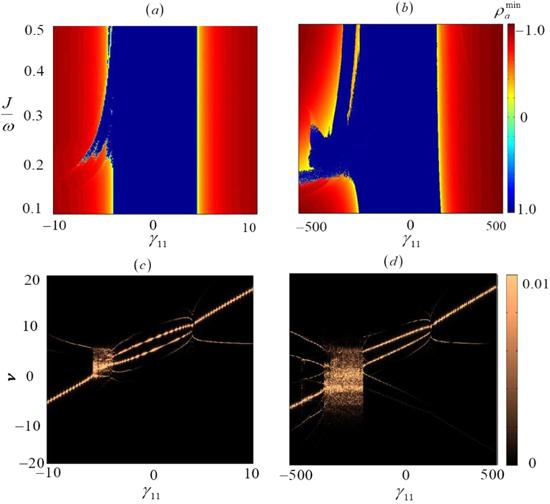
Figure 5. ${\rho }_{a}^{\min }$ versus relative coupling J/ω and atomic interaction strength γ11 for initial state (a) ${\psi }_{\mathrm{int}}^{{ii}}=[{\psi }_{1}(0),{\psi }_{2}(0),{\psi }_{3}(0)]\,=(7\sqrt{2}/10,0,1/10)$ and (b) ${\psi }_{\mathrm{int}}^{i}=[{\psi }_{1}(0),{\psi }_{2}(0),{\psi }_{3}(0)]=(\sqrt{2}/10,0,7/10)$. Spectral densities at J/ω = 0.25 for ${\psi }_{\mathrm{int}}^{{ii}}$ (c) and ${\psi }_{\mathrm{int}}^{i}$ (d). The atom–molecular coupling strength and molecular–molecular interaction strength are fixed as K = 1 and γ33 = 10. |
5. The effect of molecular–molecular interaction strength on population balance
We consider the influence of molecular–molecular interaction strength on the system dynamics. Taking the initial state ${\psi }_{\mathrm{int}}^{i}$ as an example, the effects of weak and strong molecular–molecular interaction strengths on the system are discussed respectively with fixed atom–molecular coupling strength K = 1.
In figure 6(a), we plot ${\rho }_{a}^{\min }$ on plane (J/ω, γ11) for weak molecular–molecular interaction strength γ33 = 10. Clearly, the boundary of MQST transition is more irregular, which indicates that the system will show chaotic behavior in some parameter regions. Figure 6(b) is the spectral density at J/ω = 0.5 which also proves the existence of chaos. When the strength of molecular–molecular interaction increases to γ33 = 400, that is the case of strong interaction, it is interesting that ${\rho }_{a}^{\min }$ on plane (J/ω, γ11) has good symmetry and the dynamics return to periodic or quasi-periodic motion as shown in figure 7(a). This figure indicates that the strong interaction between molecules can effectively suppress the emergence of chaos. It is difficult for atom–molecule conversion to occur in the system, and their dynamic evolution is relatively independent which indicates that presence of chaos will not appear. Figure 7(b) is the spectral density at J/ω = 0.5 and shows uniform and well-separated lines, indicating that the dynamics are dominated by only a few frequencies. Results show that system is in periodic or quasi-periodic motion.

Figure 6. (a) ${\rho }_{a}^{\min }$ versus J/ω and γ11 for weak molecular–molecular interaction strength γ33 = 10. (b) Spectral density at J/ω = 0.5. The initial state and atom–molecular coupling strength are taken as ${\psi }_{\mathrm{int}}^{i}$ and K = 1. |
Figure 7. (a) ${\rho }_{a}^{\min }$ versus J/ω and γ11 for strong molecular–molecular interaction strength γ33 = 400. (b) Spectral density at J/ω = 0.5. The initial state and atom–molecular coupling strength are taken as ${\psi }_{\mathrm{int}}^{i}$ and K = 1. |
6. Conclusions and discussions
Based on the mean-field method, we study the influence of molecular modes on system dynamics in an atom–molecule BEC system and mainly show the change of system dynamics by calculating the minimum relative population difference ${\rho }_{a}^{\min }$ of atomic modes changing with the atomic interaction strength γ11 and zero-point energy ω. When the coupling between molecular mode and atomic mode is weak, the minimum relative population difference image of atomic mode can maintain the same regularity and symmetry as that without molecular mode, and the system dynamics is in periodic or quasi-periodic motion state. When the molecular mode is strongly coupled with the atomic mode, the regularity and symmetry of the atomic mode minimum relative population difference image are destroyed. It can be seen from the spectral density and the phase space diagrams that the strong coupling between the molecule and atomic modes makes the system show chaotic behavior in a certain parameter region. Through the study of the dynamic evolution of different initial states, we find that for the initial state with more particles in the molecular mode, the system dynamics appear chaotic in the larger parameter region. By discussing the influence of intermolecular interaction, we find that strong intermolecular interaction can suppress chaos caused by strong coupling of atomic and molecular modes. Due to the strong interaction between molecules, the conversion between atomic and molecular modes becomes difficult, which enables atoms and molecules to carry out dynamic evolution relatively independently and the system will not appear chaotic behavior.