


1. Introduction
In addition to the classical Watson–Crick duplex, a variety of non-canonical DNA structures, such as hairpin, triplex, and quadruplex, exist in different biological processes [1–4]. DNA hairpin structures are usually formed by self-complementary sequences of single-stranded DNA during replication, DNA repair, and viral infection, so nucleic acid hairpins are used as a powerful model system for understanding macromolecular folding [5–8]. The kinetics and thermodynamics of the folding transition for individual DNA hairpins of varying stem lengths, loop lengths, and stem GC contents were systematically studied by a single-molecule experiment, which measured 20 different hairpin sequences with quasi-random stem sequences that were 6–30 bp long, polythymidine loops that were 3–30 nt long, and stem GC content that ranged from 0% to 100% [9]. For all the hairpins studied, folding and unfolding were characterized by a single transition, and the opening distance increased roughly linearly with stem length and loop length but varied a little with GC content. The unfolding force increased nonlinearly with stem length, decreased with increasing loop length, and increased linearly with stem GC content. The unfolding free energy depended only on the properties of the stem, rising linearly with both stem length and GC content but varying a little with loop length. The unloaded unfolding rate decreased exponentially with increasing stem length and GC content but was insensitive to loop length. The unfolding lifetime at critical force varied roughly exponentially with both stem length and loop length but was about 100 times more sensitive to loop length, rising by approximately five orders of magnitude. Finally, the position of the energy barrier was located roughly midway between folded and unfolded states for short hairpins but remained close to the unfolded state for long hairpins, never moving ≥6 nm away. As the loop length increased, the barrier maintained a constant distance from the folded state. As the GC content was varied, the barrier distance was constant from both the folded and unfolded states.
In addition, the manipulation of a DNA hairpin by optical tweezers accurately detected the sequence-dependent folding landscape of a DNA hairpin, including the transition-state position and the barrier height [9–13]. The transition-state position was dependent on the position of the block of GC base pairs in the stem of the DNA hairpin and was systematically manipulated by moving the block of GC base pairs to various locations within the stem [14]. The barrier height was altered by changing the overall GC content in the stem with the barrier positioned at the centre of the stem using a GC block. A local potential well could be produced by inserting a single TT mismatch at various positions along the hairpin stem, which prolonged the intermediate states, so that the intermediate states were observed more clearly between folded and unfolded states. The effects of single DNA mismatch on the stability of DNA hairpins have become the focus of recent single-molecule experiments. A single-molecule experiment was conducted using magnetic tweezers to understand the influence of single GT mismatched base pairs on the stability of AT-rich chromosomal fragile site (CFS) DNA hairpins, which tended to form on lagging strands in the DNA replication process and was related to chromosomal rearrangements in cancers [15–18]. A single GT mismatch placed at the centre of the stem reduced the stability of the AT-rich CFS DNA hairpin, but the intermediate state mentioned in reference [19] was not observed, which could be accounted for by the spatial resolution of magnetic tweezers, no better than $\sim \tfrac{10\,\mathrm{nm}}{\sqrt{\mathrm{Hz}}}$ [20], in comparison with optical tweezers [21]. However, another single-molecule experiment with optical tweezers also detected the single DNA mismatch in the stem of the DNA hairpin; both hopping and force-pulling experiments were performed to identify the kinetic rate as a function of stretching force, and similar results were obtained, that a single mismatch inserted in the stem of the DNA hairpin reduced the stability, but intermediate states were not reported [22].
Generally, the free energy ΔG for DNA hairpins at a given extension is related to its corresponding extension probability P(x), and the free energy landscape along the reaction coordinate is conceptually constructed by the relationship, ${\rm{\Delta }}G(x)=-{k}_{{\rm{B}}}T\mathrm{ln}[P(x)]$, but its application requires exceptional instrumental stability so that hundreds to thousands of transitions are sampled at a high bandwidth, and then accurate measurements of P(x) are obtained. In addition, the thermal and mechanical properties of the trapped beads smoothen and dampen the apparent motions of the hairpin attached to the ds-DNA handles so that the subtle differences in extension probability distributions and free energy landscape are not directly observed, and then a deconvolution process is adopted to recover the underlying extension probability distributions of DNA hairpins and free energy landscapes to sharpen the subtle differences [14].
Ox-DNA, as a successful coarse-grain model, could reproduce the thermodynamic and mechanical properties of both single- and double-stranded DNA and was extended to study the folded/unfolded process of DNA hairpins under different stretching forces. The simulation results were consistent with the single-molecule experiment results [23]. Different from the design in single-molecule experiments where the stretching forces were exerted on the DNA hairpin by ds-DNA handles, stretching forces in the current simulation directly acted on the two strands in the stem of the DNA hairpin. This simulation design guaranteed that enough transitions are sampled at high bandwidth and the apparent motions of the hairpin are not smoothened and dampened by the thermal and mechanical properties of the trapped beads attached to ds-DNA handles, thus the subtle differences in extension probability distributions and free energy landscapes can be directly detected. In the current work, the simulation design based on ox-DNA was adopted to study the effects of a single DNA mismatch on the folded/unfolded process of the DNA hairpin, especially to identify the intermediate state caused by the single DNA mismatch and its dependence on the position of the single mismatch in the stem.
2. Materials and methods
2.1. DNA hairpin structure design
In current simulations, DNA hairpins with different stem lengths ranging from 12 base pairs to 20 base pairs and 4T in the loop were adopted to demonstrate the folded/unfolded transition. To make the sequence design consistent with a recent single-molecule experiment, the sequence in the stem of the DNA hairpin was mainly composed of AT base pairs, including one GC base pair. The sequences of a DNA hairpin with 15 base pairs in its stem are listed in table 1. All the sequences are separately indexed by (0)–(15), which indicates the position of DNA mismatch in the stem with the hairpin loop set as a reference point. The sequence indexed by (0) represents a hairpin structure without DNA mismatch in its stem, and the one indexed by (n) indicates that the original GC base pair at position n from the hairpin loop is replaced by a mismatched base pair G:T. For instance, the stem of the DNA hairpin in figure 1(a) is composed of 12 base pairs, including 11 AT base pairs and one GC base pair, as a comparison, for the DNA hairpin in figure 1(b), the original GC base pair at position 8 from the hairpin loop is replaced by a mismatch G:T.
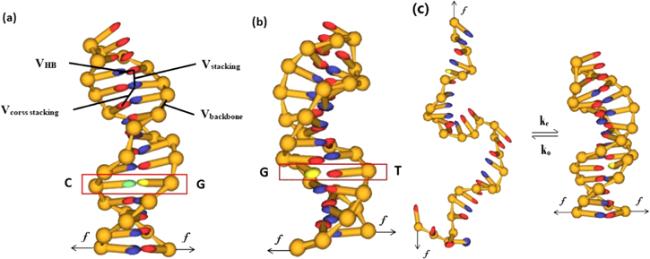
Figure 1. Illustration of the hairpin structure in the ox-DNA model and dynamic transition of the DNA hairpin structure under a stretching force. (a) DNA hairpin with 11 AT base pairs and one GC base pair in the stem and 4T bases in the loop. (b) The GC base pair in the stem of the DNA hairpin is replaced by a G:T mismatch. (c) The folded/unfolded transition of the DNA hairpin structure with a G:T mismatch in its stem under a stretching force. |
Table 1. Different sequences of DNA hairpin with 15 base pairs in the stem. Sequence indexed by (0) represents the DNA hairpin without a DNA mismatch in the stem, as a comparison, the sequence indexed by (n) indicates that the original GC base pair at position n from the hairpin loop is replaced by DNA mismatch G:T. |
| Index | Sequence |
|---|---|
| (0) | $5^{\prime} $-T4 AATATTAAA G TATAA T4 TTATA C TTTAATATT T4-$3^{\prime} $ |
| (1) | $5^{\prime} $-T4 AATATTAAATTATA G T4 T TATAATTTAATATT T4-$3^{\prime} $ |
| (2) | $5^{\prime} $-T4 AATATTAAATTAT G A T4 T T ATAATTTAATATT T4-$3^{\prime} $ |
| (3) | $5^{\prime} $-T4 AATATTAAATTA G AA T4 TT T TAATTTAATATT T4-$3^{\prime} $ |
| (4) | $5^{\prime} $-T4 AATATTAAATT G TAA T4 TTA T AATTTAATATT T4-$3^{\prime} $ |
| (5) | $5^{\prime} $-T4 AATATTAAAT G ATAA T4 TTAT T ATTTAATATT T4-$3^{\prime} $ |
| (6) | $5^{\prime} $-T4 AATATTAAA G TATAA T4 TTATA T TTTAATATT T4-$3^{\prime} $ |
| (7) | $5^{\prime} $-T4 AATATTAA G TTATAA T4 TTATAA T TTAATATT T4-$3^{\prime} $ |
| (8) | $5^{\prime} $-T4 AATATTA G ATTATAA T4 TTATAAT T TAATATT T4-$3^{\prime} $ |
| (9) | $5^{\prime} $-T4 AATATT G AATTATAA T4 TTATAATT T AATATT T4-$3^{\prime} $ |
| (10) | $5^{\prime} $-T4 AATAT G AAATTATAA T4 TTATAATTT T ATATT T4-$3^{\prime} $ |
| (11) | $5^{\prime} $-T4AATA G TAAATTATAA T4 TTATAATTTA T TATT T4-$3^{\prime} $ |
| (12) | $5^{\prime} $-T4 AAT G TTAAATTATAA T4 TTATAATTTAA T ATT T4-$3^{\prime} $ |
| (13) | $5^{\prime} $-T4 AA G ATTAAATTATAA T4 TTATAATTTAAT T TT T4-$3^{\prime} $ |
| (14) | $5^{\prime} $-T4 A G TATTAAATTATAA T4 TTATAATTTAATA T T T4-$3^{\prime} $ |
| (15) | $5^{\prime} $-T4 G ATATTAAATTATAA T4 TTATAATTTAATAT T T4-$3^{\prime} $ |
All the DNA hairpins, constructed based on the ox-DNA model, capture the most relevant interactions in DNA, such as the backbone connectivity (Vbb), excluded volume, hydrogen bonding between Watson–Crick complementary base pairs (VHB), stacking between adjacent base pairs along the chain (Vstack), and cross stacking (Vcrossstack) [24–28]. Backbone connectivity is expressed by finitely extensible nonlinear elastic (FENE) springs and acts as a soft repulsion centre to reproduce steric interactions [24–28]. The attractive interactions in the model are not isotropic, depending on the relative orientation of the nucleotides. These angular modulations ensure the formation of the right-handed DNA helix and the pairs in an anti-parallel manner. The complete form of all potentials is available in the references [24–28]. The ox-DNA does not model the electrostatics explicitly, but the potential parameters for the salt concentration of 0.5M can be fitted reasonably; its corresponding Debye screening length is short-ranged so that the electrostatic interaction can be incorporated into a soft excluded volume. In addition, major and minor groovings are not considered.
The original GC base pair in the stem is replaced by a mismatched G:T base pair to identify the effects of single DNA mismatch and its position in the stem on the folded/unfolded transition, especially the intermediate state, and then the subtle differences in free energy landscape constructed according to the extension probability distributions of DNA hairpin. The dynamic simulations are carried out under different stretching forces at temperatures from 300 to 320 K. The folded/unfolded transition is shown in figure 1(c). During the dynamic simulation processes, the mass, energy, and length units are set as m0 = 315.75 Da, ε0 = 4.142 × 10⁻²⁰ J and l0 = 8.518 Å, respectively, which together determine the time unit as ${\tau }_{0}={\left({m}_{0}{l}_{0}^{2}/{\epsilon }_{0}\right)}^{-\tfrac{1}{2}}$. The evolution of the system is realized by solving Newton's equation of motion using the velocity Verlet algorithm, and then the velocities and angular velocities of each particle are updated from the Maxwell–Boltzmann distribution at each temperature. The brute-force closing simulations as well as the forward flux sampling are performed to study the kinetics of hairpin formation. The forward flux sampling, as a rare event method, is especially used to accelerate the kinetic measurements [26].
3. Results
3.1. Effects of single base-pair mismatch on DNA hairpin stability
The dynamic processes of a DNA hairpin with a 15-base-pair stem were systematically investigated and recorded in figure 2, in which (a)–(e) demonstrate the two-state transition of the DNA hairpin with sequence (0). At a constant stretching force, the extension of the DNA hairpin shows two distinct states of the DNA hairpin, with long extension representing the unfolded state and short extension representing the folded state. The extension histogram (P) in the right panel shows two clear peaks with a separation of about 12 nm, corresponding to the extension difference of the folded hairpin and unfolded ssDNA at the stretching force. With the increasing stretching force from 5.84 to 7.30 pN, the DNA hairpin stays more time at unfolded state. At the stretching force of about 6.57 pN, where the DNA hairpin occupies the unfolded state and folded state with roughly equal probabilities. At the same time, the dynamic processes of the DNA hairpin with sequence (6) are also studied at the same temperature of 310 K, and its dynamic process under different stretching forces, shown in figures 2(f)–(j), is similar to those of DNA hairpins with sequence (0), but the stretching forces, including a stretching force of about 4.13 pN, at which the DNA hairpin stays in unfolded and folded states with roughly equal probability, are obviously smaller than those applied on the DNA hairpin with sequence (0).
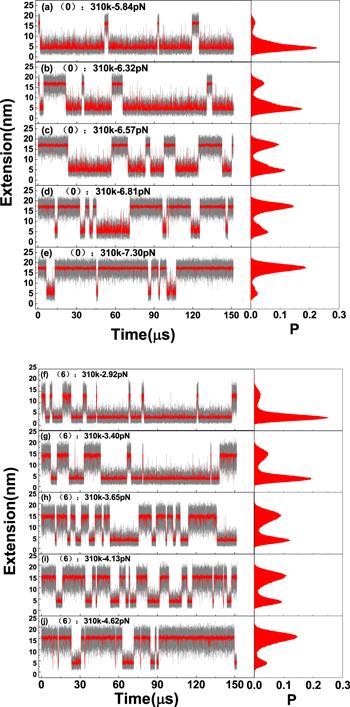
Figure 2. Dynamics of a DNA hairpin with 15 base pairs in the stem at a constant temperature of 310 K and their extension probability distributions in the right panel. (a)–(e), dynamics of a DNA hairpin with sequence (0) under stretching forces from 5.84 to 7.30 pN; (f)–(j), dynamics of a DNA hairpin with sequence (6) under stretching forces from 2.92 to 4.62 pN. |
According to the relation G = −kBTlnP, the free energy landscape of the folded/unfolded transition of the DNA hairpin can be drawn from the extension histogram (P) in the right panel of figures 2(a)–(j). As shown in figure 3(a), the free energy landscape has two local free-energy minimal, separately corresponding to the folded and unfolded state from the left-handed to the right-handed side of the transition state. As pointed out in Bell's model [29–31], these two states can transfer to each other by crossing the transition state with the force-dependent unfolded rate ${k}_{{\rm{o}}}(f)={k}_{{\rm{o}}}^{0}\exp ({{fx}}_{{\rm{o}}}/{k}_{{\rm{B}}}T)$ and folded rate ${k}_{{\rm{c}}}(f)={k}_{{\rm{c}}}^{0}\exp (-{{fx}}_{{\rm{c}}}/{k}_{{\rm{B}}}T)$, where xc and xo are the distances to the transition state from the folded and unfolded states, respectively, and their sum ΔX equals to the distance between folded and unfolded states, namely ΔX = xc + xo. Obviously, the introduction of DNA mismatch at position (6) from the loop makes the transition state in the free energy landscape shift left and results in the changing of xc and xo as shown in figures 3(b)–(c). The distance to the transition state from the folded state xo for a DNA hairpin with sequence (6) (figure 3(c)) is smaller than that for a DNA hairpin with sequence (0) (figure 3(b)). At the same time, the distance between the folded and unfolded states ΔX of the DNA hairpin with sequence (0) (figure 3(b)) is a little larger than that of the DNA hairpin with sequence (6) (figure 3(c)), which could be accounted for by the relatively large stretching force.
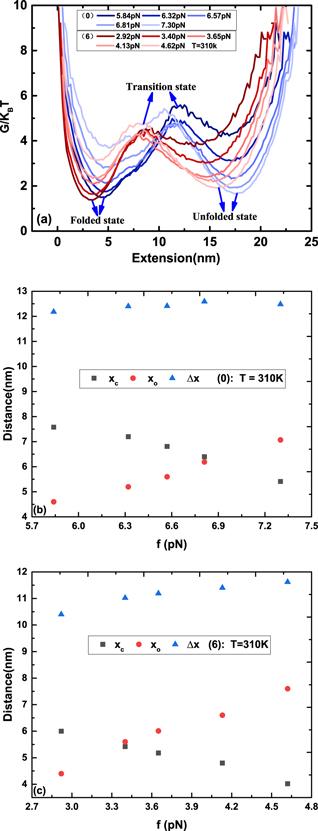
Figure 3. (a) The free energy landscape of DNA hairpins with sequences (0) and (6) under different stretching forces. (b)–(c) The distance to the transition state from the folded state (xc) and the unfolded state (xo) and the distance between folded and unfolded states (ΔX) as a function of stretching force f. (b) and (c) correspond to the sequences (0) and (6), respectively. |
The logarithm of the force-dependent folded rate and unfolded rate of DNA hairpins with different sequences can be drawn from their respective dynamics, such as those in figure 2, and can be fitted by a linear function of force, which agrees with Bell's model. Their cross point of unfolded and folded rates gives the equilibrium critical force fcrtical. As shown in figure 4(a), it provides the critical forces of DNA hairpins with sequences (0), (3), (8), and (13). The critical forces are obviously reduced by the introduction of DNA mismatch and depend on the position of DNA mismatch in the stem. When DNA mismatch is introduced at position (13) from the hairpin loop, the critical force is reduced to 4.82 pN from the critical force of a DNA hairpin with sequence (0), 6.64 pN. For the DNA hairpin with sequence (8), namely, the DNA mismatch in the middle of the stem, its critical force is reduced to 3.49 pN.
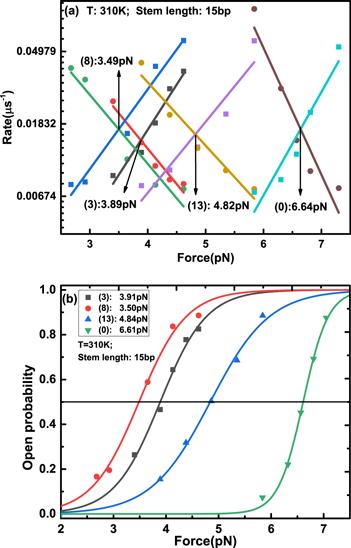
Figure 4. (a) Force-dependent folded rate and unfolded rate of DNA hairpins with different sequences. Their cross points give the critical forces. (b) Force-dependent open probability of DNA hairpins with different sequences. Fitting with the Boltzmann relationship gives the critical forces corresponding to the open probability of 50%, which are consistent with the analysis of the force-dependent folded and unfolded rates of the DNA hairpin in figure 4(a). |
The critical forces can be further qualified by the open probability of the DNA hairpin, which is defined as the percentage of time in the unfolded state. The open probability is force-dependent and can be expressed by the two-state Boltzmman equation ${P}_{o}(f)=\displaystyle \frac{{{\rm{e}}}^{-\tfrac{{F}_{o}}{{k}_{{\rm{B}}}T}}}{{{\rm{e}}}^{-\tfrac{{F}_{o}}{{k}_{{\rm{B}}}T}}+{{\rm{e}}}^{-\tfrac{{F}_{c}}{{k}_{{\rm{B}}}T}}}=\tfrac{1}{1+{{\rm{e}}}^{\tfrac{{\rm{\Delta }}F}{{k}_{{\rm{B}}}T}}}$, where Fc and Fo represent the free energy of the DNA hairpin in the folded and unfolded state, respectively; ΔF = Fo − Fc is the free-energy difference between unfolded and folded state and ${{\rm{e}}}^{-\tfrac{{F}_{i}}{{k}_{{\rm{B}}}T}}({i}={\rm{c}},{\rm{o}})$ is the Boltzmann statistical weight [23, 29]. At equilibrium, the free energy landscape at the critical force should be symmetric, namely, ΔF(f) = (fctitical − f)ΔX, so that the open probability Po(f) can be re-expressed as ${P}_{{\rm{o}}}(f)=\tfrac{1}{1 \ + \ {{\rm{e}}}\ ^{({f}_{\mathrm{critical}}-f){\rm{\Delta }} \ X/ \ {k}_ \ {{\rm{B}}} \ T}}$, and equals to 50% at the critical force. The two-state Boltzmman equation is used to fit the open probability obtained from current simulations and to identify the critical forces of the DNA hairpins with different sequences. As shown in figure 4(b), the critical forces of DNA hairpins with sequences (0), (13), (3) and (8) are 6.61 pN, 4.84 pN, 3.91 pN and 3.50 pN, respectively, which is reasonably consistent with the analysis of the force-dependent folded rate and unfolded rate of the DNA hairpin in figure 4(a).
3.2. Identification of the intermediate state caused by DNA mismatch
According to the above analysis for the DNA hairpin with 15 base pairs, the introduction of DNA mismatch at positions (1)–(8) and (13)–(15) definitely results in the reduction of the critical force and the instability of the DNA hairpin, but the intermediate states are not discovered in their extension probability distribution. As mentioned in the introduction, the instrumental artefacts in the folded/unfolded dynamics measured by single-molecule force spectroscopy could be overcome in the current simulations, so that the free energy landscapes corresponding to the extension distribution drawn from the dynamics process can be directly used to detect the intermediate state and sharpen its dependence on the position of DNA mismatch in the stem. The simulations of the DNA hairpins with sequences (9)–(11) are further carried out, as shown in figure 5(a); their extension probability distribution drawn from their dynamics process are compared with others of DNA hairpins with the sequences examined above and their corresponding free energy landscapes are listed in the right panel. Different from the extension probability distribution of the DNA hairpins with sequences (1)–(8) and (12)–(15), fitting of the extension probability distribution of the DNA hairpins with sequences (9)–(11) reveals three states: the unfolded, intermediate, and folded states, and the subtle changes corresponding to the intermediate state in free energy landscapes are also discovered, such as in the free energy landscape of the DNA hairpin with sequence (10), where the local minimum corresponding to the intermediate state is located between two transition states. In contrast, when DNA mismatch is placed at positions of (1)–(8) and (12)–(15), their extension probability distribution has two peaks, indicative of folded and unfolded states, and their corresponding free energy landscape only has a transition state.
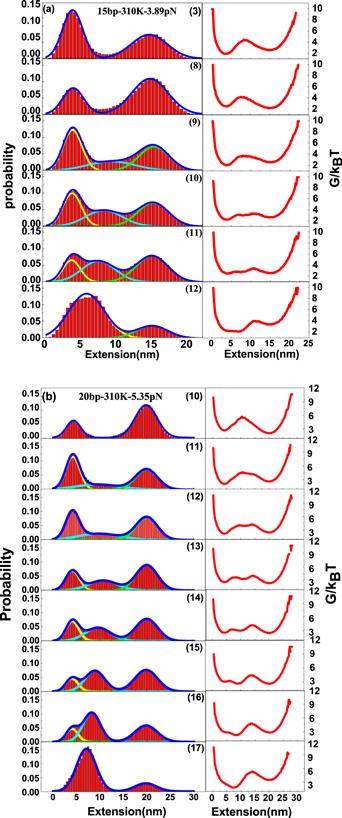
Figure 5. Fitting extension probability distribution of the DNA hairpin with DNA mismatch in the stem and their corresponding free energy landscapes in the right panel. (a) Fitting extension probability distribution of the DNA hairpin with 15 base pairs in the stem. The position of DNA mismatch in the stem ranges from position (3) to (12). (b) Fitting extension probability distribution of the DNA hairpin with 20 base pairs in the stem and the position of DNA mismatch in stem ranges from position (10) to (17). |
The results for the DNA hairpin with a stem of 15 base pairs indicate that the intermediate state is strongly dependent on the position of DNA mismatch in the stem and this rule is common for other DNA hairpins with different stem lengths, such as the results for the DNA hairpin with a stem of 20 base pairs listed in figure 5(b), where its extension probability distribution for the DNA hairpin with DNA mismatch at positions (11)–(16) also reveals the unfolded, intermediate, and folded states, and their free energy landscapes obviously have two transition states. When the DNA mismatch is located in other positions, their extension probability distribution has two peaks, indicating the unfolded state and the folded state, and their corresponding free energy landscapes obviously have a transition state.
The common rule for the dependence of an intermediate state on the position of DNA mismatch in the stem is further identified by constructing a phase diagram in the phase space of the scaled position of DNA mismatch (the position of DNA mismatch in the stem from the hairpin loop is scaled by its corresponding stem length, and the scaled position of DNA mismatch in the stem ranges from 0 to 1), as shown in figure 6. All the results of the DNA hairpin with a stem length ranging from 12 base pairs to 20 base pairs are generalized in this phase diagram. Obviously, the diagonal line in the phase diagram is composed of three segments, and the scaled position of DNA mismatch for the segment circled by the green dash line is in the range [0.55, 0.85), where the extension distribution of the DNA hairpin, similar to the fitting in the inset (II) of figure 6, obviously has three states, namely, the folded state, intermediate state, and unfolded state; As for that for the other segments circled by red and blue dash lines, which fall in the ranges of [0, 0.55) and [0.85, 1], respectively, where the extension distribution with two peaks could be compared with the one in the inset (I) of figure 6, and the intermediate state is not observed.
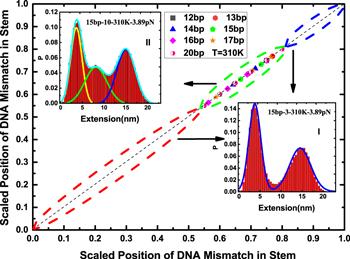
Figure 6. Phase diagram constructed in the phase space of the scaled position of DNA mismatch in the stem. The diagonal line in the phase diagram is divided into three segments, and the scaled position of DNA mismatch for the segment circled by a green dash line is in the range where the fitting of the extension histogram of the DNA hairpin is similar to the fitting in the inset (II) and has the folded state, intermediate state and unfolded state. As for those for the other sections circled by red and blue dash lines, they fell in the ranges where the extension histogram with two peaks could be compared with the one in the inset (I). The extension probability distribution in the insets (I) and (II) corresponds to the DNA hairpin with 15 base pairs in the stem and DNA mismatch is placed at positions (3) and (10), respectively. |
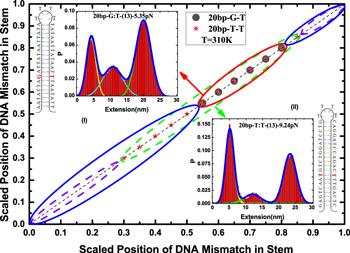
The intermediate state caused by DNA mismatch is also dependent on the sequence in the stem of a DNA hairpin. To further identify the effects of sequence in the stem of a DNA hairpin on the intermediate state, DNA hairpins with 20 base pairs in the stem composed of two different sequences are adopted to conduct simulations and both of which are separately used in two previous single-molecule experiments [14]. One sequence is mainly composed of AT base pairs and a G:T mismatch (shown in inset (I) of figure 7), which has been used in figure 6, and the other has 50% GC content and T:T mismatch in its stem (shown in inset (II) of figure 7) [19]. Their effects on the intermediate state are systematically compared in the phase diagram in figure 7, where the segments in the diagonal lines separately circled by blue solid and violet dash lines correspond to the extension distributions of the DNA hairpin with folded and unfolded states. The scaled positions of DNA mismatch for the segments separately circled by the red solid and green dash lines fall in the ranges [0.55, 0.85) and [0.3, 0.90), where the extension distribution of the DNA hairpin, as indicated by the insets (I) and (II) of figure 7, has three states, namely the folded, intermediate, and unfolded states. As the same time, the scaled position range corresponding to the extension distribution of DNA hairpin with three states is obviously extended by replacing the sequence in the inset (I) of figure 7 with the one in the inset (II) of figure 7.
Figure 7. Phase diagram constructed in the phase space of the scaled position of DNA mismatch in the stem with 20 base pairs. The DNA hairpins with different sequences in the stem are separately indicated in the insets (I) and (II), where the DNA mismatch is placed at the position (13), and the corresponding extension distributions have folded, intermediate, and unfolded states. The diagonal line for different sequences in the phase diagram is divided into three segments, the segments circled by solid and dash lines separately correspond to the sequences in the insets (I) and (II).The scaled positions of DNA mismatch for the segments circled by a red solid and green dash lines separately fall in the ranges [0.55,0.85) and [0.3,0.90), where the extension distributions of the DNA hairpin have the folded, intermediate, and unfolded states. Their corresponding scaled position ranges are obviously extended by replacing the sequence in the inset (I) with the one in the inset (II). |
4. Conclusions and discussions
In the current study, the extended ox-DNA model was applied to detect the intermediate state caused by DNA mismatch in the stem of the DNA hairpin and to identify its dependence on the position of DNA mismatch in the stem from the hairpin loop. DNA hairpins with different stem lengths ranging from 12 base pairs to 20 base pairs and 4T in the loop were adopted to carry out simulations, and the results indicated that the introduction to the stem of a DNA hairpin definitely results in the instability of the DNA hairpin, and the critical forces and the intermediate state are strongly dependent on the position of DNA mismatch in the stem from the hairpin loop. Most importantly, our current simulation protocols overcome the instrumental artefacts in the folded/unfolded dynamics measured by single-molecule force spectroscopy, so that the intermediate state in extension probability distributions and the subtle changes in free energy landscape caused by the intermediate state could be directly observed when a DNA mismatch is placed in a definite position in the stem from a hairpin loop. A common rule about the dependence of the intermediate state on the position of DNA mismatch is generalized in the phase diagram constructed in the phase space of the scaled position of DNA mismatch, and the three segments on the diagonal line of the phase diagram, separately circled by a red dash line, green dash line, and blue dash line, correspond to the ranges of the scaled position of the DNA mismatch [0, 0.55), [0.55, 0.85) and [0.85, 1], respectively. When the scaled position of a DNA mismatch falls in the [0.55, 0.85) range, its corresponding extension distribution has three obvious states, indicative of the unfolded, intermediate and folded states; in contrast, in the other ranges [0, 0.55) and [0.85, 1], the corresponding extension distribution has two states, namely the unfolded state and the folded state.
To the best of our knowledge, three separate single-molecule experiments were successively conducted and the detection of the effects of a DNA mismatch on the stability of a DNA hairpin with different sequences was tried, but there was no consensus in the results of the intermediate state caused by the DNA mismatch [14, 19, 22]. One of them clearly pointed out that the intermediate state is found in the extension distribution of the DNA hairpin when the DNA mismatch is placed at position (13) from the hairpin loop of a DNA hairpin with 20 base pairs in the stem [14], and its scaled position of DNA mismatch (0.65) falls in the range [0.55, 0.85). In comparison, the results of the other experiments did not reveal the existence of an intermediate state in the extension distribution of the DNA hairpin. The stem lengths of the DNA hairpins used in the two single-molecule experiments are 19 base pairs and 20 base pairs, and the DNA mismatch is separately placed at the positions (9) [19] and (10) [22] from the hairpin loop so that their corresponding scaled positions of DNA mismatch are 0.4736 and 0.5, respectively, both of which distribute in the range [0, 0.55). Obviously, the simulations are totally consistent with the single-molecule experiment results. The common rule generalized in the phase diagram not only clarifies the non-consensus between the three successive single-molecule experiments but also highlights the design of single-molecule experiments in the future.