


1. Introduction
The study of the heavy quark parton distribution functions (PDFs) provides an important phenomenological and experimental tool as well as fundamental information to know the nucleon structure. The correct analysis of parton distributions of heavy quarks plays a key role in precision measurements in accelerators and they are a powerful means to explore the dynamics of the strong interactions described by perturbative quantum chromodynamics (QCD) and the Standard Model [1, 2]. Therefore, a precise description of heavy quarks PDF and their properties within QCD will improve knowledge of physics beyond the Standard Model. Since many hard processes within the Standard Model and beyond, are sensitive to the heavy quark content of the nucleon, heavy quark distribution functions play a significant role in the physics program of accelerators. The PDFs of the charm and bottom quarks and their evolution are important and essential inputs for the calculation of these processes within perturbative QCD.
The heavy quarks in a nucleon have either perturbative extrinsic or nonperturbative intrinsic origins. The intrinsic heavy quarks are nonperturbative and arise from the wave function of the nucleon, which even exists for scales below the heavy quark threshold. The intrinsic contributions to the heavy quark distributions of hadrons at high x correspond to Fock states such as $| {uudQ}\overline{Q}\rangle $ where the heavy quarks are multiply connected to valence quarks of the proton. Intrinsic heavy quarks are a fundamental property of the wave functions of hadronic bound states. While the extrinsic contributions to the heavy quark PDFs are important at low x and depend logarithmically on the heavy quark mass mq, the intrinsic heavy quark contributions are dominant at high x and depend on $\tfrac{1}{{m}_{q}^{2}}$. The PDF models with nonperturbative charm and bottom have been studied in CTEQ analysis and in other recent works [3–5]. In perturbative QCD, heavy quarks are generated from the PDFs of light partons (i.e. gluons and light quarks) in the process of the linear evolution equation of Dokshitzer-Gribov-Lipatov-Altarelli-Parisi (DGLAP) [6–9]. The DGLAP equation predicts a sharp growth of the gluon distribution function at small values of the Bjorken scaling variable x. This sharp growth in the small x region causes the violation of the Froissart-Martin bound and the unitarily of the cross section. At the small x values, recombination processes between gluons reduce the growth of the gluon distribution in this region. Gribov, Levin, Ryskin, Mueller and Qiu by adding the nonlinear terms modified the equations of parton evolution. The Gribov-Levin-Ryskin-Mueller-Qiu (GLR-MQ) equation predicts a saturation of the gluon distribution and screening effects at very low x [10, 11].
Zhu, Ruan and Shen rederived the QCD evolution equation with the parton recombination corrections because of the following motivations [12–15]: (1) the application of the Abramovsky-Gribov-Kancheli (AGK) cutting rules (these rules state the relation between the processes of multiparticle production and the total cross section at high energy) in the GLR-MQ corrections breaks evolution kernels; (2) momentum conservation is violated in the GLR-MQ correction to the DGLAP equation; (3) the double leading logarithmic approximation (DLLA, $\mathrm{ln}(\tfrac{1}{x})\mathrm{ln}({Q}^{2})\gg 1$) is valid at small x region and the GLR-MQ nonlinear corrections cannot smoothly connect with the DGLAP equation. Therefore, in the Gribov-Levin-Ryskin-Mueller-Qiu, Zhu-Ruan-Shen (GLR-MQ-ZRS) evolution equation using time ordered perturbation theory instead of the AGK cutting rules, the issue of gluon recombination is considered in the leading logarithmic (Q2) approximation and momentum conservation is established.
In the present paper, we plan to use the parametrization behavior of the gluon distribution function in the framework of the nonlinear GLR-MQ-ZRS evolution equation to study the behavior of heavy quark parton distribution in the small x region.
2. Method
The heavy quark distribution functions can be derived by solving the DGLAP evolution equation in the leading logarithm approximation as follows [16–18]1 ), the contribution of heavy quarks to the structure function of the proton is given by
$\begin{eqnarray}\begin{array}{l}Q(x,{\mu }^{2})=\frac{{\alpha }_{s}({\mu }^{2})}{2\pi }\mathrm{ln}\left(\frac{{\mu }^{2}}{{m}_{q}^{2}}\right)\\ \quad \times {\int }_{x}^{1}\frac{{\rm{d}}z}{{z}^{2}}{P}_{{qg}}\left(\frac{x}{z}\right)G(x,{\mu }^{2}),\end{array}\end{eqnarray}$
where ${P}_{{qg}}(x)=\tfrac{1}{2}({x}^{2}+{\left(1-x\right)}^{2})$ is the leading order quark-gluon splitting function, μ denotes the factorization scale and G(x, μ2) = xg(x, μ2) is the gluon distribution function. Using the equation ( $\begin{eqnarray}\begin{array}{l}{F}_{2}(x,{\mu }^{2})=x\displaystyle \sum _{q}{e}_{q}^{2}\frac{{\alpha }_{s}({\mu }^{2})}{2\pi }\mathrm{ln}\left(\frac{{\mu }^{2}}{{m}_{q}^{2}}\right)\\ \,\times {\int }_{x}^{1}\frac{{\rm{d}}z}{{z}^{2}}{P}_{{qg}}\left(\frac{x}{z}\right)G(x,{\mu }^{2}).\end{array}\end{eqnarray}$
The GLR-MQ-ZRS evolution equation of the gluon distribution function G(x, μ2) at double leading logarithmic approximation (DLLA) is expressed as [9] $\begin{eqnarray}\begin{array}{l}\frac{{\rm{d}}G(x,{\mu }^{2})}{\mathrm{dln}{\mu }^{2}}=\frac{{\rm{d}}G(x,{\mu }^{2})}{\mathrm{dln}{\mu }^{2}}{| }_{\mathrm{DGLAP}}\\ \,+\frac{9}{2\pi }\frac{{\alpha }_{s}^{2}({\mu }^{2})}{{R}^{2}{\mu }^{2}}\frac{{N}_{c}^{2}}{{N}_{c}^{2}-1}{\int }_{\tfrac{x}{2}}^{\tfrac{1}{2}}\frac{{\rm{d}}z}{z}{G}^{2}(x,{\mu }^{2})\\ \,-\frac{9}{\pi }\frac{{\alpha }_{s}^{2}({\mu }^{2})}{{R}^{2}{\mu }^{2}}\frac{{N}_{c}^{2}}{{N}_{c}^{2}-1}{\int }_{x}^{\tfrac{1}{2}}\frac{{\rm{d}}z}{z}{G}^{2}(x,{\mu }^{2}).\end{array}\end{eqnarray}$
The first term on the rhs of the above equation is the linear DGLAP equation at DLLA. The second and the third nonlinear term represents the antishadowing and shadowing effects in gluon recombination respectively. In the GLR-MQ-ZRS equation, both the shadowing and antishadowing corrections tame the sharp growth of gluons. R is the effective radius of gluon interaction, Nc is the number of color charges. The running coupling αs(μ2) at LO approximation is ${\alpha }_{s}({\mu }^{2})=\tfrac{4\pi }{{\beta }_{0}\mathrm{ln}\left(\tfrac{{\mu }^{2}}{{{\rm{\Lambda }}}^{2}}\right)}$, where ${\beta }_{0}=\tfrac{1}{3}(33-2{N}_{f})$, Nf is the number of active quark flavors and Λ is the QCD cutoff parameter.In [19] authors obtained an analytical solution for the LO gluon distribution function ${G}_{{n}_{f}=3}(x,{Q}^{2})={xg}(x,{Q}^{2})$ using the parametrization method from a global fit of the ZEUS experimental data on the proton structure function for low x (x < 0.1) and over a wide range of Q2 values by an expression quadratic in both $\mathrm{ln}({Q}^{2})$ and $\mathrm{ln}\left(\tfrac{1}{x}\right)$ as
$\begin{eqnarray}\begin{array}{l}{G}_{{n}_{f}=3}(x,{Q}^{2})=\left(-2.94-0.359\,\mathrm{ln}\left({Q}^{2}\right)-0.101\,{\mathrm{ln}}^{2}\left({Q}^{2}\right)\right)\\ \quad +\left(0.594-0.0792\,\mathrm{ln}\left({Q}^{2}\right)-0.000\,578\,{\mathrm{ln}}^{2}\left({Q}^{2}\right)\right)\mathrm{ln}\left(\frac{1}{x}\right)\\ \quad +\left(0.168+0.138\,\mathrm{ln}\left({Q}^{2}\right)+0.0169\,{\mathrm{ln}}^{2}\left({Q}^{2}\right)\right){\mathrm{ln}}^{2}\left(\frac{1}{x}\right))),\end{array}\end{eqnarray}$
Also, authors obtained the gluon distribution function by considering heavy quark mass effects as3 )), the nonlinear gluon distribution function is obtained as follows1 ), we can obtain the heavy quark distribution functions in the parametrization method.
$\begin{eqnarray}\begin{array}{rcl}{G}_{{n}_{f}=4}(x,{Q}^{2}) & = & \displaystyle \frac{3}{5}{G}_{{n}_{f}=3}(x,{Q}^{2}),\\ {G}_{{n}_{f}=5}(x,{Q}^{2}) & = & \displaystyle \frac{6}{11}{G}_{{n}_{f}=3}(x,{Q}^{2}).\end{array}\end{eqnarray}$
By solving the GLR-MQ-ZRS equation (i.e. equation ( $\begin{eqnarray}\begin{array}{l}{G}_{{NL}}(x,{\mu }^{2})={G}_{{NL}}(x,{\mu }_{0}^{2})+{G}_{L}(x,{\mu }^{2})-{G}_{L}(x,{\mu }_{0}^{2})\\ \quad +\displaystyle \frac{9}{2\pi }\displaystyle \frac{{N}_{c}^{2}}{{N}_{c}^{2}-1}{\displaystyle \int }_{{\mu }_{0}^{2}}^{{\mu }^{2}}\mathrm{dln}{\mu }^{2}\displaystyle \frac{{\alpha }_{s}^{2}({\mu }^{2})}{{R}^{2}{\mu }^{2}}{\displaystyle \int }_{\tfrac{x}{2}}^{\tfrac{1}{2}}\displaystyle \frac{{\rm{d}}z}{z}{G}_{L}^{2}(x,{\mu }^{2})\\ \quad -\displaystyle \frac{9}{\pi }\displaystyle \frac{{N}_{c}^{2}}{{N}_{c}^{2}-1}{\displaystyle \int }_{{\mu }_{0}^{2}}^{{\mu }^{2}}\mathrm{dln}{\mu }^{2}\displaystyle \frac{{\alpha }_{s}^{2}({\mu }^{2})}{{R}^{2}{\mu }^{2}}{\displaystyle \int }_{x}^{\tfrac{1}{2}}\displaystyle \frac{{\rm{d}}z}{z}{G}_{L}^{2}(x,{\mu }^{2}),\end{array}\end{eqnarray}$
where GNL(x, μ2) and GL(x, μ2) are the nonlinear and linear gluon distribution function, respectively. At ${\mu }_{0}^{2}({Q}_{0}^{2})$ the nonlinear gluon distribution function at low x is considered by the following form [20] $\begin{eqnarray}\begin{array}{l}{G}_{{NL}}(x,{\mu }_{0}^{2})={G}_{L}(x,{\mu }_{0}^{2})\\ \quad \times {\left[1+\frac{27\pi {\alpha }_{s}({\mu }_{0}^{2})}{16{R}^{2}{\mu }_{0}^{2}}\theta ({x}_{0}-x)\left[{G}_{L}(x,{\mu }_{0}^{2})-{G}_{L}({x}_{0},{\mu }_{0}^{2})\right]\right]}^{-1}\\ \end{array}.\end{eqnarray}$
By inserting equations the linear and nonlinear gluon distribution functions in equation (3. Result and discussion
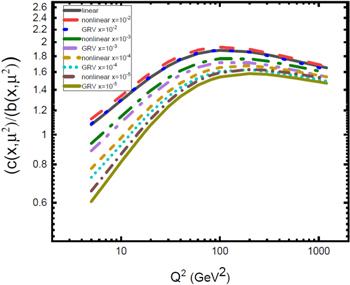
In this section, we present our computed results of the charm and beauty distribution function using the linear and nonlinear gluon distribution function with respect to the parametrization method due to the number of active flavors. In this analysis, according to [19] we used the QCD parameter Λ has been extracted with ${\alpha }_{s}({M}_{z}^{2})=0.118$ at the Z-bosson mass, which corresponds to the number of active flavors at the LO approximation as Λ(nf = 4) = 120.4 MeV and Λ(nf = 5) = 87.8 MeV. In figures 1 and 2, we have presented the results of the solution of the GLR-MQ-ZRS equation for low x behavior of the gluon distribution function in the parametrization method for nf = 4 and nf = 5 for heavy quarks of charm and bottom, respectively. We performed calculations in the kinematic region 5 ≤ Q2 < 100 GeV2 and 10−5 ≤ x ≤ 10−2. As the results show, we observe that with the decrease of x as well as the increase of Q2, the gluon distribution function increases. Also it can be observed that the behavior of the nonlinear gluon distribution function is reduced compared to the behavior of its linear. Indeed, by decreasing x, the rapid growth of the gluon distribution function is tamed by gluon recombination effects. In these figures, the nonlinear effects are considered at the hot-spot point (R = 2 GeV−1). We compared our computed results of the linear and nonlinear gluon distribution with respect to the parametrization method with PDFs of groups such as NNPDF3.0 [21], CT14 [22] and GRV92 [23] (also, one can see [24–27]). Also, in figure 1, the ratio of the NNPDF3.0 and CT14 data to the linear and nonlinear gluon distribution functions is shown. Figures 3 and 4 represent the ratio of the charm and bottom distribution functions to the linear and nonlinear gluon density as a function of the factorization scale μ on a logarithmic scale, for various fixed values of low x. For these figures, we considered the kinematic region 5 ≤ Q2 ≤ 1200 GeV2 according to the kinematic range of parametrization of the gluon distribution function obtained from the HERA data in [19]. As can be observed, these curves are independent of the gluon distribution function types (i.e. linear or nonlinear) on a logarithmic scale and are linear and approximately equivalent. Also, the slope of the curves saturates at about 0.5 at very small x (x ≤ 10−4). These results are in good agreement with respect to figures in [18]. Figures 5 and 6 represent the Q2 evolution of the ratio of the charm and bottom distribution functions to the linear and nonlinear gluon density with respect to the active flavor number, respectively. In figure 7, we present the ratio of the charm distribution function to the bottom distribution function as a function of Q2. As, we observe that by decreasing x and Q2, the nonlinear effects increase and by increasing Q2, these effects are negligible. Also, in high Q2 because of the increase in energy and active flavor number, the possibility of splitting gluons to the heavier quark (i.e. bottom) increases, and thus ratio distribution function of charm to bottom decreases. Also, we can see the results of nonlinear corrections to this ratio based on the GLR-MQ-ZRS evolution equation and applying the parametrization method of the gluon distribution function with respect to a number of active flavors are in good agreement with results obtained of the gluon distribution function of the GRV92.
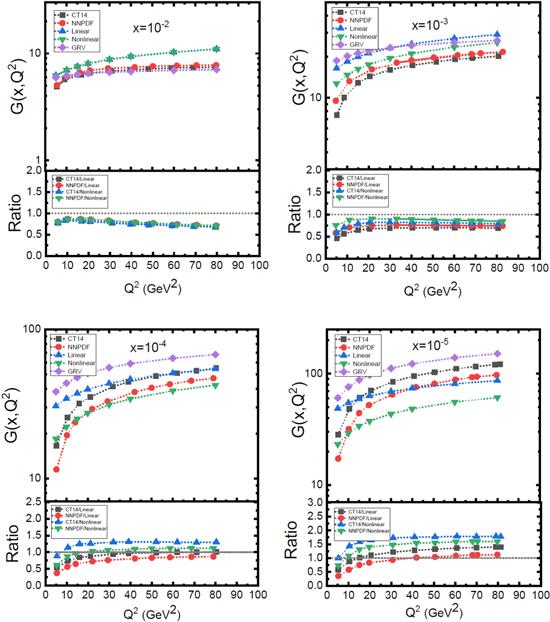
Figure 1. The linear and nonlinear gluon distribution function, versus Q2 for various fixed values of x for nf = 4 associated with the parametrization method [19]. The ratio of parametrization gluon distribution function of NNPDF3.0 and CT14 groups to the results of linear and nonlinear gluon distribution function have been displayed. |
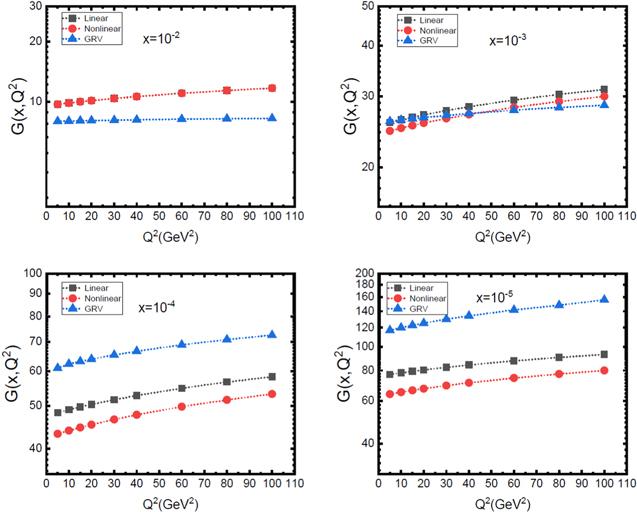
Figure 2. The linear and nonlinear gluon distribution function, versus Q2 for various fixed values of x for nf = 5 associated with the parametrization method [19]. |
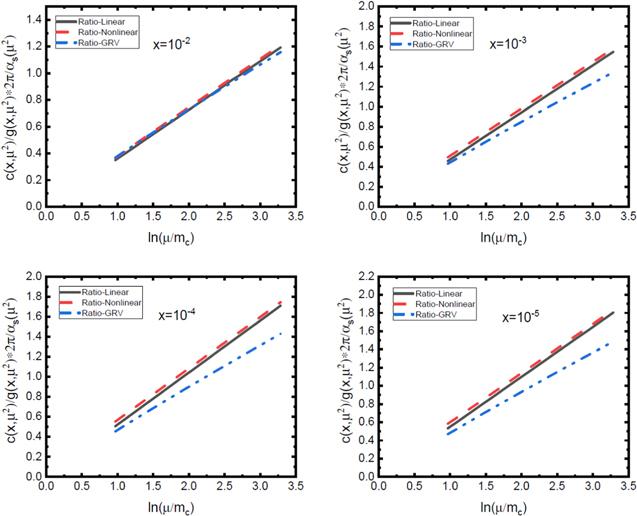
Figure 3. The ratio of the charm distribution function to gluon density, versus $\mathrm{ln}(\tfrac{\mu }{{m}_{c}})$ for various fixed values of x associated with the parametrization method [19]. |
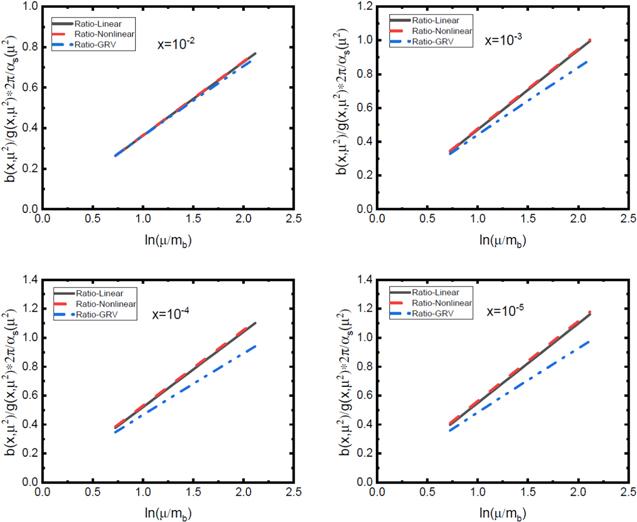
Figure 4. The ratio of the bottom distribution function to gluon density, versus $\mathrm{ln}(\tfrac{\mu }{{m}_{b}})$ for various fixed values of x associated with the parametrization method [19]. |
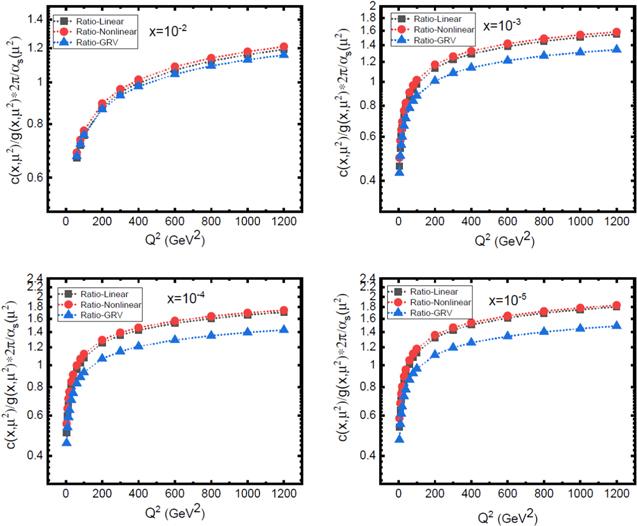
Figure 5. The Q2 evolution of the ratio of the charm distribution function to gluon density for various fixed values of x associated with the parametrization method [19]. |
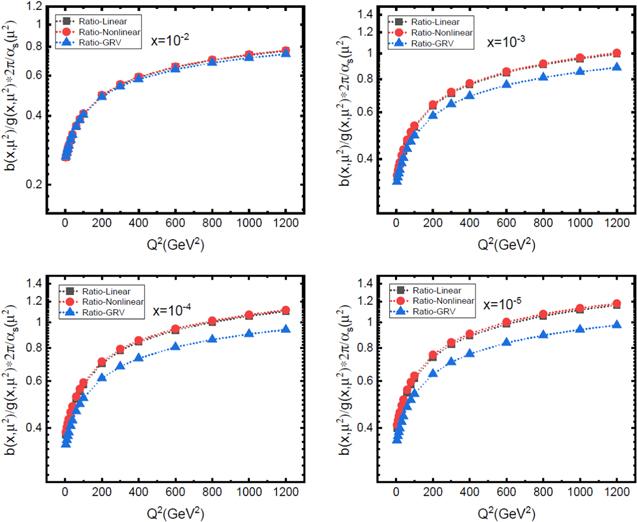
Figure 6. The Q2 evolution of the ratio of the bottom distribution function to gluon density for various fixed values of x associated with the parametrization method [19]. |
Figure 7. The Q2 evolution of the ratio of the charm distribution function to bottom distribution function for various fixed values of x. |
In conclusion, we studied the sensitivity of the heavy-quark distribution function to the values of the number of active flavors for low x and a wide range of Q2 values. In this work, we solved the GLR-MQ-ZRS equation at DLLA by applying the parametrization method of the gluon distribution function suggested in [19]. Our results for the Q2 evolution of the linear gluon distribution function as well as the nonlinear gluon distribution function in the framework of the GLR-MQ-ZRS equation compared with NNPDF3.0, CT14 and GRV92. We observed that with an increase of Q2 as well as a decrease of x, the gluon distribution function increased. By decreasing x, both the shadowing and antishadowing effects tame the growth of the gluon distribution function. Also, we observed that curves of the charm and bottom distribution functions to gluon density as a function of the factorization scale μ on a logarithmic scale independent of the linear or nonlinear type of the gluon distribution function are linear and approximately equivalent and the slope of the curves saturates at about 0.5 at very small x (x ≤ 10−4). In the following, we showed that the nonlinear corrections of the Q2 evolution of the ratio of heavy quark distribution function to gluon density can be directly related to gluon behavior due to the number of active flavors and are visible at low x and low Q2 and negligible at high Q2. Finally, we observe that the nonlinear corrections to the ratio of the charm distribution function to the bottom distribution function are considerable at low x and low Q2 and are negligible in high Q2 and results obtained from the parametrization method of the gluon distribution function are compatible with the results of computations obtained of the gluon distribution function of the GRV92. Our computed results in this paper seem to be compatible with the PDFs of the various collaboration groups such as NNPDF3.0, CT14 and GRV92.