


1. Introduction
Topological insulators are characterized by the existence of conducting edge states and insulating bulk states simultaneously [1–3]. The bulk-boundary correspondence [4–8] originating from topological energy band theory [3] predicts that the existence of edge states can be characterized by a bulk invariant. The protection of the bulk invariant leads these boundary states to be immune to the defect and perturbation. The bulk-boundary correspondence actually implies that the range between the gap-closing points calculated from the periodic Hamiltonian is exactly identical to the region of edge states in the open energy spectrum if ignoring the size effect. The finite-size effect in Hermitian topological systems [9–11] has been well theoretically and experimentally studied. For example, with the increasing of the size of an open Hermitian Su–Schrieffer–Heeger (SSH) chain, the region of the edge states usually increases to a certain value accompanying an exponential decay of the energy gap.
In recent years, more and more attention has been devoted to the non-Hermitian [12–18] version of topological insulators since the non-Hermiticity induces abundant novel physics. Earlier investigations of this field were mainly focused on the topological system with parity-time symmetry (${ \mathcal P }{ \mathcal T }$ symmetry) [19–28]. It was demonstrated that the broken and unbroken ${ \mathcal P }{ \mathcal T }$ symmetry has a great influence on the topology and energy spectrum of the system. For example, a local non-Hermitian perturbation in Hermitian lattices can generically induce scale-free localization for continuous-spectrum eigenstates. When ${ \mathcal P }{ \mathcal T }$ symmetry is present, the scale-free localization emerges simultaneously with the ${ \mathcal P }{ \mathcal T }$ symmetry breaking [27, 28]. Another hotspot of the investigation is the non-Hermitian topological system with the nonreciprocal coupling [29–46] since these systems do not possess traditional bulk-boundary correspondence [29, 37–39], which is reflected in the non-correspondence between the edge states of the open spectrum and the gap-closing points of the periodic spectrum. The breakdown of the traditional bulk-boundary correspondence leads to the appearance of anomalous edge states in an open non-Hermitian chain [29]. Actually, the breakdown of the traditional bulk-boundary correspondence originates from the properties of the non-Bloch wave, which is the so-called non-Hermitian skin effect [30–36]. It has been demonstrated that there is a generalized bulk-boundary correspondence by introducing the non-Bloch band theory [30–32, 45], in which one can define a new non-Bloch topological invariant via the biorthogonal basis of the non-Bloch Hamiltonian. The size effect also appears in these non-Hermitian systems [34, 40]. For example, the systems with non-Hermitian skin effects are very sensitive to the imposed boundary conditions and lattice size, in which the skin effect is fragile under any tiny boundary perturbation in the thermodynamic limit although it can survive in a finite-size system [34]. Furthermore, it has shown the anomalous skin effects in a circular system with a single non-Hermitian impurity wherein the presence of anisotropic hopping terms can induce a scale-free accumulation of all eigenstates opposite the bulk hopping direction, although the nonmonotonic behavior is fine tuned and further increasing such hopping weakens and eventually reverses the effect [35]. Note that, although the size effect and the boundary impurity coupling have been investigated widely in the open and circular chains respectively, the size effect and boundary states both in one circular non-Hermitian chain are still an open issue.
In this paper, we discuss the size effect and the edge states based on a circular non-Hermitian chain, in which the first and the last sites couple with each other via an additional boundary coupling strength t3. When the circular non-Hermitian chain has nonreciprocal intra-cell couplings, we find that the initially localized edge and bulk states become extended with the increasing of t3. And the circular non-Hermitian chain exhibits the even–odd effect of the unit cell corresponding to a large size of the chain, which is completely different from an open non-Hermitian chain. Besides this, we discuss the case of nonreciprocal t3, in which the circular non-Hermitian chain also possesses similar localized states at the first site as the open chain. Furthermore, we discuss the circular non-Hermitian chain with nonreciprocal inter-cell couplings. The numerical results reveal that the circular non-Hermitian chain with the nonreciprocal inter-cell couplings also possesses analogous localized boundary states and exhibits the size effect. These results further supply the physical phenomena in a circular non-Hermitian chain.
The paper is organized as follows: In section 2 , we recall the topological properties of an open non-Hermitian chain and discuss the physics of a circular non-Hermitian chain. In section 3 , we focus on the case of the circular non-Hermitian chain with the nonreciprocal inter-cell couplings and investigate the topology of the system in detail. Finally, a conclusion is given in section 4 .
2. Nonreciprocal intra-cell coupled circular chains
We consider a circular version of an open non-Hermitian chain with N unit cells, as depicted in figure 1. The system is dominated by the following Hamiltonian, with
$\begin{eqnarray}\begin{array}{l}H=\displaystyle \sum _{n}\left[({t}_{1}+\delta ){a}_{n}^{\dagger }{b}_{n}+({t}_{1}-\delta ){b}_{n}^{\dagger }{a}_{n}\right.\\ \qquad \left.+{t}_{2}({a}_{n+1}^{\dagger }{b}_{n}+{b}_{n}^{\dagger }{a}_{n+1})\right]+{t}_{3}({a}_{1}^{\dagger }{b}_{N}+{b}_{N}^{\dagger }{a}_{1}),\end{array}\end{eqnarray}$
where t1 ± δ is the nonreciprocal coupling strength between the two sites in the same unit cell, t2 is the reciprocal coupling strength between the two sites in the two adjacent unit cells, and t3 represents the boundary coupling strength. When t3 = 0, the model described by the above Hamiltonian becomes the same version as in [30, 31]. Before discussing the effect of t3, we first recall the topology of an open non-Hermitian chain. When t3 = 0, we plot the energy spectra and the distribution of states corresponding to an even number of unit cells (N= 20) and an odd number of unit cells (N = 21) respectively, as shown in figures 2 (a1)–(a4) and (b1)–(b4). The numerical results show that, corresponding to an open non-Hermitian chain, the two degenerate zero energy modes are both located at the leftmost (rightmost) end simultaneously while the bulk states of the system exhibit a skin effect. An even or odd number of the unit cell (N = 20 or N = 21) has almost no effects on the zero energy modes and the distributions of states when N is large enough. However, when N is relatively small, the open non-Hermitian chain exhibits an even–odd effect of N. When N = 6, we plot the real and imaginary parts of the energy spectrum, as shown in figures 2(c1) and (c2). We find that the real zero energy modes split as two energy levels around t1 = 0 and the imaginary zero energy modes remain unchanged. Also, we plot the distributions of the zero energy modes and the splitting energy levels, as shown in figures 2(c3) and (c4). When N takes N = 5, we find that the real zero energy modes remain unchanged and the imaginary zero energy modes split into two parts, as shown in figures 2(d1) and (d2). We stress that a tiny even or odd N only changes the structures of the energy spectra and almost does not change the distributions of the states, as shown in figures 2(d3) and (d4).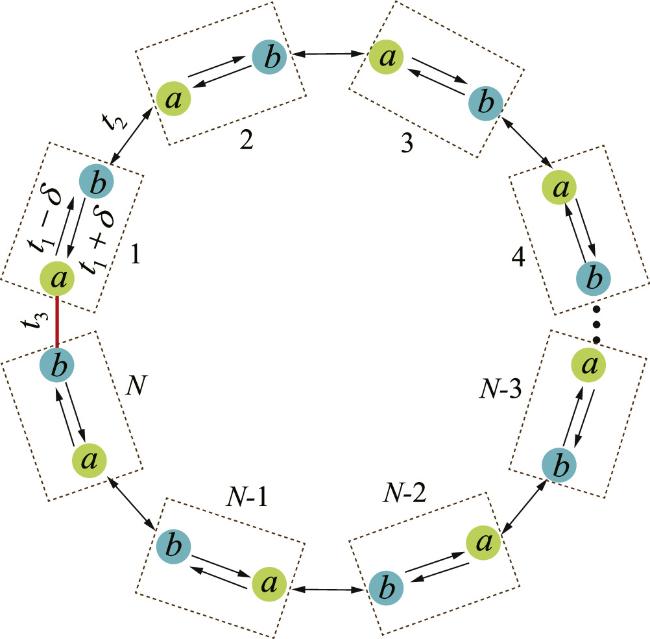
Figure 1. Schematic of a circular non-Hermitian chain. The circular non-Hermitian chain contains N unit cells (black dashed rectangle). Each unit cell contains two kinds of sites a and b. The couplings in the same unit cell take nonreciprocal configurations and the couplings between two adjacent unit cells take reciprocal configurations. The first site a1 couples with the last site bN via t3. |
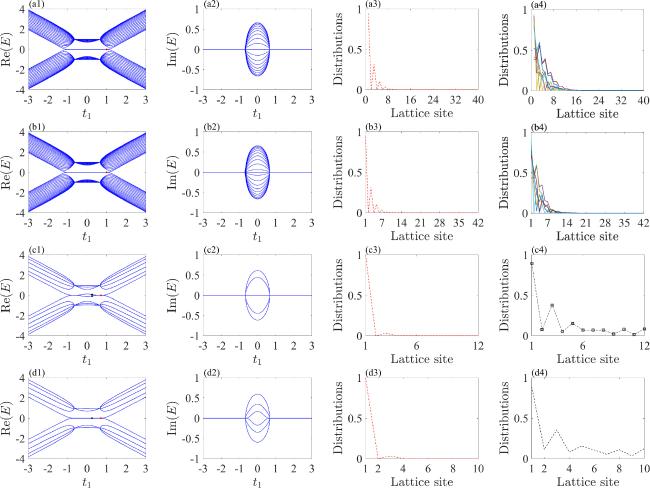
Figure 2. The energy spectra and distributions of states for an open non-Hermitian chain. (a1) The real part of the energy spectrum when N = 20. (a2) The imaginary part of the energy spectrum when N = 20. (a3) The distributions of the red dot in (a1). (a4) The distributions of eight randomly chosen bulk states. (b1)–(b4) The same projects as in (a1)–(a4) when N = 21. (c1) The real part of the energy spectrum when N = 6. (c2) The imaginary part of the energy spectrum when N = 6. (c3) The distributions of the red dot in (c1). (c4) The distributions of the black dots in (c1). (d1)–(d4) The same projects as in (c1)–(c4) when N = 5. Other parameters satisfy δ = 2/3 and t2 = 1. |
2.1. The case of reciprocal t3
When t3 is added into the system, we find that t3 splits the zero energy modes around t1 = 0, as shown in figures 3(a1) and (a2). We also plot the corresponding distributions of states, as shown in figures 3 (a3) and (a4). The numerical results show that t3 makes the distribution of zero modes at the first site to be decreased and makes the distributions at other sites to be increased, which means that the existence of t3 destroys the localizations of two degenerate zero energy modes and the skin effect of bulk states. Especially, when t3 reaches the same strength as t2 (t3 = t2 = 1), we plot the corresponding energy spectrum, distributions of zero energy modes, and the distributions of eight randomly chosen bulk states, as shown in figures 3(b1), (b2), (b3), and (b4). We find that t3 = 1 does not change the structure of the energy bands but makes the distributions of the zero energy modes and bulk states to be totally extended, which is completely distinct from the case of the open non-Hermitian chain. The totally extended bulk states imply the disappearance of the non-Hermitian skin effect of an open chain. This phenomenon is intuitive since t3 = t2 corresponds to a perfect circular chain. With t3 increasing sequentially, the distribution of zero modes at the first site decreases unceasingly, as shown in figures 3(c1)–2(c4). When t3 exceeds a certain range, we find that the two bulk energy levels separate from the top and bottom energy bands, as shown in figure 3(d1). The imaginary part of the energy spectrum when t3 = 2 is shown in figure 3(d2). We also plot the distributions of zero energy modes and the separated bulk state, as shown in figures 3(d3) and (d4). The numerical results reveal that the large enough t3 makes the distribution of zero energy modes at the first site to reach minimum while making the separated bulk states reach the maximum distributions. The reason is that the large enough t3 means the first and the last sites are to be paired approximatively and are to be decoupled from the circular chain equivalently, leading to the separated bulk states having maximum distributions at the first and the last sites.
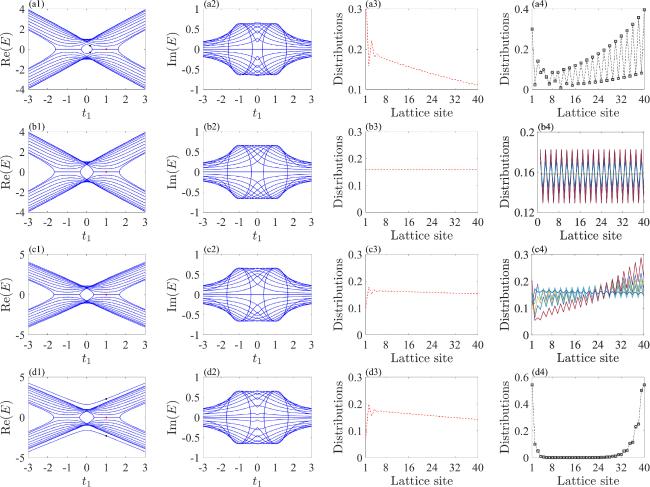
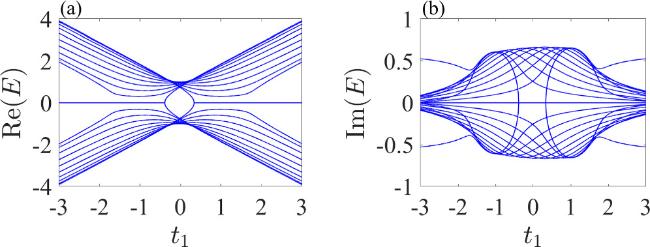
Figure 3. The energy spectra and distributions of states for a circular non-Hermitian chain. (a1) The real part of the energy spectrum when t3 = 0.3. (a2) The imaginary part of the energy spectrum when t3 = 0.3. (a3) The distributions of the red dot in (a1). (a4) The distributions of the black dots in (a1). (b1) The real part of the energy spectrum when t3 = 1. (b2) The imaginary part of the energy spectrum when t3 = 1. (b3) The distributions of the red dot in (b1). (b4) The distributions of eight randomly chosen bulk states in (b1). (c1)–(c4) The same projects as in (b1)–(b4) when t3 = 1.5. (d1) The real part of the energy spectrum when t3 = 2. (d2) The imaginary part of the energy spectrum when t3 = 2. (d3) The distributions of the red dot in (d1). (d4) The distributions of the black dots in (d1). Other parameters satisfy δ = 2/3, t2 = 1, and N = 20. |
Besides, we find that the circular non-Hermitian chain exhibits an even–odd effect of unit cells corresponding to a large number of unit cells, as shown in figures 4(a) and (b). Compared with the energy spectrum in figures 3(a1) and (a2), obviously, the energy spectra when N = 21 are completely different from the spectra when N = 20, differing from the open non-Hermitian chain only possessing the even–odd effect of unit cell when N is relatively small.
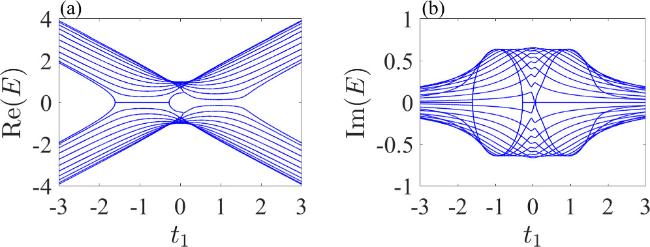
Figure 4. The even–odd effect of unit cell corresponding to a large number of unit cell N = 21. (a) The real part of energy spectrum. (b) The imaginary part of the energy spectrum. Other parameters satisfy δ = 2/3, t2 = 1, and t3 = 0.3. |
2.2. The case of nonreciprocal t3
In this part, we focus on the case that t3 is nonreciprocal, with
$\begin{eqnarray}\begin{array}{l}H=\displaystyle \sum _{n}\left[({t}_{1}+\delta ){a}_{n}^{\dagger }{b}_{n}+({t}_{1}-\delta ){b}_{n}^{\dagger }{a}_{n}\right.\\ \qquad \left.+\,{t}_{2}({a}_{n+1}^{\dagger }{b}_{n}+{b}_{n}^{\dagger }{a}_{n+1})\right]\\ \qquad +\,({t}_{3}+\delta ){a}_{1}^{\dagger }{b}_{N}+({t}_{3}-\delta ){b}_{N}^{\dagger }{a}_{1}),\end{array}\end{eqnarray}$
where t3 ± δ is the nonreciprocal coupling strength between the first and the last lattice sites.When t3 < δ, we find that the energy gap has three different regions: the two-fold degenerate zero energy modes, the four-fold degenerate zero energy modes, and two pairs of separated two-fold degenerate modes, as shown in figure 5(a1). At the same time, the imaginary part of the energy spectrum when t3 = 0.3 is shown in figure 5(a2). The corresponding distributions of states are shown in figures 5(a3) and (a4). The numerical results show that two modes of the four-fold degenerate zero energy modes have maximal distribution at the first site, while the other two modes have extended distributions, as shown in figure 5(a3). We also find that the distributions of the separated two-fold degenerate modes have maximal value at the first site and have extended distributions at bulk sites, as shown in figure 5(a4). Although these modes have maximal distributions at the first site, they also possess more or less extended features.
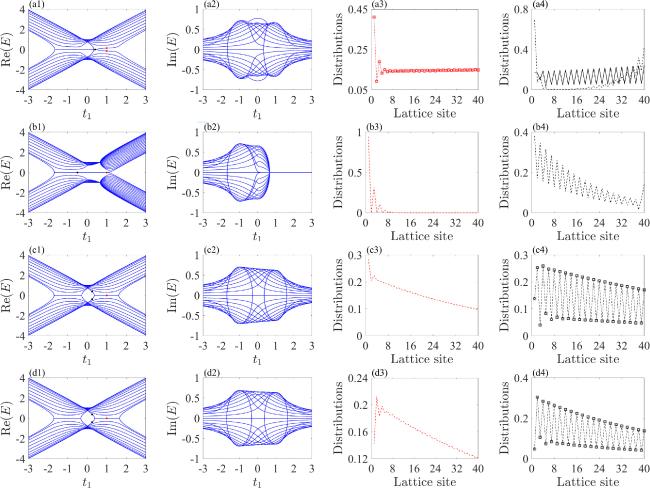
Figure 5. The energy spectra and distributions of states for a circular non-Hermitian chain with nonreciprocal t3. (a1) The real part of the energy spectrum when t3 = 0.3. (a2) The imaginary part of the energy spectrum when t3 = 0.3. (a3) The distributions of the red dots in (a1). (a4) The distributions of the black dot in (a1). (b1) The real part of the energy spectrum when t3 = δ. (b2) The imaginary part of the energy spectrum when t3 = δ. (b3) The distributions of the red dot in (b1). (b4) The distributions of black dot in (b1). (c1)-(c4) and (d1)-(d4) The same projects as in (b1)-(b4) when t3 = 1 and t3 = 1.5. Other parameters satisfy δ = 2/3, t2 = 1, and N = 20. |
The energy spectra become quite different when t3 = δ. Specifically, the energy spectrum, when t3 = δ, only has two degenerate zero energy modes in the gap, as shown in figure 5(b1), which is totally different from the case of t3 < δ [compared with figure 5(a1)]. Besides this, we find that the system experiences a phase transition with the varying of parameter t1 when t3 = δ, in which the imaginary part of the energy spectrum becomes zero for t1 > δ, as shown in figure 5(b2). It means that the system experiences a phase transition at the point of t1 = δ, at which point the system from the ${ \mathcal P }{ \mathcal T }$ broken phase changes to the ${ \mathcal P }{ \mathcal T }$ unbroken phase. Naturally, the energy spectrum becomes a pure real spectrum after the point of t1 = δ. We also find that the two degenerate zero energy modes have different distributions in different parameter regions of t1. More precisely, the zero energy modes have the perfect ‘boundary’ localization and extended distributions simultaneously, as shown in figures 5(b3) and (b4). This is pretty counterintuitive since the circular chain has no boundaries of the general definition. This phenomenon reveals that the circular non-Hermitian chain can also possess the analogous boundary states as an open non-Hermitian chain via choosing the appropriate t3.
With t3 increasing sequentially, the energy spectra exhibit the same band structures as the case of reciprocal t3 (see figure 3), as shown in figures 5(c1)–(d4). The difference is that the degree of extension of the states is relatively small compared with figure 3 corresponding to the same strength of t3. We also investigate the case of the inversion of the nonreciprocal strength, i.e., $({t}_{3}-\delta ){a}_{1}^{\dagger }{b}_{N}$ and $({t}_{3}+\delta ){b}_{N}^{\dagger }{a}_{1}$. We find that the energy spectra of the system exhibit a mirror symmetric band structure compared with the spectra shown in figure 5. We do not discuss this in detail here.
3. Circular chain with nonreciprocal inter-cell couplings
Now we consider another circular non-Hermitian chain with nonreciprocal inter-cell couplings. The system can be dominated by the following Hamiltonian, with
$\begin{eqnarray}\begin{array}{l}H=\displaystyle \sum _{n}\left[({t}_{1}+\delta ){a}_{n+1}^{\dagger }{b}_{n}+({t}_{1}-\delta ){b}_{n}^{\dagger }{a}_{n+1}\right.\\ \quad \left.+{t}_{2}({a}_{n}^{\dagger }{b}_{n}+{b}_{n}^{\dagger }{a}_{n})\right]+{t}_{3}({a}_{1}^{\dagger }{b}_{N}+{b}_{N}^{\dagger }{a}_{1}).\end{array}\end{eqnarray}$
3.1. The case of reciprocal t3
First, we still focus on the case of reciprocal t3. When t3 is not large enough, we find that the existence of t3 makes the energy gap of the system into two separated gap modes and two degenerate zero energy modes, as shown in figure 6(a). Meanwhile, the imaginary part of the energy spectrum when t3 = 0.3 is shown in figure 6(b). With t3 increasing to a large value, we find that two bulk states separate from the bulk band and the distance between the two separated modes increases, as shown in figure 6(c). Also, the imaginary part of the energy spectrum when t3 = 1, as shown in figure 6(d). We also plot the corresponding distributions of states (the distributions of purple, green, red and black dots in figure 6(c)), as shown in figures 6(e)–(h). The numerical results show that the two separated modes (purple dots) in the gap have maximal distributions at two terminal sites but the distributions still exhibit an extended tendency, as shown in figure 6(e). At the same time, the two segregated bulk states (green dots) exhibit the distributions of a bound state since the large t3 make the first and the last sites decouple from the circular non-Hermitian chain, as shown in figure 6(f). Besides this, the two degenerate zero energy modes (red dot) become extended because of the large boundary coupling strength t3, as shown in figure 6(g). As for the two separated black dots, the distributions of states is mirror symmetric as the purple dots, as shown in figure 6(h). Also, we find that the circular non-Hermitian chain with nonreciprocal inter-cell couplings exhibits an even–odd effect of the unit cell, as shown in figures 7(a) and (b). Compared with the energy spectrum in figures 6(a) and (b), obviously, the energy spectrum corresponding to an odd number of unit cell exhibits a totally different band structure, in which the energy gap of the real energy spectrum does not have the degenerate zero energy modes.
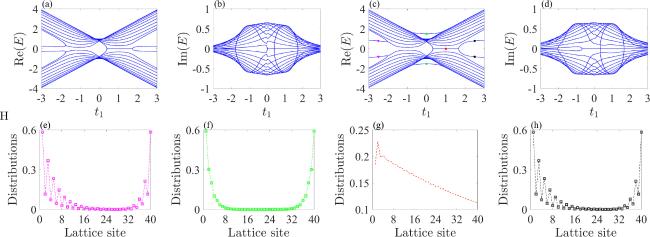
Figure 6. The energy spectra and distributions of states for a circular non-Hermitian chain with reciprocal t3. (a) The real part of the energy spectrum when t3 = 0.3. (b) The imaginary part of the energy spectrum when t3 = 0.3. (c) The real part of the energy spectrum when t3 = 1. (d) The imaginary part of the energy spectrum when t3 = 1. (e)–(h) The distributions of the purple dots, green dots, red dot, and black dots in (c). Other parameters satisfy δ = 2/3, t2 = 1, and N = 20. |
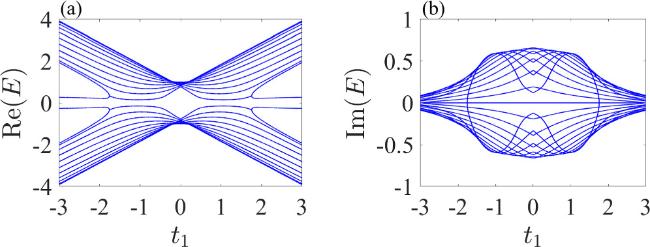
Figure 7. The even–odd effect of unit cell corresponding to a large number of unit cell N = 21 for (a) the real part of the spectrum and for (b) the imaginary part of the spectrum. Other parameters satisfy δ = 2/3, t2 = 1, and t3 = 0.3. |
3.2. The case of nonreciprocal t3
As discussed above, the reciprocal t3 cannot induce the perfect analogous boundary states in a circular non-Hermitian chain with nonreciprocal inter-cell couplings. Then, we focus on the case that t3 is nonreciprocal, with
$\begin{eqnarray}\begin{array}{l}H=\displaystyle \sum _{n}\left[({t}_{1}+\delta ){a}_{n+1}^{\dagger }{b}_{n}+({t}_{1}-\delta ){b}_{n}^{\dagger }{a}_{n+1}\right.\\ \quad \left.+{t}_{2}{a}_{n}^{\dagger }{b}_{n}+{t}_{2}{b}_{n}^{\dagger }{a}_{n}\right]\\ \quad +({t}_{3}+\delta ){a}_{1}^{\dagger }{b}_{N}+({t}_{3}-\delta ){b}_{N}^{\dagger }{a}_{1}.\end{array}\end{eqnarray}$
We find that when t3 < δ, the system exhibits a symmetrical energy spectrum, in which two degenerate zero energy modes appear in the two sides of the energy gap, as shown in figure 8(a). We find that the zero modes in the two sides of the energy gap have the same distributions and both have maximal distribution at the two end sites, as shown in figure 8(c).
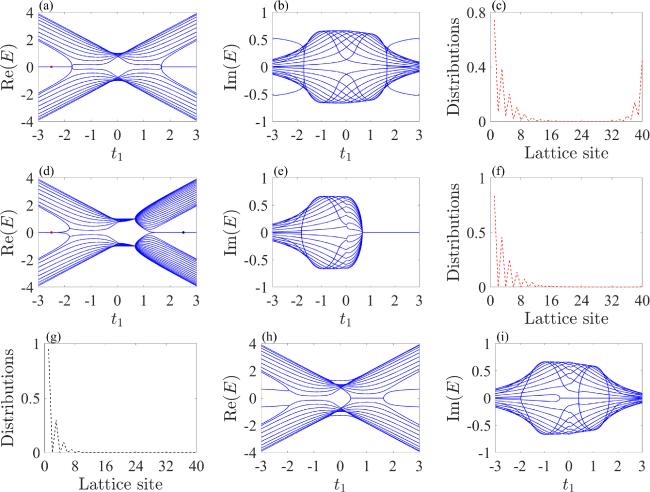
Figure 8. The energy spectra and distributions of states for a circular non-Hermitian chain with nonreciprocal t3. (a) The real part of the energy spectrum when t3 = 0.3. (b) The imaginary part of the energy spectrum when t3 = 0.3. (c) The distributions of the red dot in (a). (d) The real part of the energy spectrum when t3 = δ. (e) The imaginary part of the energy spectrum when t3 = δ. (f) and (g) The distributions of the red dot and black dot in (d). (h) The real part of the energy spectrum when t3 = 1. (i) The imaginary part of the energy spectrum when t3 = 1. Other parameters satisfy δ = 2/3, t2 = 1, and N = 20. |
When t3 reaches t3 = δ, we find that the energy spectrum of the system is not symmetrical but still has two degenerate zero energy modes, as shown in figure 8(d). We also plot the corresponding distributions of states (the distributions of red dot and black dot in figure 8(d)), as shown in figures 8(f) and (g). The numerical results reveal that the circular non-Hermitian chain with the nonreciprocal inter-cell couplings can also possess the same analogous boundary states as the open non-Hermitian chain. Compared with the case of the circular non-Hermitian chain with nonreciprocal intra-cell couplings (see figures 5(b1)–(b4)), we find that the present whole zero energy modes in the gap are all the perfect analogous boundary states, which reveals the different effects of the nonreciprocal intra-cell couplings and nonreciprocal inter-cell couplings. With t3 increasing sequentially, as separately shown in figure 8(h), we find that the energy spectrum of the system exhibits a similar band structure as the case shown in figure 6(a). Simultaneously, the imaginary part of the energy spectrum when t3 = 0.3, t3 = δ, t3 = 1, as shown in figures 8(b), (e) and (h).
We also discuss the case of the inversion of nonreciprocal strength, i.e., with $({t}_{3}-\delta ){a}_{1}^{\dagger }{b}_{N}$ and $({t}_{3}+\delta ){b}_{N}^{\dagger }{a}_{1}$. We find that, as shown in figures 9(a) and (b), the spectrum of the present circular non-Hermitian chain with the inversion of nonreciprocal strength is completely different from the case shown in figure 8(a) and (b). The reason being the different coupling configurations of circular non-Hermitian chain. Thus, we can investigate the different physics based on a circular non-Hermitian chain via designing the corresponding coupling configurations.
Figure 9. The energy spectra and distributions of states for a circular non-Hermitian chain with the inversion of nonreciprocal hopping, i.e., $({t}_{3}-\delta ){a}_{1}^{\dagger }{b}_{N}$ and $({t}_{3}+\delta ){b}_{N}^{\dagger }{a}_{1}$. (a) The real part of the energy spectrum when t3 = 0.3. (b) The imaginary part of the energy spectrum when t3 = 0.3. Other parameters satisfy δ = 2/3, t2 = 1, and N = 20. |
4. Conclusions
In conclusion, we have investigated the size effect and the analogous boundary states based on a circular non-Hermitian chain with nonreciprocal intra-cell couplings or inter-cell couplings. We find that corresponding to a circular non-Hermitian chain with nonreciprocal intra-cell couplings, the boundary coupling strength leads the initially localized states to be extended, which is consistent with the features of a circular chain. However, the circular non-Hermitian chain exhibits a similar localization boundary state as the open non-Hermitian chain under some parameter regimes. This phenomenon is interesting since the circular chain has no strictly defined boundaries. We also discuss the energy spectra and the distributions of the system under a series of different parameter regimes, which reveals the different topological phenomena in the circular non-Hermitian chain.