


Introduction
Mathematical formulation
| a | (a) It is assumed that all other signaling systems are well regulated maintaining the homeostasis of the signaling molecules other than calcium and nitric oxide, which may have influence on [Ca2+] and NO dynamics in neuron cells. Therefore, it is justified to assume that other signaling systems like IP3, β-amyloid, ATP, dopamine, etc are in homeostasis and static mode and therefore can be assumed to be constant. Thus, the influences on [Ca2+] and NO dynamics will be static and constant. |
| b | (b) There are no external disturbances under normal conditions in neuronal cells. |
| c | (c) The parameters assumed to be vary in the normal ranges. |
Initial conditions
Boundary conditions
Results and discussion
| Parameters | Values | Parameters | Values |
|---|---|---|---|
| VIPR | 8.5 s−1 | KAc | 0.8 μM |
| Kserca | 0.4 μM | VLeak | 0.01 s−1 |
| Kinh | 1.8 μM | KIP3 | 0.15 μM |
| DCa | 16 μm2 s−1 | Vserca | 0.65 μM s−1 |
| FC | 0.83 | k+ | 1.5 μM−1 s−1 |
| KNO | 0.09 μM s−1 | DNO | 3300 μm2 s−1 |
| Kdeg | 0.0145 s−1 | FE | 0.17 |
| VNO | 0.45 μM | g0 | 4.8 nM2 |
| g1 | 35.33 nM | a0 | 1200.16 nM2 |
| g2 | 37.33 nM | VcGMP | 1.260 μM s−1 |
| XcGMP | 0.0695 μM s−1 | VcGMP | 2 μM |
| ${V}_{\mathrm{cGMP}}^{\mathrm{PMCA}}$ | 2.9 pA | ${K}_{\mathrm{cGMP}}^{\mathrm{PMCA}}$ | 1 μM |
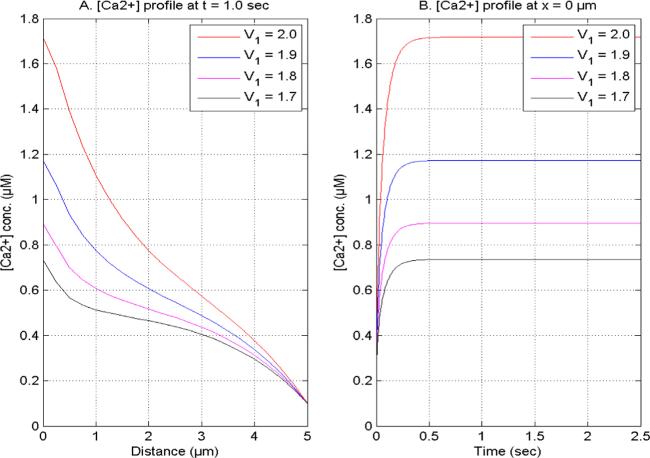
Figure 1. [Ca2+] concentration at V2 = 2.0, U1 and U2 = 1.0 for time (1.0 s) and site (0 μm) concerning distinct [Ca2+] space fractional derivatives. |
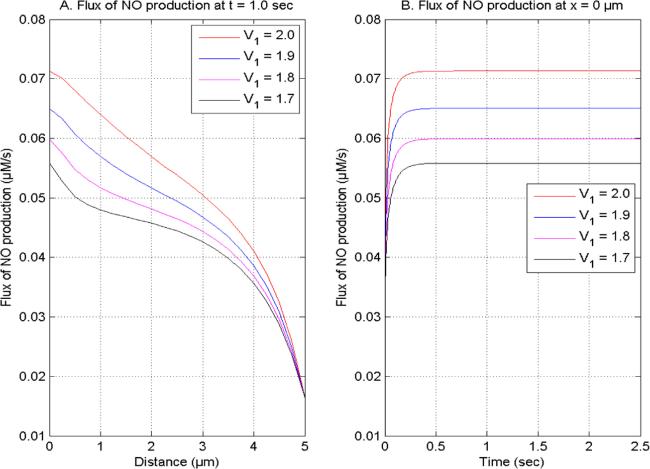
Figure 2. NO generation flux at V2 = 2.0, U1 and U2 = 1.0 for time (1.0 s) and site (0 μm) concerning distinct [Ca2+] space fractional derivatives. |

Figure 3. NO distribution at V2 = 2.0, U1 and U2 = 1.0 for time (0.03 s) and site (0 μm) concerning distinct [Ca2+] space fractional derivatives. |
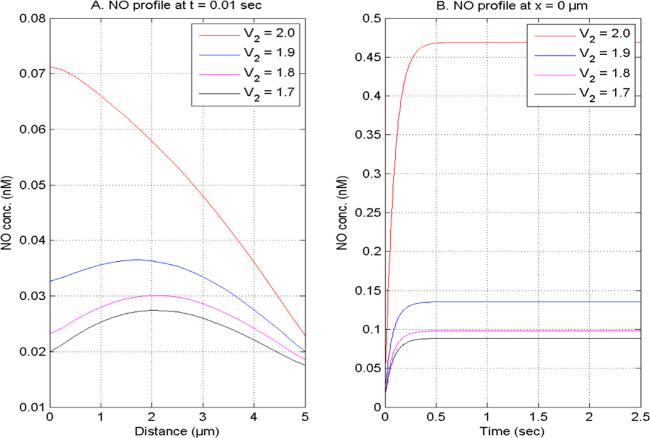
Figure 4. NO distribution at V1 = 2.0, U1 and U2 = 1.0 for time (0.1 s) and site (0 μm) concerning different NO space fractional derivatives. |
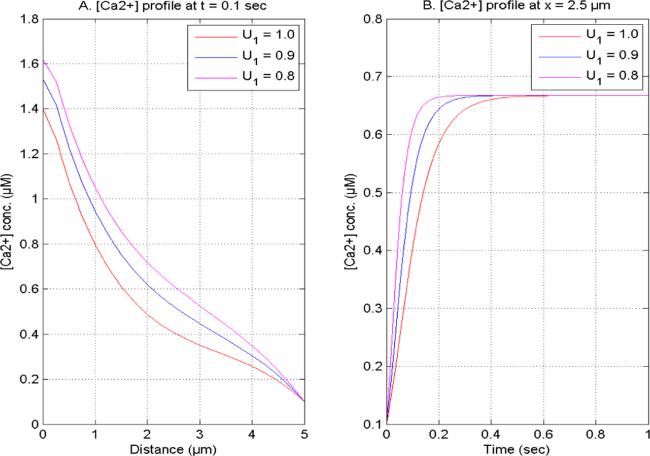
Figure 5. [Ca2+] concentration at U2 = 1.0, V1 and V2 = 2.0 concerning distinct [Ca2+] time fractional derivatives (A) t = 0.1 s (B) x = 2.5 μm. |
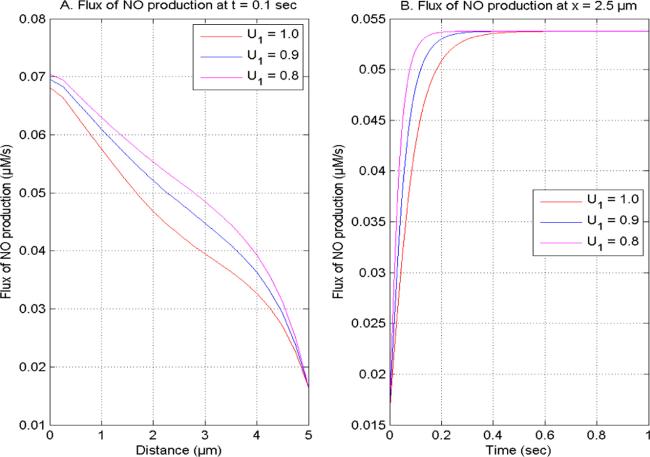
Figure 6. NO generation flux at U2 = 1.0, V1 and V2 = 2.0 concerning distinct [Ca2+] time fractional derivatives (A) t = 0.1 s (B) x = 2.5 μm. |
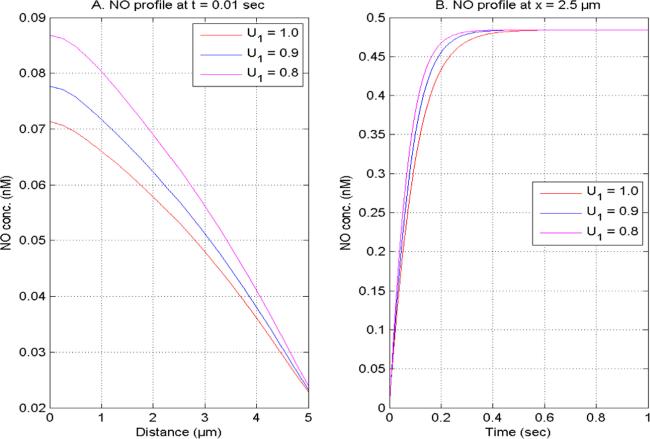
Figure 7. NO concentration at U2 = 1.0, V1 and V2 = 2.0 for time (0.01 s) and site (2.5 μm) concerning distinct [Ca2+] time fractional derivatives. |

Figure 8. [Ca2+] concentration with U2 = 1.0, V1 and V2 = 2.0, buffer 75 μM at x = 0 μm for distinct [Ca2+] time fractional derivatives. |
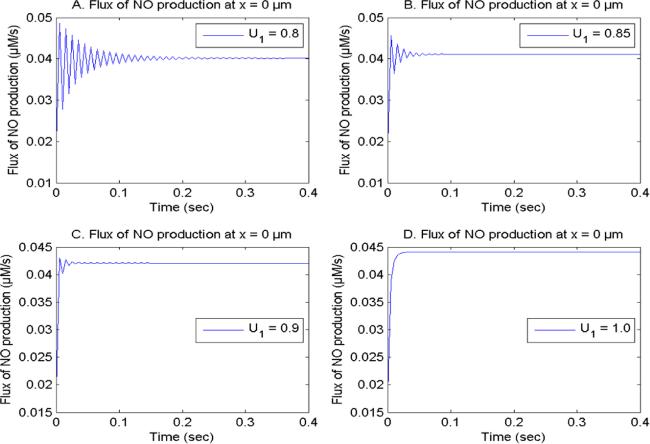
Figure 9. NO formation flux with U2 = 1.0, V1 and V2 = 2.0, buffer 75 μM at x = 0 μm for distinct [Ca2+] time fractional derivatives. |
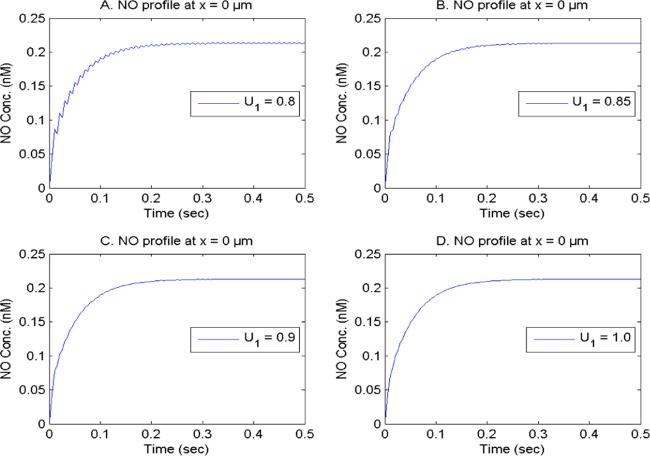
Figure 10. NO concentration with U2 = 1.0, V1 and V2 = 2.0, buffer 75 μM at x = 0 μm for distinct [Ca2+] time fractional derivatives. |
Table 2. The analysis of absolute relative approximate errors for [Ca2+] and NO concentrations utilizing GS iterations at distinct positions. |
| Absolute relative approximate errors for [Ca2+] | Absolute relative approximate errors for NO | |||||
|---|---|---|---|---|---|---|
| Itr | 0 μm | 0.5 μm | 1.0 μm | 0 μm | 0.25 μm | 1.0 μm |
| 10 and 11 | 0.092891% | 0.1% | 0.1% | 9.45% | 9.43% | 9.48% |
| 20 and 21 | 0.94357 $\times $ 10−5% | 0.10199 $\times $ 10−4% | 0.90226 $\times $ 10−4% | 5.2% | 5.26% | 5.28% |
| 100 and 101 | 0.0% | 0.0% | 0.0% | 1.83% | 1.83% | 1.82% |
| 500 and 501 | 0.0% | 0.0% | 0.0% | 0.15% | 0.15% | 0.15% |
Table 3. [Ca2+] concentrations compared to Wagner et al [80] at 50 s. |
| Site (μm) | [Ca2+] concentrations (Wagner et al [80]) | [Ca2+] concentrations (current findings) |
|---|---|---|
| 0 | 1.350 000 000 000 00 | 1.349 532 787 423 240 |
| 0.5 | 1.232 315 089 570 071 | 1.247 780 196 638 780 |
| 1.0 | 1.115 735 369 664 420 | 1.132 627 546 781 410 |
| 2.0 | 0.878 398 878 928 465 | 0.904 465 212 671 969 |
| 3.0 | 0.628 405 963 029 872 | 0.661 742 116 024 014 |
| 4.0 | 0.366 529 266 967 666 | 0.391 925 819 057 789 |
| 5.0 | 0.100 000 000 000 000 | 0.100 000 000 000 000 |
Table 4. Minimum and maximum values of few parameters of [Ca2+] and NO dynamics for sensitivity analysis. |
| Parameters | Minimum values | Maximum values | Sensitivity to [Ca2+] | Sensitivity to NO |
|---|---|---|---|---|
| P0 | 0.0 | 1.0 | 68.14% | 29.93% |
| DCa(μm2s−1) | 16 | 32 | 32.89% | 3.80% |
| [IP3] (μM) | 0.16 | 3.0 | 20.44% | 6.35% |
| VIPR (s−1) | 0 | 8.5 | 23.82% | 7.61% |
Conclusion
| i | (i) The superdiffusion of calcium ions decreases calcium levels, which further reduces the NO production in neurons. The decrease in the formation of NO causes a decrease in nitric oxide levels in neurons. The occurrence of superdiffusive behavior might be observed when the concentrations of calcium and NO are not at appropriate levels within neuronal cells. The numerical results indicate that calcium ions and NO molecules exhibit a superdiffusion process in neuronal cells under neurotoxic conditions, leading to a decrease in their concentration levels. The transition from normal diffusion to superdiffusion occurs in all these cases as a result of cell development and death. Thus, the disturbances in the superdiffusion of calcium ions process can lead to dysregulation in the [Ca2+] and NO signaling by elevating [Ca2+] and NO levels, which are associated to several neuronal illnesses like Parkinson’s and Alzheimer’s. |
| ii | (ii) The cell memory effect of calcium ions enhances calcium levels, which further increases nitric oxide production as well as NO concentration in neurons. The elevated [Ca2+] and nitric oxide levels may result in neurotoxicity in the form of Alzheimer’s, ischemia, and other neurodegenerative diseases. |
| iii | (iii) The higher buffer levels with cell memory leads to the dysregulation in the [Ca2+], NO production and NO concentration in the form of fluctuations. These disturbances in the [Ca2+] and NO levels due to the dysregulation in the buffer capacity are linked to various neurological diseases such as Alzheimer’s. |