


1. Introduction
Water is one of the most common and abundant substances in nature. The majority of water exists in its bulk form, and plays a significant role in biology, environmental science and geology [1–9]. In everyday life, water undergoes phase transitions under the influence of external factors, including temperature and pressure. The phase transition of water has always been a focus in the field of water studies [10]. When liquid water condenses, it forms a bulk ice composed of tetrahedrally coordinated water molecules, which has a polycrystalline structure. Although the tetrahedral geometry in block ice is almost perfect and satisfies the ice rules (each water molecule forms four hydrogen bonds with the adjacent water molecules, and each water molecule acts as both a hydrogen bond donor and acceptor) [11], deformation occurs under confined conditions. In confined spaces with varying distances and scales, the structure of water is destroyed and the hydrogen bond network is rearranged, resulting in complex phase behavior [12, 13]. Extensive studies have reported that variations in the distance between the parallel plates and the magnitude of applied lateral pressure in two-dimensional parallel plate nanochannels can induce the emergence of different ice phases, including square monolayer ice [14–16], bilayer ice [17, 18], low-density/high-density amorphous ice [13, 17, 19], hexagonal ice [20, 21], trilayer ice [22], etc [23–25]. So far, nearly 20 different ice phases have been observed in experiments.
Since water molecules are polar molecules, the phase of water will transform under the influence of an electric field. Svishchev and Kusalik used the TIP4P water model to investigate the electric freezing of supercooled liquid water by molecular dynamics simulations. Results revealed that an electric field of 5 V nm−1 at 250 K in a confined environment would promote the crystallization of liquid water [26]. Zangi and Mark showed that a uniform external electric field of 5 V nm−1 parallel to the confined plates can cause water to freeze, a phenomenon known as electric freezing. The main reason for electric freezing is rearrangement of the dipoles of water molecules induced by the electric field. In addition, the external electric field also plays a distinct role during the process of ice formation [27]. Qiu and Guo found that the application of an electric field perpendicular to the plate leads to ice formation followed by melting, due to the disruption of the ordered hydrogen bond network caused by the electrically induced interaction among water molecules [28]. Fu et al also demonstrated that electric fields affect the structure and phase transitions of water within single-walled carbon nanotubes. Water condenses into different helical ice phases under different electric fields, leading to a continuous solid-to-solid phase transition within the carbon nanotube. This phenomenon arises from the interactions between water molecules, hydrogen bonds and water dipole orientation [29]. Experiments have also shown that electric fields influence the phase transition of ice. Zhang et al applied an electric field of 105 V m−1 to two different copper foil materials with various coatings and observed significant promotion of ice nucleation [30]. Choi et al showed that at room temperature, an electric field of 106 V m−1 induces a reversible transformation of interfacial water to the ice phase [31].
Most naturally occurring electric fields are often fluctuating, for instance the presence of charged residues in biological channels can cause perturbations [32–35]. Kou et al, using molecular dynamics simulations, found that charge disturbances have a significant influence on the flow of water molecules inside a channel [36]. By perturbing local atoms in carbon nanotubes and coordinating hydrophilic–hydrophobic vibrations, it has been found that water molecules in nanochannels flow directionally [37, 38]. Inspired by these studies and the unique phenomena in the confined nanochannel under electric fields, we apply varying electric fields to water molecules confined in nanochannels and find a relationship between the frequency of the varying electric field and the phase transition of confined water using molecular dynamics simulation methods. In the range of low or high frequency, the confined water molecules in the nanochannels maintain their original phase state. When the frequency of the varying electric field approaches the inherent frequency of hydrogen bonds of the water molecules, the water molecules dissolve and a phase transition occurs.
2. Model and methods
The simulation system consists of two layers of graphene sheets and 2040 water molecules, as shown in inset (bottom) in figure 1. The size of each graphene sheet is 10.10 nm × 10.22 nm in the x–y plane. Unless otherwise specified, the distance d between the sheets remains at 0.95 nm [39], which was chosen based on the stable ice structure formed by water molecules. The graphene sheets are fixed during the simulations. To study the effect of a varying external field on the phase state of the confined water molecules, we applied a varying electric field perpendicular to the interface of the graphene, which can be expressed as E(t) = E0cos (2πft + φ), where E0 is the fundamental electric field strength, f is the varying frequency of the electric field and φ is the initial phase. In this study, we set E0 = 0.5 V nm−1 and φ = 0. The choice of electric field intensity was based on the fact that an electric field of less than 0.4 V nm−1 has almost no effect on the dipole of water molecules [40–42], the liquid water will transform into solid state when the electric field strength is greater than 1.0 V nm−1 [26] and the phase transition of water in the nanochannel will occur at an electric field strength above 2.5 V nm−1 [28].
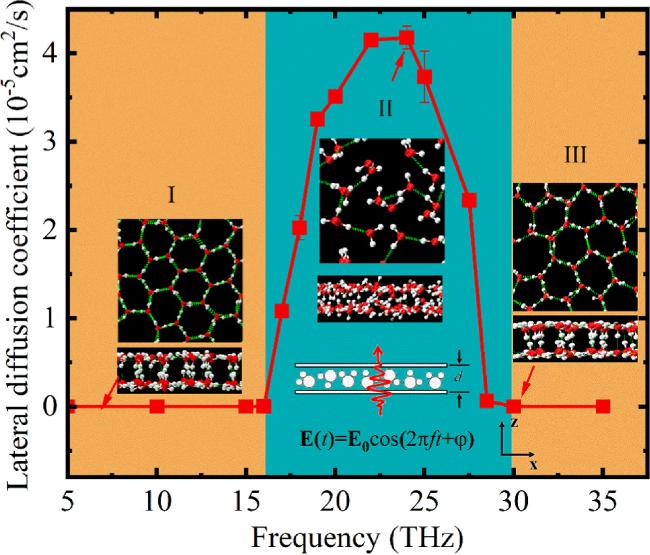
Figure 1. Diffusion coefficient of confined water molecules as a function of the frequency of the electric field. Three insets (I, II and III) show the distribution of water molecules in the confined nanochannels at electric field frequencies of 10 THz, 24 THz and 30 THz, respectively. The white and red spheres in the insets represent hydrogen and oxygen atoms, respectively, while the green lines indicate hydrogen bonds. The bottom inset schematically shows the simulation setup. |
All simulations were performed using the GROMACS 5.1.5 software package [43] and in the NPxyT system ensemble with optimized potentials for liquid simulation all-atom (OPLS-AA) force field [44]. A V-rescale thermostat was used to maintain the system at a fixed temperature (T = 240 K) [45]. The semi-isotropic Berendsen pressure coupling method was used to control the lateral pressure of the system at 1 bar [46]. The non-bonding interactions between all atoms were described by using the Lennard-Jones potential and Coulomb potential interactions. The water molecules were described by using the flexible TIP4P water model, which is widely used in the study of phase transitions, and the obtained results are consistent with experiments [47]. The graphene atoms were modeled by uncharged Lennard-Jones particles with a cross-section of σc.c. = 0.355 nm and ϵi,j = 0.2325 kJ mol−1 [48]. The Lorentz−Berthelot mixing rules [49, 50], i.e. σc.c. = (σi,i + σj,j)/2 and ϵi,j = (ϵi,iϵj,j)1/2, were applied to compute the Lennard-Jones parameters between different molecules. A cutoff distance of 1.4 nm [51] was used for the van der Waals interactions. The electrostatic interactions were calculated using the particle mesh Ewald method with a fast Fourier transform grid spacing of 0.16 nm and a cutoff distance of 1.4 nm. The periodic boundary conditions were employed in the x and y directions and a large vacuum layer was set in the z direction to avoid the influence of the opposite interface. Each simulation lasted at least 30 ns, with a time step of 2.0 fs [52]. The results of the last 20 ns of the simulation were collected for analysis.
For a system in thermodynamic equilibrium, linear response theory allows us to relate the natural fluctuation spectrum of the dipole moment to its response spectrum to an external oscillating field. In molecular dynamics simulations, the classical infrared absorption cross-section I(ω) can be obtained from the dipole moment M(t) as follows [53–56]:
$\begin{eqnarray}\begin{array}{l}I\left(\omega \right)=\left(\frac{4{\pi }^{2}{\omega }^{2}}{3{k}_{{\rm{B}}}{cnT}}\right)\\ \,{\rm{\times }}\left\langle \mathop{\mathrm{lim}}\limits_{\tau \to {\rm{\infty }}}\frac{1}{\tau }\bullet \displaystyle \sum _{\alpha =x,y,z}{\left|{\int }_{0}^{\tau }{\rm{d}}t\bullet \exp ({\rm{i}}\omega t){{\boldsymbol{M}}}_{\alpha }(t)\right|}^{2}\right\rangle ,\end{array}\end{eqnarray}$
where ω is the angular frequency, T is the system temperature, n is the refractive index, and kB is the Boltzmann constant. Hence, the infrared absorption spectrum of confined water molecules can be obtained through Fourier transform of the ensemble-averaged dipole moment autocorrelation function $\lt {\boldsymbol{M}}(0)\bullet {\boldsymbol{M}}(t)\gt .$ To eliminate the effects of coordinate discontinuity caused by periodic boundary conditions during the simulation, dM is replaced with dM/dt, where ${\rm{d}}{\boldsymbol{M}}{\boldsymbol{/}}{\rm{d}}t{\boldsymbol{=}}{\sum }_{i}{q}_{i}{{\boldsymbol{v}}}_{{i}}$ (${q}_{i}$ and ${{\boldsymbol{v}}}_{{i}}$ represent the charge and velocity of the ith atom, respectively), and simultaneously the factor ${\omega }^{2}$ within $I\left(\omega \right)$ is set to 1. To calculate the infrared absorption spectrum of confined water molecules, we take the final structure of the system after a 100 ns equilibration simulation as the initial configuration. The simulation was performed for 1 ns with a time step of 1 fs, and coordinates and velocities of all atoms were collected every 2 fs for analysis.3. Results and discussion
When water molecules are confined to a specific nanochannel, a certain phase structure will be formed at a specific pressure and temperature [57]. Here, we first applied a pressure of 0.1 MPa to the above confined system without an electric field and kept the temperature at 240 K. After simulation for 100 ns a stable bilayer hexagonal ice phase structure was obtained, as shown in inset I in figure 1, which was first found by Koga et al [58]. The hexagonal ice phase structure was chosen as the initial configuration. Then, an electric field was applied to the system at different frequencies, and each simulation was performed for 30 ns. The results of the last 20 ns of the simulation were collected for analysis.
To describe the phase behavior of the confined water, we calculated the diffusion coefficients of the confined water at different frequencies of varying electric field, as shown in figure 1. It can be seen that the diffusion coefficient of the confined water molecules is very sensitive to the change of the electric field frequency f. When f is less than 16 THz, the diffusion coefficient of the confined water molecules remains almost unchanged and its value is equal to that of the confined water without an electric field, which means that the water molecules remain frozen and have a hexagonal structure (see inset I in figure 1). When f is in the range of 16 THz $\leqslant $ f $\leqslant $ 30 THz, the diffusion coefficient of the confined water first increases and then decreases. It can be seen that as f approaches 24 THz, the diffusion coefficient reaches a maximum, which is five orders of magnitude higher than that in the low-frequency range, almost approaching the diffusion coefficient of liquid water. It is found that some of the water molecules in the confined nanochannel exhibit an ice-like structure as the frequency increases from 16 to 24 THz. Moreover, as the frequency of the electric field approaches 24 THz, the ice in the confined nanochannel is completely melted (see inset II in figure 1). When the frequency of the electric field continues to increase and exceeds 30 THz, the diffusion coefficient of the confined water molecules decreases to the minimum and is close to that of the confined water molecules without an electric field, and the water molecules inside the confined nanochannel again present an ice structure, as shown in inset III in figure 1.
To understand the structural transition of confined water molecules in a nanochannel at different electric field frequencies, we calculated the transverse density distribution, the dipole distribution and the radial distribution of water molecules in the nanochannel at three typical electric field frequencies, as shown in figure 2. It can be seen from figure 2(a) that there is a peak in the water molecule density near the wall and two smaller peaks appear near the center of the nanochannel under electric fields with frequencies of 10 THz and 30 THz. The distributions are almost the same, except that the peak value reduces slightly at 30 THz. The peak of water molecule density indicates that the water molecules are confined near the wall, where the number of water molecules increases and they are arranged more closely. When the electric field frequency is close to 24 THz, the two peaks near the wall decrease and the distribution of the two peaks becomes wider, indicating that the water molecules are arranged more loosely.
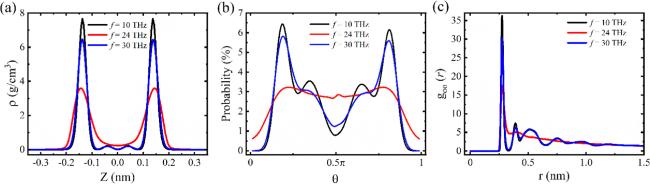
Figure 2. (a) Density distribution, (b) dipole distribution and (c) oxygen–oxygen radial distribution of confined water molecules in a nanochannel at three typical frequencies. |
Figure 2(b) shows the dipole angle (θ) distribution of water molecules; this represents the angle between the dipole of the water molecule and the normal direction of the interface. For frequencies of 10 and 30 THz, two peaks occur near 35° and 145°, and minima occur at 0° and 180°, corresponding to the dipoles perpendicular to the interface, i.e. the oxygen and hydrogen atoms in water molecules tend to be close and away from the interface, respectively. In addition, secondary peaks, which are more pronounced at 10 THz, appear near 64° and 116°, where some of the hydrogen atoms are close to the interface. This is attributed to the 10 THz electric field forcing atoms at the interface into tighter alignments. Consequently, due to spatial constraints, the dipoles of some water molecules cannot maintain their usual orientation away from the interface, resulting in the hydrogen atoms of these molecules being positioned closer to the interface. When f = 24 THz, the dipole angles are mainly between 20° and 160°, which indicates that the dipoles of the confined water molecules are almost randomly distributed, confirming the loss of structural order. The distribution is similar to that of the bulk water, suggesting that the confined water molecules transform into liquid water [59].
The oxygen–oxygen radial distribution functions goo(r) of water molecules are shown in figure 2(c). It can be seen that there exist a series of distinct peaks and valleys in goo(r) at frequencies of 10 and 30 THz. The first peak of goo(r) is the highest at 10 THz, indicating that the water molecules are tightly bound to the surrounding water molecules and the hydrogen bond interactions are strong. In other words, the system exhibits a high-order ice phase at this point, suggesting that the diffusion coefficient is small, as shown in figure 1. When f = 24 THz, the first and second peaks of goo(r) decrease with the increasing r and the third and fourth peaks disappear, showing the microstructural characteristics of short-range order and long-range structural disorder, in accordance with the arrangement of the liquid molecules [60].
The hydrogen bond network plays a crucial role in the phase state of water molecules [61, 62]. To understand the change in the phase state of water molecules in the nanochannels with electric field frequency, we calculated the average number of hydrogen bonds of water molecules at different electric field frequencies, as shown in figure 3(a). The formation of hydrogen bonds is determined by the following geometric criterion: if the distance between two oxygen atoms is shorter than 0.35 nm and the angle of O–H···O is less than 30°, it is considered that hydrogen bonds are formed between two adjacent water molecules [63]. As shown in figure 3(a), the variation of the average number of hydrogen bonds of water molecules is almost opposite to that of the diffusion coefficient of confined water molecules with electric field frequency. When f < 16 THz or f > 26 THz, there are more hydrogen bonds and water molecules are in the stable ice phase. On the contrary, when 16 THz $\leqslant $ f $\leqslant $ 26 THz, the average number of hydrogen bonds decreases and reaches a minimum at 24 THz. These results suggest that the hydrogen bonds and phase transition of confined water are closely related to the frequency of the electric field. As is known, the dipole of a water molecule is aligned with the direction of the electric field [38, 64]. It has been reported that the hydrogen bond formed between two adjacent water molecules fluctuates with an amplitude of 0.2 Å [65]. Resonance theory suggests that most of the hydrogen bonds of water molecules will break when the frequency of the electric field is close to their inherent frequency. Therefore, water molecules are ice-like at lower or higher frequencies and liquid-like at a specific frequency when the hydrogen bonds break. As the frequency is close to the resonance frequency of the hydrogen bonds, some of the hydrogen bonds break and a mixed phase of ice and liquid water appears.
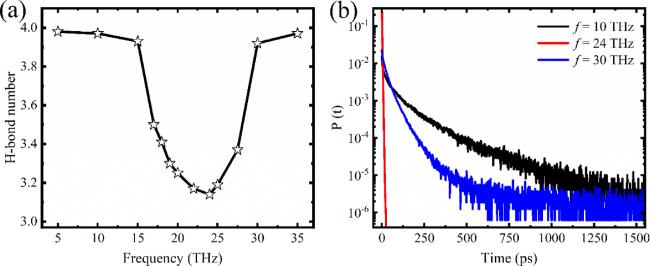
Figure 3. (a) Average number of hydrogen bonds (H-bonds) and (b) probability distribution P(t) of the hydrogen bond lifetime of confined water molecules in a nanochannel under electric fields with different frequencies. |
We analyzed the probability distribution P(t) of the lifetime of hydrogen bonds [66] of water molecules at the three specific frequencies, as shown in figure 3(b). The results shows that the hydrogen bonds break at all three frequencies but the breaking time is different. At the ice-melting frequency mentioned above (f = 24 THz), the hydrogen bonds of water molecules decay significantly faster than at the other two frequencies, suggesting that the melting frequency can cause the hydrogen bonds to break rapidly. The lifetime of the hydrogen bonds is longest at the low frequency (f = 10 THz), which indicates that the hydrogen bond network in the ice phase is the most stable, and verifies that the number of liquid hydrogen bonds is less than that in the ice phase, as mentioned above.
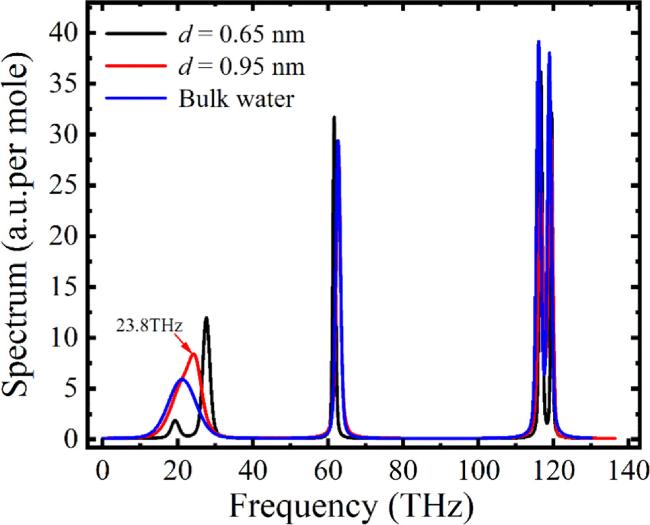
In the classical approximation, we calculated the vibration spectra of water molecules at different interlayer distances d, as shown in figure 4. It is found that the three peaks are generated by interaction between water molecules or between atoms within a water molecule. Specifically, the three peaks are produced by the stretching vibration of the hydrogen bonds between two adjacent water molecules, the bending vibration of the bond angle formed by three atoms in a water molecule, and the stretching vibration between the hydrogen and oxygen atoms in a water molecule, respectively. In addition, figure 4 illustrates that the three peaks are in the terahertz frequency range. Specifically, when d = 0.95 nm, the first peak appears at 23.8 THz, which is almost the same as the frequency of 24 THz where the diffusion coefficient reaches the maximum reported in the literature, suggesting that the melting of water molecules in the ice phase at a frequency of 24 THz mentioned above is the result of the vibration of the hydrogen bonds of the confined water molecules. This also indicates that the frequency of 24 THz is close to the inherent frequency of the hydrogen bonds of water molecules. The spectrum also shows that there is little effect on the phase transition of the confined water molecules when the frequency of the external electric field is below 16 THz or above 30 THz. In other words, when the frequency of the electric field is far from the resonant frequency of the hydrogen bonds, the influence of the electric field on the phase transition is small. Due to limitations of the simulated data storage frequency, only cases with a frequency less than 35 THz are studied in this work. As can be seen from figure 4 that phase transition of water molecules will also occur when the electric field frequency is at 60 THz or 120 THz. The spectral lines are not coincident, demonstrating that the confinements are not the same. Compared with bulk water, when the confined nanopore spacing d = 0.65 nm, water molecules in the channel exist as a single layer of ice with a characteristic absorption peak at approximately 27 THz; when the spacing increases to d = 0.95 nm, they show double-layer hexagonal ice with a peak at 23.8 THz. This indicates that as the confined spacing decreases, the characteristic absorption peak tends to shift to the right. The vibration spectrum of bulk water is approximately 20 THz, which is consistent with the experimental test results [67].
Figure 4. The vibration spectra of confined water at different interlayer distances d. |
4. Conclusion
In summary, using molecular dynamics simulations we found a relationship between the phase transitions of confined water molecules and the varying frequency of an external electric field. Ice confined in a nanochannel transforms into liquid when the electric field frequency gets close to the inherent frequency of hydrogen bonds of the water molecules. The phase transition is attributed to the resonance between the electric field and the hydrogen bond network of the two-dimensional confined water molecules, which results in the breaking of hydrogen bonds between water molecules and an increase in the diffusion coefficient. This work revealed a new mechanism of water phase transition and may have potential applications in preventing icing or in deicing.