


1. Introduction
In recent years, carbon-based materials have attracted widespread attention. There has been plenty of research on graphene in many diverse studies since graphene with a honeycomb structure was discovered in 2004 [1–3]. In recent years, the optimization of splitting technology has brought new breakthroughs to the extraction and preparation of graphene. In 2014, some scholars prepared defect-free, unoxidized graphene-containing liquids [4], opening the way to the study of conductive graphene films with high resistance and ductility [5], as well as low-defect graphene nanogrids manufactured by non-lithographic methods with both spintronic and magnetic properties [6]. Graphene has been found to exist in a variety of forms, including a continuous single-layer sheet structure [7], multilayer structures [8], graphene superlattices [9], nanoscale graphene [10] and many others. Thus, graphene is widely applied in biosensors [11], linear magnetoresistivy [12] and other fields.
The Ising model has been widely used as a classic model to describe various two- and three-dimensional magnetic materials [13–15]. For example, using various numerical methods such as effective-field theory (EFT) and Monte Carlo (MC) simulation, the Ising model can be used to understand in detail the magnetism of layered graphene structures [16–18]. Generally, intrinsic graphene does show magnetism, but hybrid graphene may be made magnetic by various treatments such as heteroatom doping [19], hydrogenation [20] and nitrogen-substituted molecules [21]. Ising models with fractional spin values have also recently received close attention from numerous researchers. For example, Masrour and colleagues successfully employed the MC method to discover rich magnetic characteristics of various graphene structures such as monolayers [22, 23] bilayers [24–26] and ribbons [27, 28]. In addition, EFT was used to explore unique magnetic characteristics, including magnetization plateaus, and thermodynamic properties in bilayer [29] and trilayer [30] graphene-like films. Using the retarded Green's function method and linear spin-wave approximation, Heisenberg models were established to study the low-temperature properties of graphene-like bilayer systems [31, 32]. The above results demonstrate that exchange coupling and crystal fields play important roles in the magnetic properties of the graphene-like films.
In our previous work, the magnetic behaviors of different graphene structures were studied within the MC method [32–37]. There has not yet been a detailed exploration of the distinctive magnetic and thermodynamic properties of ferrimagnetic graphene-like trilayers. Additionally, the compensation temperature and multi-loop hysteresis behaviors have great potential for applications in sensors and magnetic recording. Therefore, in this work, to broaden their applications, we aim to investigate the compensation temperatures and hysteresis behaviors of a ferrimagnetic mixed-spin (1, 5/2) graphene-like trilayer, focusing on magnetization, magnetic susceptibility, phase diagrams of compensation and critical temperatures, and the hysteresis loop caused by different parameters. The paper is presented as follows: section 2 mainly describes the model and MC simulation diagram, section 3 discusses and analyzes the obtained results and section 4 gives a summary of the work.
2. Model and method
Both experimental and theoretical investigations on graphene have successfully demonstrated that primitive non-magnetic graphene can exhibit magnetic properties by doping or replacement of magnetic transition metal atoms [38–41]. Among these successfully synthesized or predicted materials, the magnetic atoms Ni or Zn, and Fe have spin values of 1, and 5/2, respectively, which provides a good basis for a graphene-like trilayer with mixed spins of 1 and 5/2. Figure 1 depicts a graphene-like trilayer consisting of sublattices a (red balls) having spin 1 and sublattices b (blue balls) having spin 5/2. The Hamiltonian of the system is as follows:
$\begin{eqnarray}\begin{array}{l}H=-{J}_{a}\displaystyle \sum _{\langle m,n\rangle }{\sigma }_{m}^{Z}{\sigma }_{n}^{Z}-{J}_{b}\displaystyle \sum _{\langle i,j\rangle }{S}_{i}^{Z}{S}_{j}^{Z}-{J}_{{ab}}\displaystyle \sum _{\langle m,i\rangle }{\sigma }_{m}^{Z}{S}_{i}^{Z}\\ -{D}_{a}\displaystyle \sum _{m}{({\sigma }_{m}^{Z})}^{2}-{D}_{b}\displaystyle \sum _{i}{({S}_{i}^{Z})}^{2}-h(\displaystyle \sum _{m}{\sigma }_{m}^{Z}+{S}_{i}^{Z}).\end{array}\end{eqnarray}$
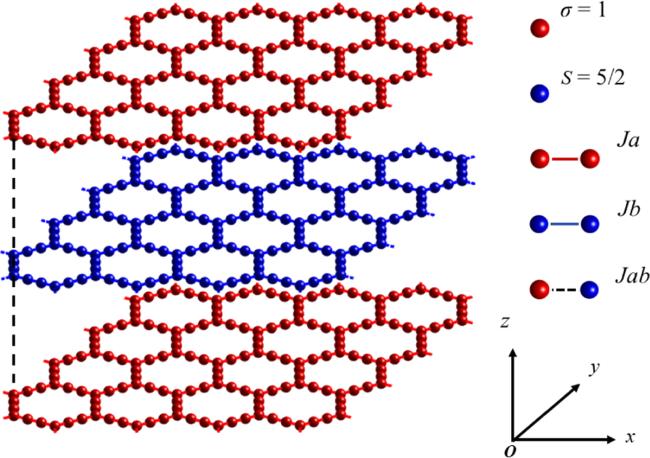
Figure 1. Schematic of a ferrimagnetic mixed-spin (1, 5/2) graphene-like trilayer two-dimensional structure. |
The spin variable and spin values of sublattice a are σ = ± 1, 0 and those of sublattices b are S = ± 5/2, ± 3/2, ± 1/2. In addition, (Ja > 0) and (Jb > 0) are the intralayer exchange couplings between two sublattices a and between two sublattices b. Here, we select Ja as the unit of energy and temperature, which takes the value of Ja = 1. Jab(Jab < 0) is the interlayer exchange coupling between sublattices a and b. Da and Db are the crystal fields of sublattices a and b, respectively. h is the applied magnetic field.
We employed the MC method within the Metropolis algorithm [42]. The periodic boundary condition was set along the surface and the free condition along the thickness of the trilayer. We scanned the rotation for all spins randomly in each MC step. For a more intuitive understanding of the MC simulation process, the MC simulation flow diagram is shown in figure 2. Additionally, figure 3 presents the variations of the magnetization (M) versus MC steps with fixed Jab= −0.6, Jb = 0.5, Da = −0.5 and Db = −0.8. From figure 3, it can be seen that the fluctuation trend of M gradually becomes smooth when the number of MC steps is ≥ 2 × 10⁵. Consequently, to balance the system, the previous 2 × 10⁵ MC steps were discarded, leaving the subsequent 3 × 10⁵ MC steps to perform calculations. The jackknife method was used to determine the error bars [43, 44]. All the measurements were taken then grouped into 10 blocks. In addition, in order to check the finite size, we continued to do some simulations. We defined N as the total number of spins in the trilayer. Since when N ≥ 3420 no distinct difference is found in the results for the thermodynamic quantities, the value of N was set to 3420. The relevant thermodynamic quantities are as follows:
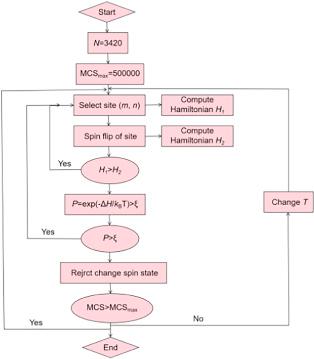
Figure 2. The flow diagram of Monte Carlo simulation (MCS, Monte Carlo steps). |
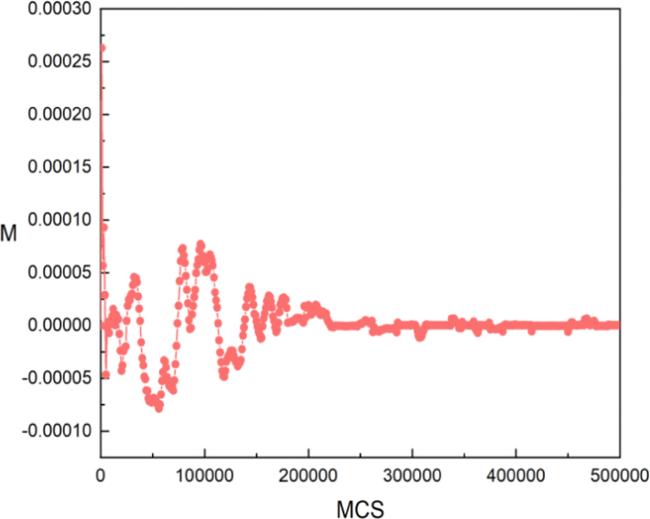
Figure 3. The magnetization M versus Monte Carlo steps (MCS) for Jab = −0.6, Jb = 0.5, Da = −0.5 and Db = −0.8. |
The internal energy of the whole system per spin can be calculated by
$\begin{eqnarray}U=\displaystyle \frac{1}{N}\left\langle H\right\rangle .\end{eqnarray}$
The partial magnetizations of sublattices a and b per spin are
$\begin{eqnarray}{M}_{a}=\displaystyle \frac{1}{{N}_{a}}\displaystyle \sum _{m=1}^{{N}_{a}}{\sigma }_{m}^{z},\end{eqnarray}$
$\begin{eqnarray}{M}_{b}=\displaystyle \frac{1}{{N}_{b}}\displaystyle \sum _{i=1}^{{N}_{b}}{S}_{i}^{z},\end{eqnarray}$
where Na and Nb represent the number of sublattices a and b, which we take as Na = 2280 and Nb = 1140, respectively.Therefore, the magnetization of the whole system per spin is
$\begin{eqnarray}M=\displaystyle \frac{{N}_{a}\times {M}_{a}+{N}_{b}\times {M}_{b}}{N},\end{eqnarray}$
The partial magnetizations of sublattices of a and b have opposite directions, and when Ma and Mb cancel each other, M becomes zero, which produces a compensation temperature. This is interpreted by a formula as
$\begin{eqnarray}| {N}_{a}\times {M}_{a}| =| {N}_{b}\times {M}_{b}| ,\end{eqnarray}$
$\begin{eqnarray}{\rm{sign}}\left({M}_{b}\right)=-{\rm{sign}}\left({M}_{a}\right).\end{eqnarray}$
The magnetic susceptibility of the whole system per spin is
$\begin{eqnarray}\chi =\beta \left(\left\langle {M}^{2}\right\rangle -{\left\langle M\right\rangle }^{2}\right),\end{eqnarray}$
where β = 1/kBT. kB stands for the Boltzmann constant. To simplify the calculation, kB is fixed at 1.3. Results and discussion
3.1. Ground-state phase diagram
To obtain innovative results for compensation temperature and variation of the spin configuration of the system we first used the control variable method to explore the ground-state phase diagrams. The purpose of this is to screen out the most appropriate values for each parameter. The ground-state phase diagrams of the graphene-like trilayer with mixed-spin on (Db, Da), (Da, Jb) and (Db, Jb) planes are given in figure 4 by minimizing the energy values. From this figure, it is evident that the multi-phase lines effectively demarcate all magnetic phases. The intersection of the red lines forms a multi-magnetic phase point on which multiple magnetic configurations can coexist. In figure 4(a), 10 stable configurations are observed, namely (∓1, ± 1/2), (∓1, ± 3/2), (∓1, ± 5/2), (0, ± 3/2) and (0, ± 5/2). In figure 4(b), the corresponding ground-state phase diagrams under in the Da and Jb planes are plotted when Jab = −0.6, Db = −0.8 and h = 0. Only eight stable configurations are found: (∓1, ± 5/2), (∓1, ± 3/2), (0, ± 5/2) and (0, ± 1/2). However, for figure 4(c), the number of stable configurations is reduced to six in the (Db, Jb) plane. Thus, it is now obvious that the crystal field effects do change the ground-state configurations of the Ising model.
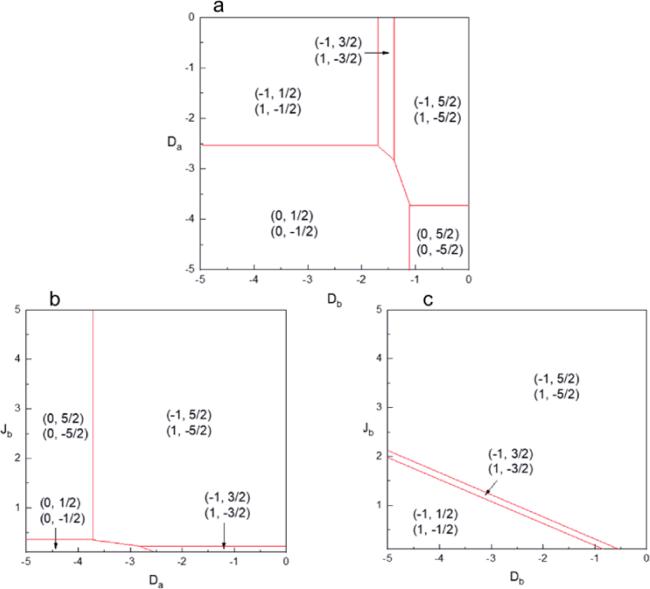
Figure 4. Ground-state phase diagrams: (a) in the (Db, Da) plane for Jab = −0.6, Jb = 0.5 and h = 0, (b) in the (Da, Jb) plane for Jab = −0.6, Db = −0.5 and h = 0 and (c) in the (Db, Jb) plane for Jab = −0.6, Da = −0.5 and h = 0. |
3.2. Magnetic properties
Figure 5 shows the effect of Da on M, Ma, Mb and U when Jab = −0.6, Jb = 0.5 and Db = −0.8. In figure 5(a), we can see that, when it is close to zero temperature, the common saturation value M is equal to 0.167; when the value of Da changes from −0.1 to −1.4, as T increases, M decays to a negative value and then gradually increases to zero, where there are two zero magnetizations, one related to the compensation temperature (Tcomp) while the other should be the critical temperature (TC). This M curve has the N-type characteristic classified in ${\rm{N}}\acute{e}\mathrm{el}$ theory [45]. Changing Da from −0.1 to −1.1, we can see the significant N-type behavior. As $\left|{D}_{a}\right|$ continues to increase, when Da= −2.0, −2.8, the M curve first remains unchanged and then rapidly decreases to 0 as T increases. This discontinuous change in the M curve corresponds to a first-order phase transition. In addition, it should be emphasized that double compensation temperatures may exist when Da = −1.4, as shown in figure 3(a), which is not predicted in ${\rm{N}}\acute{e}\mathrm{el}$ theory [45]. In figure 3(b), we can notice two saturation values of Mb= 2.5 and Ma = −1.0 in the two curves. According to equation (5 ), they are directly related to the saturation values of M shown in figure 5(a). In figure 5(c) there is a peak at each curve, which corresponds to TC, showing a typical second-order phase transition feature. Moreover, it gradually shifts to the right as $\left|{D}_{a}\right|$ decreases. This is consistent with the phenomenon in some magnetic particles [46, 47]. In figure 5(d), we can see that each U curve increases gradually as T increases, and the place where U changes the fastest actually corresponds to TC.
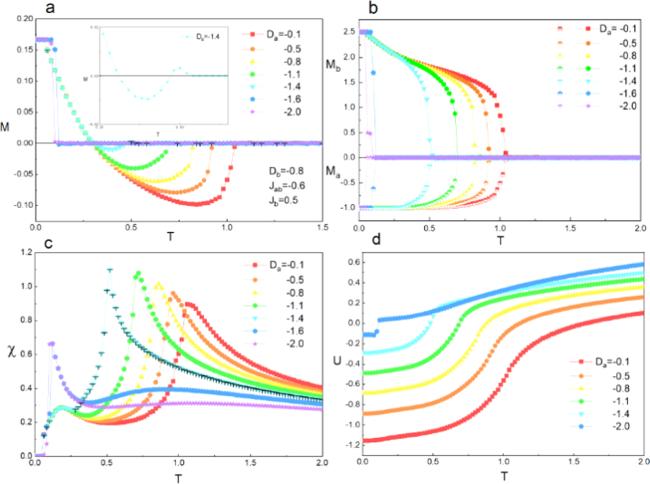
Figure 5. Effect of Da on M, Ma, Mb, χ and internal energy U for fixed Jab = −0.6, Jb = 0.5 and Db = −0.8. |
Figure 6 clarifies how Db affects M, Ma, Mb, χ and U when Jab = −0.6, Jb = 0.5 and Da = −0.5. In figure 6(a), there are multiple saturation values in the M curve, namely near zero temperature, M = 0.167, −0.167 and −0.5, respectively. These saturation values of M come from combination between the values of Mb = 2.5, 1.5, 0.5 and Ma = −1.0 in figure 6(b). The change of Db can affect Mb easily, making the spins of sublattice b flip easily from high spin states to low ones induced by the strong crystal field, and its possibilities for change are abundant, which is why the above saturation values exist in Mb. In addition, there is a smooth peak in the M curve, labeled Db = −0.3, in the low-temperature region. This is mainly a result of competition between the crystal field and temperature. It is worth noting that this novel M behavior has also been reported in experimental observations of graphene [48, 49]. In figure 6(c), the χ curves peak, with their peak also moving to the right as $\left|{D}_{b}\right|$ decreases, which is consistent with the characteristics of χ observed in figure 5(c). Interestingly, χ curves with double peaks can be discovered for Db= −0.8, −1.1, −1.2, and the low-temperature peak results from the thermal fluctuation in the M curve with the same parameters as in figure 6(a). Here, we should mention that the reason we take negative values for Da and Db is because we are studying the magnetic phase transition of the system. The negative increase of Da and Db can promote the occurrence of phase transition because the energy of the system becomes higher, as illustrated in the Hamiltonian (1).
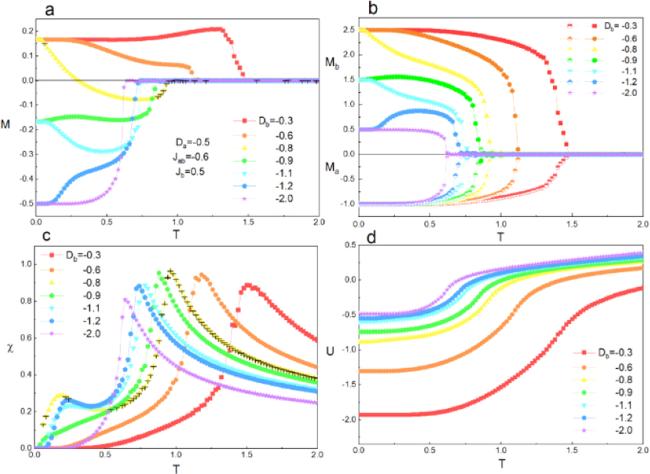
Figure 6. Effect of Db on M, Ma, Mb, χ and U for fixed Jab = −0.6, Jb = 0.5 and Da = −0.5. |
The effect of Jab on M, Ma, Mb, χ and U is shown in figure 7 with Jb = 0.5, Da = −0.5 and Db = −0.8. Three saturation values of the M appear in figure 7(a), and as Jab changes, different types of M curves appear. Looking at figure 7(b), Jab has a greater impact on Mb than Ma, including the saturation values and profiles of the M curves. In figure 7(c) we can see a phenomenon that is exactly the opposite of figures 3(c) and 6(c), where the peak corresponding to the curve moves to the left with decreasing $\left|{J}_{{ab}}\right|$. Finally, in figure 7(d), a lower U can be found at a certain temperature for a stronger Jab, which suggests that exchange coupling has the opposite effect on U to crystal field.
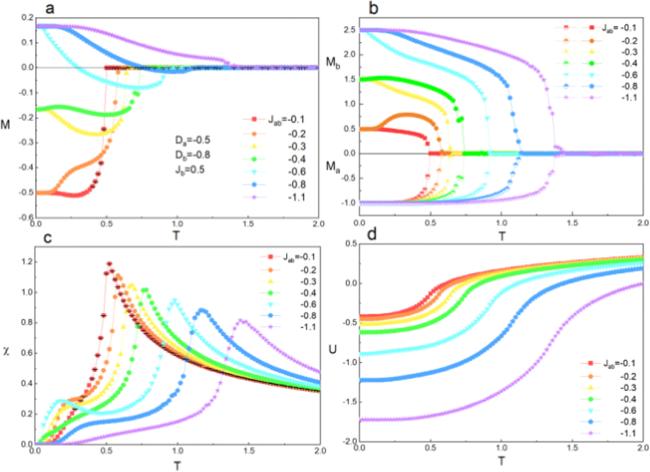
Figure 7. Effect of Jab on M, Ma, Mb, χ and U for fixed Jb = 0.5, Da = −0.5 and Db = −0.8. |
How Jb affects M, Ma, Mb, χ and the U is presented in figure 8 when Jab = −0.6, Da = −0.5 and Db = −0.8. By comparing figures 8 and 7, we find easily that Jb has a similar impact to Jab on these quantities. In addition, the double-peak behavior tends to appear in the curves labeled with smaller values of Jb (=0.1, 0.2, 0.3). Similar results were also found in some other works [50–52].
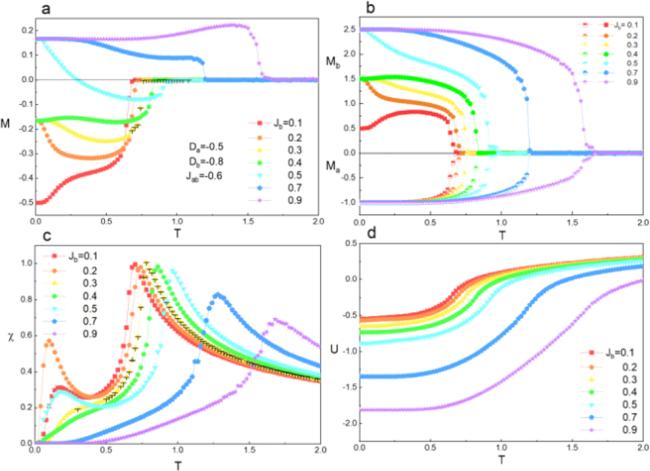
Figure 8. Effect of Jb on M, Ma, Mb, χ and U for fixed Jab = −0.6, Da = −0.5 and Db = −0.8. |
3.3. Phase diagrams
To better illustrate how TC and Tcomp vary with different parameters, figures 9(a)–(d) show the phase diagrams. In each sub-figure, TC and Tcomp are represented by green and orange circles. The diagram is divided by the TC curve into two parts, when T > TC the system is in the paramagnetic phase, conversely it is in the ferrimagnetic phase. In figure 9(a), the tricritical point can be discovered at Da = −2.0, which is the boundary point between first-order phase transition and the second-order one. What is more, we find the possibility of a double compensation temperature for Da = −1.4 and the critical point Da = −1.6 that determines whether the system can show Tcomp under these parameters. Similarly, there are the critical values of other parameters Db = −0.65, Jab = −1.0 and Jb = 0.7 in figures 9(b)–(d), which are demarcation points of the existence of the compensation temperature for the present system. Comparing the effects of four parameters on the compensation temperature we conclude that Da shows an opposite impact on Tcomp to Db since both weak Da and strong Db make Mb with high spin values change faster with temperature than Ma with small values, which favors Tcomp. In addition, the relatively small values of the exchange coupling $\left|{J}_{{ab}}\right|$ and Jb are more favorable for the appearance of Tcomp because the spins flip more easily, strengthened by weak coupling, which also helps Mb to decrease faster than Ma. This phenomenon has also been observed in a 2D Ising layered model structure [53] and an edge-decorated Ising multilayer nanoparticle with graphene-like structure [54]. Besides, TC can be improved by decreasing $\left|{D}_{a}\right|{\text{}},\left|{D}_{b}\right|$ and increasing $\left|{J}_{{ab}}\right|$, Jb.
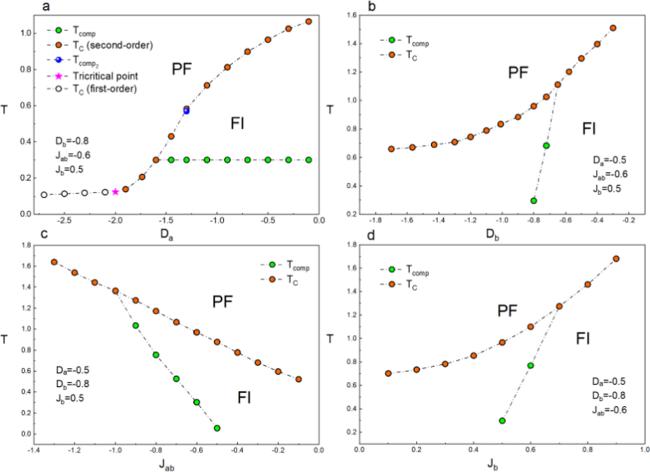
Figure 9. (a). Phase diagram in the (Da, T) plane with Db = −0.8, Jab = −0.6 and Jb = 0.5. (b). Phase diagram in the (Db, T) plane with Da = −0.5, Jab = −0.6 and Jb = 0.5. (c). Phase diagram in the (Jab, T) plane with Da = −0.5, Db = −0.8 and Jb = 0.5. (d). Phase diagram in the (Jb, T) plane with Da = −0.5, Db = 0.8 and Jab = −0.6. PF is paramagnetic phase and FI is ferrimagnetic phase. |
3.4. Hysteresis loops
In figure 10, we illustrate the influence of Da on the hysteresis behaviors of the whole system and sublattices a and b with fixed Jab = −0.6, Jb = 0.5, Db = −0.5 and T = 0.2. From figure 10(a), we can see that triple-loop hysteresis occurs at Da = −0.1, and sublattices a and b show antiferromagnetic coupling to produce the triple loops of the whole system. This is because competition among the external magnetic field, the exchange coupling and the crystal field is the main reason for this triple-loop hysteresis phenomenon. The explanation for this is as follows. On the one hand, the spins of the two different sublattices are arranged in the direction of the external magnetic field. On the other hand, the two sublattices would tend to align antiparallel under the influence of ferrimagnetic exchange coupling. At the same time, the crystal field Da forces the spins of the sublattice to undergo a flip in a weak h. This triple-loop hysteresis behavior has also been observed in a ferrimagnetic mixed-spin Ising trilayer nano-graphene superlattice [55] and Heisenberg ferrimagnetic mixed-spin (1/2, 1) structures [56] using the effective-field approach and approximation method, respectively. Most notably, multi-loop hysteresis behaviors have potential utility in multi-state magnetic recording [57]. When Da = −1.3, −2.1 the whole system exhibits a single loop, and the loop area of both the whole system and the sublattices decreases as $\left|{D}_{a}\right|$ increases. In addition, at low temperature the obvious magnetization plateaus can be clearly seen, reflecting the multiple spin configurations derived from competition between the strong crystal field and applied magnetic field.
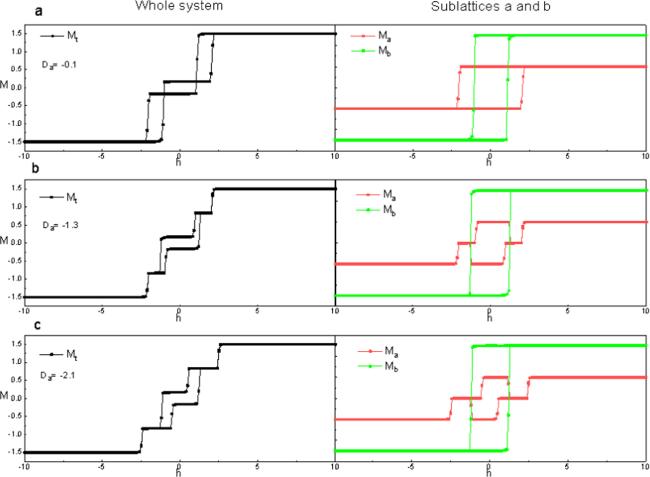
Figure 10. Effect of Da on the hysteresis loops of the whole system and of sublattices a and b for fixed Jab = −0.6, Jb = 0.5, Db = −0.5 and T = 0.1. |
Figure 11 shows the impact of Db on the hysteresis behaviors with fixed Jab = −0.6, Jb = 0.5, Da = −0.1 and T = 0.2. This figure is almost identical to the overall features of figure 10. The coercivity decreases as $\left|{D}_{b}\right|$ increases. This also shows that the crystal field has a negative effect on the coercivity. Moreover, more magnetization plateaus are found, which means that more spin states appear in the system as a result of more spin values in sublattice b driven by the crystal field and magnetic field.
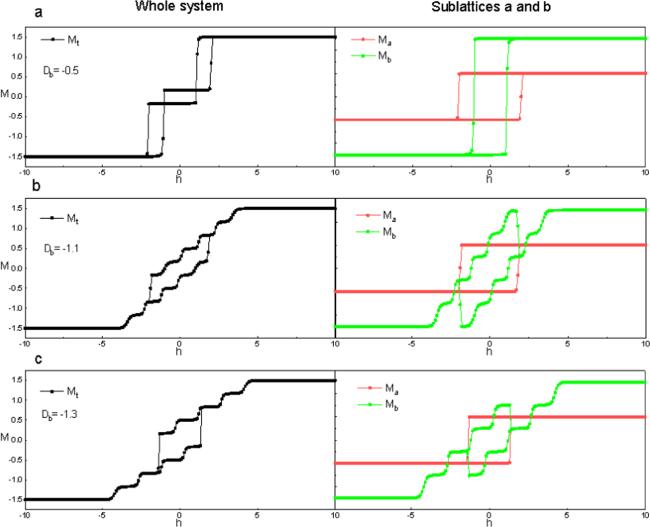
Figure 11. Effect of Db on the hysteresis loops of the whole system and of sublattices a and b for fixed Jab = −0.6, Jb = 0.5, Da = −0.1 and T = 0.1. |
Figure 12 shows how Jab affects the hysteresis loops when Jb = 0.5, Da = −0.1, Db = −0.5 and T = 0.2. In figure 12, it can be observed that the hysteresis loops show hysteresis plateaus, which correspond to different spin configurations. The main reason for this is the competing effects of exchange coupling, applied magnetic field and other parameters. On the one hand, Jab dominates in its effect on the spin configuration of the system when h is relatively weak. On the other hand, the increasing strength of h forces the spins of sublattices to flip and reach the highest spin configuration. For example, for Jab = −0.5 there exist four magnetization plateaus with corresponding spin configurations (−1, −5/2), (1, −5/2), (−1, 5/2) and (1, 5/2) in the simulation results in figure 12(a), which are also obtained from the hysteresis loops of sublattices a and b. However, both the number of hysteresis loops and that of magnetization plateaus are kept constant during the increasing $\left|{J}_{{ab}}\right|$, namely three and four, respectively. At the same time, the loop area gradually increases. Remarkably, although the system always shows triple loops, the reason for the triple loops in the case of a smaller $\left|{J}_{{ab}}\right|$ is different from that for a larger $\left|{J}_{{ab}}\right|$. When $\left|{J}_{{ab}}\right|$ is weak, both sublattices display the single loop in figure 12(b), whereas when $\left|{J}_{{ab}}\right|$ is strong, the hysteresis loops of sublattice a become triple loops and the two small loops on the outside of the whole system actually come from those of sublattice a. Moreover, the coercivity of the system also increases as $\left|{J}_{{ab}}\right|$ increases.
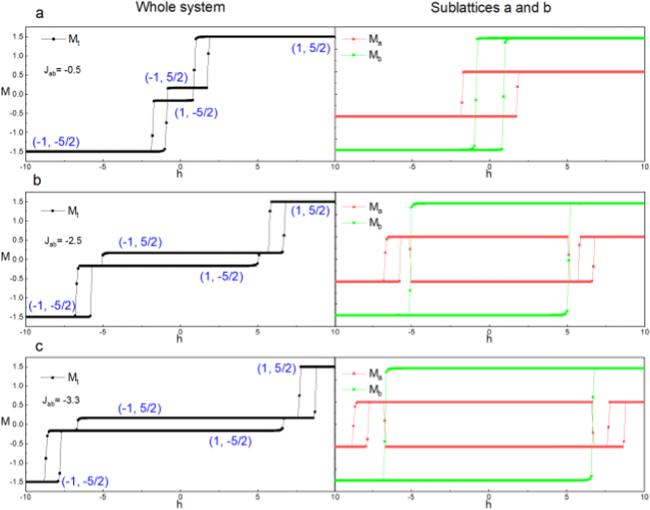
Figure 12. Effect of Jab on the hysteresis loops of the whole system and sublattices a and b for fixed Jb = 0.5, Da = −0.1, Db = −0.5 and T = 0.1. |
Figure 13 presents the influence of Jb on the hysteresis for fixed Jab = −0.6, Da = −0.1, Db = −0.5 and T = 0.2. Enhancing Jb, we find that the loop area of the whole system increases, mainly owing to the significant increase in the loop of sublattice b. The system exhibits the same four spin configurations as in figure 12 throughout the Jb range, namely (−1, −5/2), (1, −5/2), (−1, 5/2) and (1, 5/2). The coercivity also increases, indicating that exchange coupling has a positive effect on the improvement of the coercivity.

Figure 13. Effect of Jb on the hysteresis loops of the whole system and sublattices a and b for fixed Jab = −0.6, Da = −0.1, Db = −0.5 and T = 0.1. |
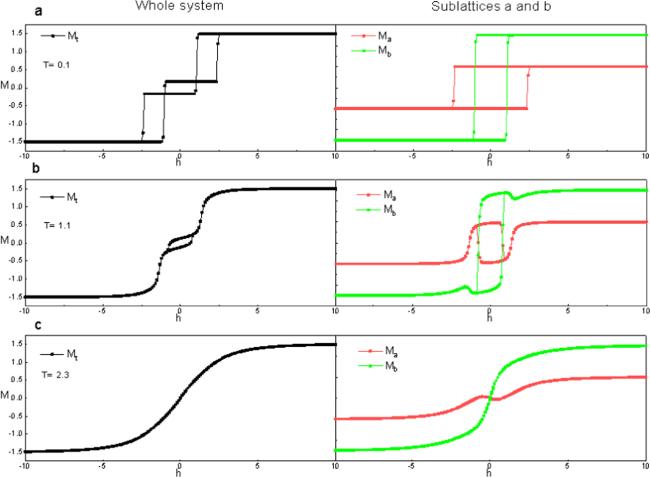
Figure 14 shows the impact of T on the hysteresis loops with Ja = 1.0, Jab = −0.6, Jb = 0.5, Da = −0.1 and Db = −0.5. As T increases, the loop area gradually decreases until T = 2.3, when both loops of the whole system and sublattices disappear. When T > TC, the system exhibits paramagnetic behavior, which indicates that the system is in a disordered state. Therefore, M of the system is completely controlled by the applied magnetic field and temperature, that is a lower applied magnetic field is able to promote higher magnetization. It can be seen that T can weaken the hysteresis characteristics of the system significantly. Several theoretical studies [5, 6, 58–64] and experimental findings [65, 66] have also revealed similar temperature-dependent hysteresis behaviors.
Figure 14. Effect of T on the hysteresis loops of the whole system and sublattices a and b for fixed Jab = −0.6, Jb = 0.5, Da = −0.1 and Db = −0.5. |
4. Conclusion
We employ the Monte Carlo method to discuss the compensation temperatures and hysteresis behaviors of a graphene-like trilayer. By changing the different parameters appropriately, we discover the impacts of exchange coupling and crystal fields on compensation and critical temperatures, as well as hysteresis loops. Interestingly, we find the impossibility of double compensation points and triple-loop hysteresis behaviors in this system. Hopefully, our results will provide valuable for future research on graphene.