


1. Introduction
Einstein and Bose laid the theoretical groundwork for a groundbreaking state of matter known as Bose–Einstein condensation (BEC). This theoretical prediction was later validated by M H Anderson et al, who successfully observed BEC in alkali atomic gas 87Rb for the first time [1]. Since this pivotal discovery, matter-wave solitons in these systems have become the central focus of numerous experimental and theoretical investigations [2]. Subsequently, the release of atomic spin degrees of freedom within the condensate in an optical trap marked a significant development, opening the door to the exploration of spinor BEC [3–6]. Concurrently, the introduction of electrons into electric or magnetic fields, or the imposition of strong spin–orbit coupling (SOC), led to a plethora of intriguing phenomena in condensed matter physics, including topological insulators, topological superconductors, and the anomalous Hall effect [7–11].
Moreover, the experimental realization of artificial SOC has revolutionized the quantum manipulation of ultracold atoms [12]. This novel system has incorporated various elements, such as artificial magnetic fields, optical lattices [13–17], and dipole interactions [18–20], introducing a plethora of physical phenomena in BEC. Examples include the emergence of plane-wave (PW) phases [21, 22], stripe phases [18, 23–28], vortices [29–32], lattice phases [27, 33], topological superfluid phases [34, 35] and supersolid phases [36, 37]. Researchers have conducted interesting dynamic studies on the abundant solitons in these BECs [38–40]. Concurrently, the exploration of various matter-wave solitons [41, 42] has become a focal point in spin-1/2 BEC systems, offering a pivotal platform for delving into the intricacies of nonlinear phenomena. Crucially, the properties of solitons in this system are intricately tied to the dimensionality of condensed matter. In one-dimensional systems, bright solitons persist, while in two-dimensional systems, the potential for collapse or various contraction instabilities looms due to self-attraction [2]. The stabilizing influence of SOC on two-dimensional bright solitons significantly shapes their properties [43, 44]. Furthermore, the vortex characteristics of rotating BEC, representing the topological features of superfluids, have been extensively explored both experimentally and theoretically, encompassing 4He and ultracold bosons [45].
In this paper, we employ numerical techniques, including the Newton conjugate gradient method and split-step Fourier method, to investigate matter-wave solitons confined within a two-dimensional SOC-BEC with repulsive interactions and rotational frequency within a harmonic potential. Our exploration reveals diverse domains of existence and stability for these solitons. We delve into key physical and theoretical properties, laying the groundwork for experimental research. Notably, both attractive and repulsive interactions can cause changes in shape and stability and here we focus on the impact of repulsive interactions on solitons. We delve into the intricate interplay among repulsive interaction strength, SOC, rotation frequency, and the stability of solitons.
Furthermore, we extend our analysis by introducing SOC into a BEC system with harmonic potential, showcasing its ability to support stable soliton formations, including PW, stripe, petal solitons, and vortex arrays under repulsive interactions. Our findings underscore the transformative effect of repulsive interactions on solitons, transitioning them from PW solitons to stripe solitons when the interspecific repulsive interaction is not zero. Notably, as the chemical potential and SOC strength vary, the system reveals the emergence of single-layer and double-layer odd-petal solitons. Our exploration deepens when considering non-zero rotation frequencies. Under the influence of repulsive interactions, changes in rotation frequency induce a shift in the soliton's shape, transitioning from a stripe soliton to a vortex array. We meticulously delineate the existence domain of the vortex solitons, showcasing its propensity for continuous rotation. Intriguingly, the direction of rotation frequency exerts a disparate impact on soliton stability, disrupting the equivalence between clockwise and counterclockwise rotations.
Differing from previous schemes, our proposal has the following differences. Firstly, under harmonic potential, we find plane-wave bright solitons, stripe bright solitons and petal bright solitons in systems with repulsive interactions. Compared to previous studies on repulsive interaction systems [18, 23–25], we have found a richer variety of solitons. We also systematically study their existence and stability regions. Compared to previous solitons in attractive interaction systems [26–28], the solitons we found have better stability. In addition, we find that the stripe bright solitons transform into a vortex array under a rotating frame, and we also find the stable range. Therefore, our work can provide assistance in observing various types of solitons in experiments.
This research not only contributes valuable insights into the dynamics of solitons in complex quantum systems, but also establishes a robust foundation for further theoretical and experimental investigations in this fascinating realm.
2. Model
We explore a quasi-two-dimensional spin-1/2 BEC with Rashba SOC. The mean-field dynamics of this system are characterized by the dimensionless Gross–Pitaevskii (GP) equations given as [17]1 ) and the stationary-state equation (2 ), we can explore solitons properties by employing numerical solutions, numerical evolution, and the linear stability analysis. The linear stability analysis and the evolution of stationary solitons with small perturbations are used to test the stability of stationary solitons.
$\begin{eqnarray}\begin{array}{rcl}{\rm{i}}{\partial }_{t}{\psi }_{1} & = & -\displaystyle \frac{1}{2}({\partial }_{x}^{2}+{\partial }_{y}^{2}){\psi }_{1}+V(r){\psi }_{1}\\ & & +\,\beta ({\partial }_{x}-{\rm{i}}{\partial }_{y}){\psi }_{2}+({\sigma }_{1}{\left|{\psi }_{1}\right|}^{2}+{\sigma }_{2}{\left|{\psi }_{2}\right|}^{2}){\psi }_{1}\\ & & +\,{\rm{i}}\omega (x{\partial }_{y}-y{\partial }_{x}){\psi }_{1}-\displaystyle \frac{\omega }{2}{\psi }_{1},\\ {\rm{i}}{\partial }_{t}{\psi }_{2} & = & -\displaystyle \frac{1}{2}({\partial }_{x}^{2}+{\partial }_{y}^{2}){\psi }_{2}+V(r){\psi }_{2}\\ & & -\,\beta ({\partial }_{x}+{\rm{i}}{\partial }_{y}){\psi }_{1}+({\sigma }_{1}{\left|{\psi }_{2}\right|}^{2}+{\sigma }_{2}{\left|{\psi }_{1}\right|}^{2}){\psi }_{2}\\ & & +\,{\rm{i}}\omega (x{\partial }_{y}-y{\partial }_{x}){\psi }_{2}+\displaystyle \frac{\omega }{2}{\psi }_{2},\end{array}\end{eqnarray}$
where ψ1 and ψ2 represent the two spinor components, satisfying the normalization condition with N=$\int ({\left|{\psi }_{1}\right|}^{2}+{\left|{\psi }_{2}\right|}^{2}){\rm{d}}r$. Here, variable t denotes a dimensionless time coordinate, while x and y represent dimensionless spatial coordinates. The parameter β denotes the magnitude of the SOC. Additionally, σ1 and σ2 account for intra- and interspecies interactions, respectively, with σ1,2 = ± 1 representing attractive and repulsive interactions. The harmonic potential is given by V(r) = V0(x2 + y2)/2, here we consider the case V0 = 1 in this paper. The rotation with a frequency of ω contributes to the penultimate term in the equation, and the last term is introduced to eliminate the time dependence in the SOC term [17]. In our analysis, we seek local solutions with finite norms and employ the transformation ψ1,2(x, y, t) = e−iμtφ1,2(x, y), where μ is the chemical potential. The resulting steady-state equation of the system is [17] $\begin{eqnarray}\begin{array}{rcl}\mu {\phi }_{1} & = & -\displaystyle \frac{1}{2}({\partial }_{x}^{2}+{\partial }_{y}^{2}){\phi }_{1}+V(r){\phi }_{1}\\ & & +\,\beta ({\partial }_{x}-{\rm{i}}{\partial }_{y}){\phi }_{2}+({\sigma }_{1}{\left|{\phi }_{1}\right|}^{2}+{\sigma }_{2}{\left|{\phi }_{2}\right|}^{2}){\phi }_{1}\\ & & +\,{\rm{i}}\omega (x{\partial }_{y}-y{\partial }_{x}){\phi }_{1}-\displaystyle \frac{\omega }{2}{\phi }_{1},\\ \mu {\phi }_{2} & = & -\displaystyle \frac{1}{2}({\partial }_{x}^{2}+{\partial }_{y}^{2}){\phi }_{2}+V(r){\phi }_{2}\\ & & -\,\beta ({\partial }_{x}+{\rm{i}}{\partial }_{y}){\phi }_{1}+({\sigma }_{1}{\left|{\phi }_{2}\right|}^{2}+{\sigma }_{2}{\left|{\phi }_{1}\right|}^{2}){\phi }_{2}\\ & & +\,{\rm{i}}\omega (x{\partial }_{y}-y{\partial }_{x}){\phi }_{2}+\displaystyle \frac{\omega }{2}{\phi }_{2}.\end{array}\end{eqnarray}$
Utilizing GP equation (For the stability of stationary solitons φ1,2, there are two methods to analyze it. One is linear stability analysis, and the other is the evolution of stationary solitons with small perturbations. The former is more suitable for analyzing the stability of a large number of stationary solitons. We consider adding small perturbations to the stationary solution φ1,2 as ${\psi }_{\mathrm{1,2}}=\left[{\phi }_{\mathrm{1,2}}+\varepsilon \left({w}_{{}_{\mathrm{1,2}}}{{\rm{e}}}^{\lambda t}+{v}_{1,2}^{* }{{\rm{e}}}^{{\lambda }^{* }t}\right)\right]{{\rm{e}}}^{-{\rm{i}}\mu t}$, where w, v are perturbation functions with w, v ≪φ1,2, λ is the growth rate of disturbance, ${\lambda }_{{re}}$ is the maximum real part of the eigenvalue, and ‘*' denotes complex conjugation. Then, we put it into equation (1 ) and linearize it. We can obtain an eigenequation with an eigenvalue of λ and solve it numerically for λ. When ${\lambda }_{{re}}$ is greater than 10−4, we think that the stationary solutions are unstable because of the exponential growth of perturbations with time. To verify the stability analysis results of solitons, we employ the split-step Fourier method for simulating solitons evolution. Random perturbations are introduced to the initial values of the evolution, where the initial value is defined as ψ1,2(t = 0, x, y) = φ1,2(x, y)(1 + ϵρ1,2), with ϵ = 0.03 and ρ1,2 representing random variables uniformly distributed in the interval [0, 1]. When the profiles of the solitons remain unchanged after evolving past 300, they are stable.
3. Matter-wave solitons without rotation
In this section, we initially explore the solutions of the system under the condition of ω = 0. In this case, we can obtain various types of bright solitons. Utilizing numerical methods, we determine the solitons solutions, revealing the ability of the system to transform PW and stripe solitons. Notably, variations in σ2 and β result in significant changes in the shape of the solitons. Specifically, a smaller σ2 and β lead to the manifestation of a PW soliton, while a larger β corresponds to a stripe soliton. Within the stripe solitons category, two distinct types, labelled STR1 and STR2, are identified in the system. The PW solitons, STR1 and STR2 are presented in figure 1.
Figure 1(a) illustrates the PW soliton when σ1 > σ2. In figures 1(b)–(c) the density of each component exhibits a stripe structure, while the total density does not. Analysis of figure 1(a1) and (a2) reveals that the upper component of the soliton is slightly larger than the lower component. Subsequent examination of figure 1(a3) demonstrates that the total density of PW solitons is presenting a Gaussian shape. Figures 1(b)–(c) display the stripe solitons when σ1 = σ2. In these cases, the densities of each component exhibit a stripe structure, while the total density does not. The number of two-component stripes increases with β, and the upper component consistently differs by one compared to the lower component. The stripe count is discernible in STR1, while the separation in STR2 is less pronounced. In STR1, the amplitude of the lower component is slightly larger than the upper component, whereas in STR2, the upper component is larger than the lower component. Significant differences in phase and total density are observed between the two types of stripes. While STR2 tends toward the PW phase, the phase diagram is not as distinct as in PW solitons. The total density in figure 1(b3) for STR1 is also presenting a Gaussian shape, while for STR2 in figure 1(c3), it is elliptical. From these perspectives, STR2 leans more towards the transition state between PW and stripe solitons. To better distinguish these three types of solitons, we represent the relationship between β and the number of particles N, as well as the relationship between β and the maximum real of the eigenvalues ${\lambda }_{{re}}$, in figure 2. From figures 2(a1)–(c1), the N of PW solitons increases with the increase of β in different σ2. The N of STR1 and STR2 solitons increases with the increase of β. Analyzing figures 2(a2)–(c2), we observe that all PW solitons in the system are stable. In contrast, stripe solitons exhibit instability at small β values, gradually stabilizing with increasing β, with STR2 demonstrating superior stability compared to STR1. Examining figures 2(b2) and (c2), we note that STR1 displays good stability at μ = 0.8, while the stability of STR2 does not vary significantly at different μ. This suggests that the stability of STR1 is influenced by both μ and β, whereas the stability of STR2 is predominantly affected by β. Figure 3 presents typical examples illustrating the evolution of both stable and unstable solitons, validating the aforementioned stability analyses. The illustrations in the left column, as shown in figures 3(a1)–(c1), represent the density of spin components ψ1,2 at t = 0, while the corresponding right ones, figures 3(a2)–(c2), depict the density after t = 300. These density maps further affirm the stability of the PW solitons and the stripe solitons. We make both the linear stability analysis and the direct numerical evolution simulations on all discussed solitons, and these results are consistent.
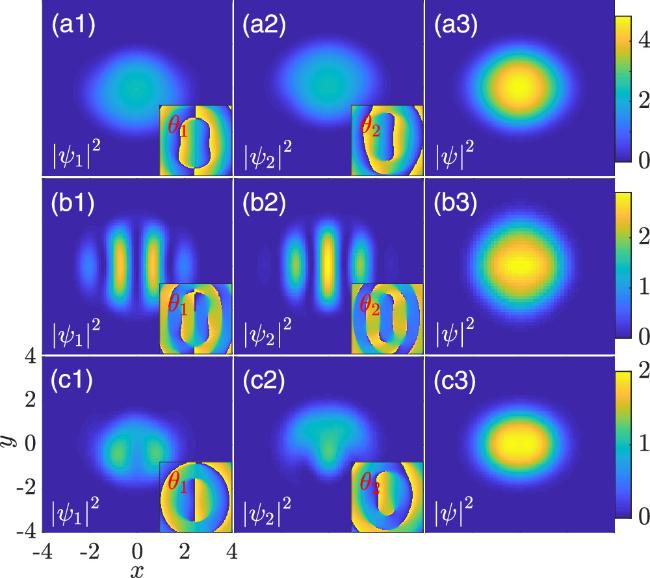
Figure 1. Density and phase distributions of PW solitons with (a) β = 2 at μ = 0.6, σ1 = 1, σ2 = 0 and STR1 with (b) β = 2.2 and STR2 with (c) β = 1.8 at μ = 0.6, σ1 = 1, σ2 = 1. From left to right, the column represents upper component density ${\left|{\psi }_{1}\right|}^{2}$, lower component density ${\left|{\psi }_{2}\right|}^{2}$ and total density ${\left|\psi \right|}^{2}$ = ${\left|{\psi }_{1}\right|}^{2}$+${\left|{\psi }_{2}\right|}^{2}$. Distributions are plotted with the same colorbar in each row. |
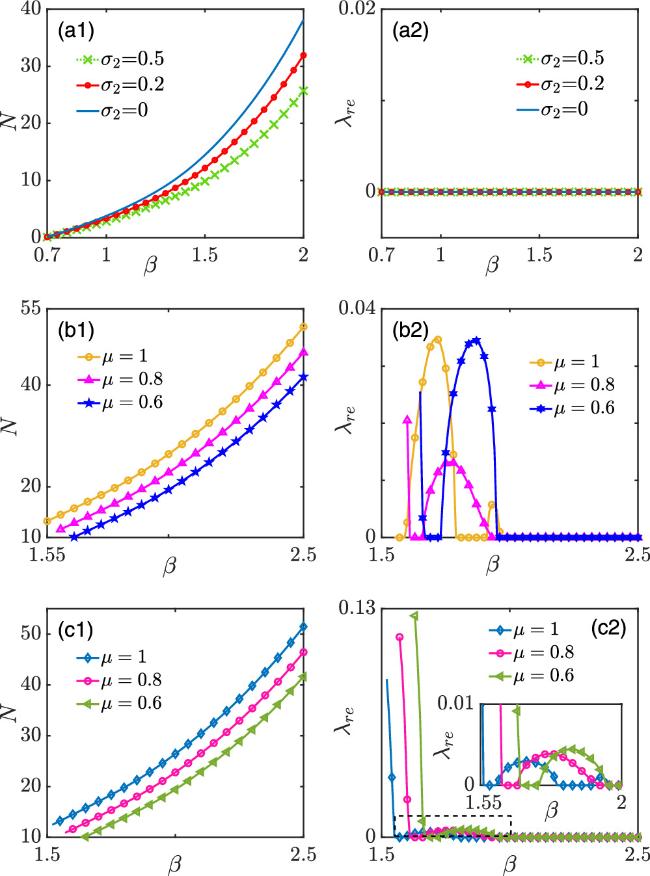
Figure 2. The left shows the relationship between the SOC and the existence domain of solitons and the right shows the relationship between the SOC and the maximal perturbation growth rate. (a) represents the PW solitons at σ1 = 1, (b) represents STR1 solitons at σ1 = 1, σ2 = 1 and (c) represents STR2 solitons at σ1 = 1, σ2 = 1. |
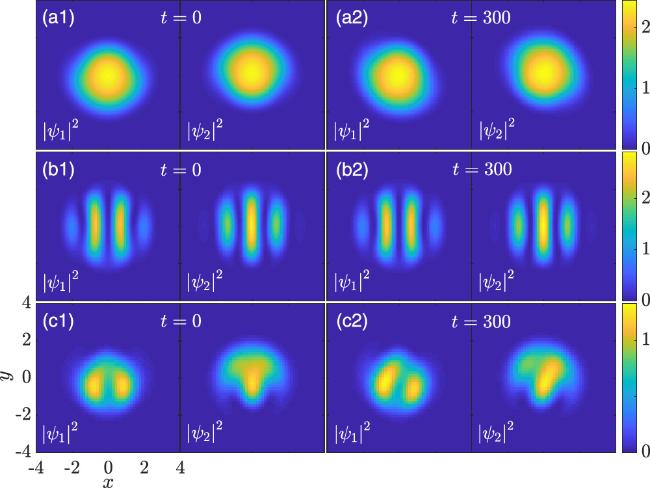
Figure 3. Stable PW soliton (a) at β = 2, σ1 = 1, σ2 = 0, STR1 (b) at β = 2.2, σ1 = 1, σ2 = 1 and unstable STR2 (c) at β = 1.8, σ1 = 1, σ2 = 1. Here, μ = 0.6. |
In the case of ω = 0, with the change of μ and β, the single-layer and double-layer petal solitons can also be found. The emergence of petal solitons is a consequence of the intricate interactions in our SOC system. The density and phase distributions of single-layer petal solitons are presented in figure 4. Due to the SU(2) characteristic of spin 1/2, the obtained number of solitons petals is odd. As the number of petals increases, the radius of solitons also increases, measured as the distance from the center of a single petal component to the petal's center. Additionally, the range occupied by solitons expands, and the distance between two petal components gradually diminishes. The total density of solitons reveals that the rings formed by upper and lower components are growing larger. From a phase perspective, the five-petal solitons and the seven-petal solitons have a more similar phase. With the change of μ and β, we can find double-layer petal solitons in the system. The density and phase distribution of double-layer petal solitons are depicted in figure 5. In addition to sharing the same characteristics as single-layer petal solitons, we observe a distinct behavior in double-layer petal solitons: unlike their single-layer counterparts, these solitons exhibit lateral and radial expansion. The outer layer of the double-layer petal solitons has a lower amplitude compared to the inner layer. Additionally, the total density of the upper and lower components undergoes a transformation from a single-layer ring to a double-layer ring. These findings are illustrated in figure 6. We present a relationship diagram of single-layer petal solitons about β with N and ${\lambda }_{{re}}$. Upon analyzing figures 6(a1)–(c1), we find that single-layer petal solitons always exist in larger regions of β, and their total number of particles N increases with the increase of β or μ. In addition, the increase of μ will also expand the existence domain of single-layer petal solitons (reduce the critical value β). When all conditions are the same, petal solitons with fewer petals have a larger number of particles N. For their stability, examining figures 6(a2)–(c2), we find they are always unstable at larger values of β, and single-layer seven-petal solitons are the most unstable. In the range of existence, when β is small, their stability is more complex. But the stable areas are all around β = 1.5. From figures 7(a1)–(c1), we find that double-layer petal solitons and single-layer petal solitons have similar characteristics in the relationship between the number of particles N and β in their respective existence domains. From figures 7(a2)–(c2), similar to single-layer petal solitons, double-layer petal solitons are also unstable when β is large. When β is small, the stability changes of solitons are complex, and the double-layer three-petal solitons are the most unstable. Overall, by observing the stable regions of single-layer petal and double-layer petal solitons in figures 6(a2)–(c2) and 7(a2)–(c2), we find that single-layer petal solitons have better stability.

Figure 4. Density and phase distributions in single-layer three-petal solitons with (a) β = 1.4, single-layer five-petal solitons with (b) β = 1.3, and single-layer seven-petal solitons with (c) β = 1.68 at μ = 1.2, σ1 = 1, σ2 = 1. From left to right, the column represents upper component density ${\left|{\psi }_{1}\right|}^{2}$, lower component density ${\left|{\psi }_{2}\right|}^{2}$ and total density ${\left|\psi \right|}^{2}$ = ${\left|{\psi }_{1}\right|}^{2}$+${\left|{\psi }_{2}\right|}^{2}$. Distributions are plotted with the same colorbar in each soliton. |
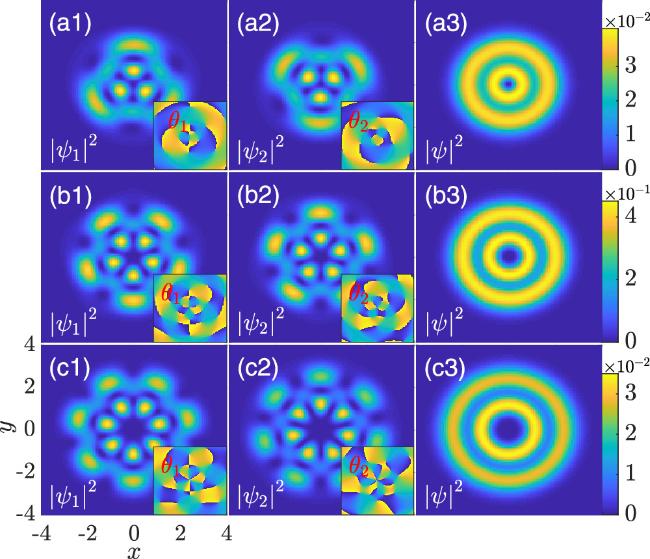
Figure 5. Density and phase distributions in double-layer three-petal solitons with (a) μ = 1.4, β = 1.45 and double-layer five-petal solitons with (b) μ = 1.7, β = 1.7, and double-layer three-petal solitons with (c) μ = 3.2, β = 1.28 at σ1 = 1, σ2 = 1. From left to right, the column represents upper component density ${\left|{\psi }_{1}\right|}^{2}$, lower component density ${\left|{\psi }_{2}\right|}^{2}$ and total density ${\left|\psi \right|}^{2}$ = ${\left|{\psi }_{1}\right|}^{2}$+${\left|{\psi }_{2}\right|}^{2}$. Distributions are plotted with the same colorbar in each soliton. |
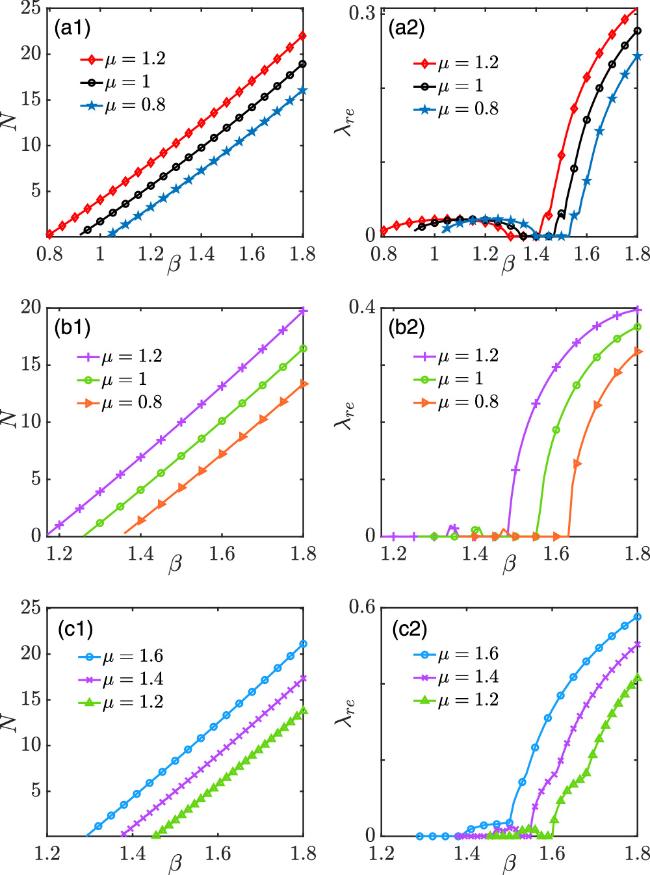
Figure 6. The left shows the relationship between the SOC and the existence domain of solitons and the right shows the relationship between the SOC and ${\lambda }_{{re}}$. (a), (b) and (c) represent the single-layer three-petal solitons, the single-layer five-petal solitons and the single-layer seven-petal solitons. Here, σ1=1, σ2 = 1. |
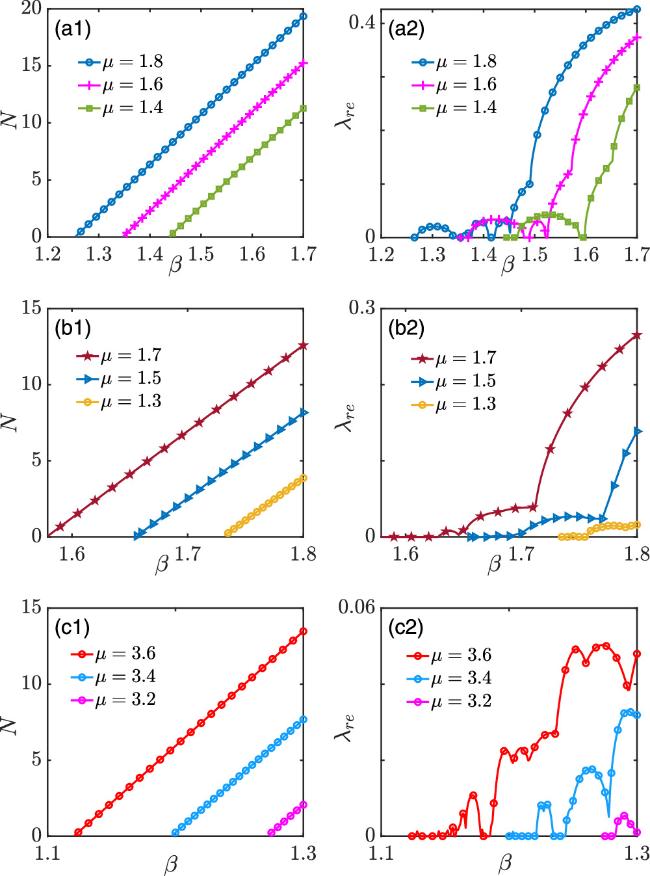
Figure 7. The left shows the relationship between the SOC and the solitons existence domain and the right shows the relationship between the SOC and the maximal perturbation growth rate. (a), (b) and (c) represent the double-layer three-petal solitons, the double-layer five-petal solitons and the double-layer seven-petal solitons. Here, σ1 = 1, σ2 = 1. |
The evolution results of single-layer and double-layer petal solitons in figure 8 validate the aforementioned stability analyses. The evolution results of stable single-layer three-petal and five-petal solitons, double-layer three-petal and seven-petal solitons are shown in figures 8(a2), (b2), (d2), and (f2), their profiles are remained perfectly. The unstable results are shown in figures 8(c2) and (e2). Although their amplitudes of every petal has changed, the profiles still remain unchanged. In addition, we perform stability analysis and direct numerical evolutionary simulations for all the discussed solitons, and achieve the conclusion of excellent agreement.
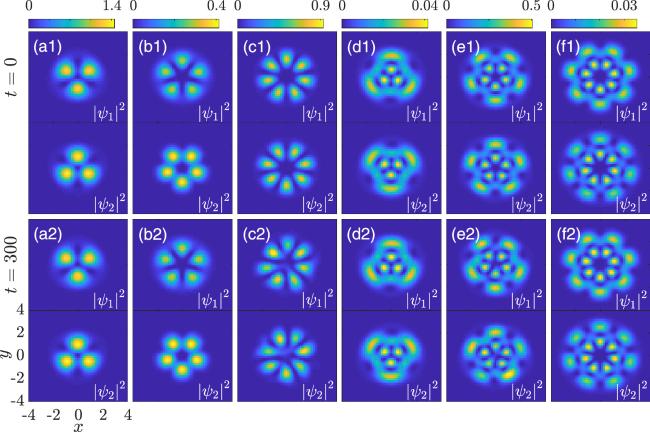
Figure 8. Stable single-layer three-petal solitons (a), single-layer five-petal solitons (b), and unstable single-layer seven-petal solitons (c) at (a) β = 1.4, (b) β = 1.3 and (c) β = 1.68. Here, μ = 1.2. Stable double-layer three-petal solitons (d), double-layer seven-petal solitons (e), and unstable double-layer five-petal solitons (f) at (d) μ = 1.4, β = 1.45, (e) μ = 1.7, β = 1.7, (f) μ = 3.2, β = 1.28. Another parameters are σ1 = 1, σ2 = 1. The first line at t = 0, the second line at t = 300. |
4. Vortex array in rotating frame
In this section, we explore the scenario involving the addition of a rotation term(ω ≠ 0). Following the inclusion of this rotation term, The process of finding steady-state solutions closely mirrors the preceding discussion. The variation in the parameter ω induces substantial alterations in the solitons shapes. Initially, the soliton exists as a stripe soliton at ω = 0, then transforms into a vortex soliton, termed a vortex array, displaying a diverse structure. The distinction between clockwise (ω > 0) and counterclockwise (ω < 0) rotation directions becomes apparent. We elucidate the case for ω > 0 and the consequent adjustment in the strength of ω, and yield the vortex array depicted in figure 9. When the angular frequency ω is small in the system, the vortex array is depicted in figure 9(a). With an increase in ω, the number of vortices within the solitons correspondingly increases, as illustrated in figure 9(b). A comparison of the phase reveals a complete transformation of solitons from stripe solitons to vortex arrays, concurrently altering the total density of solitons from an elliptical shape to a vortex shape.
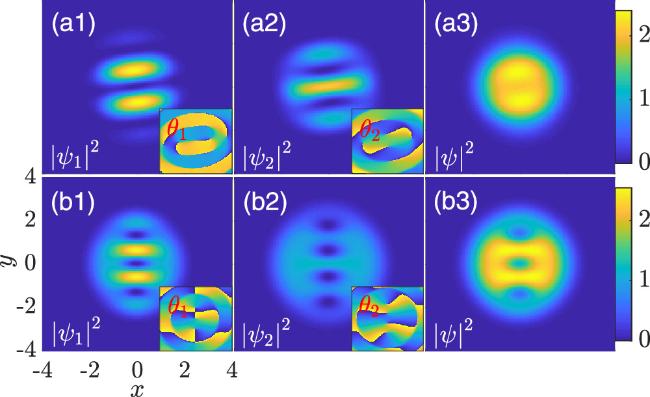
Figure 9. Density and phase distribution in vortex array with (a) ω = 0.01 and (b) ω = 0.2 at μ = 0.6, β = 2 and σ1 = 1, σ2 = 1. From left to right, the column represents upper component density ${\left|{\psi }_{1}\right|}^{2}$, lower component density ${\left|{\psi }_{2}\right|}^{2}$ and total density ${\left|\psi \right|}^{2}$ = ${\left|{\psi }_{1}\right|}^{2}$ + ${\left|{\psi }_{2}\right|}^{2}$. Distributions are plotted with the same colorbar in each soliton. |
To elucidate the distribution of the vortex array following the introduction of ω into the system, we establish a domain denoting the existence of the vortex array as shown in figure 10. The characteristics of the vortex array are summarized in figure 10(a1), the red regions indicate the stable regions of these existence solitons in the parameters domain of ω ∈ [ − 0.2, 0.2] and β ∈ [1.8, 2.3]. We observe that the existence domain of the vortex array is symmetric about ω, but the stability region is not so. The stable domain of the vortex array is more extensive at ω < 0. When ω > 0, there is only a small stable area near ω = 0 and ω = 0.2. Additionally, we notice that the vortex array in the system has better stability when the strength of β is low. The stability of the vortex array depends on both the size of β and ω, and the difference of the stability between ω > 0 and ω < 0 suggests the non-equivalence of the rotation direction. In figure 10(a2), the relationship of ω and N with different β are shown. Taking the different β, the soliton transforms from a stripe soliton to a vortex array as ω and β change. With the variation of ω, N initially decreases and then increases. It is also evident that when ω takes ±0.2, the vortex array does not exhibit the same N, indicating non-equivalent of rotation directions. We find that when β is small, the stable domain exists in both ω > 0 and ω < 0. As β increases, the stable domain is present only in the ω < 0. When β = 2.3, the stable region exists near ω = 0.
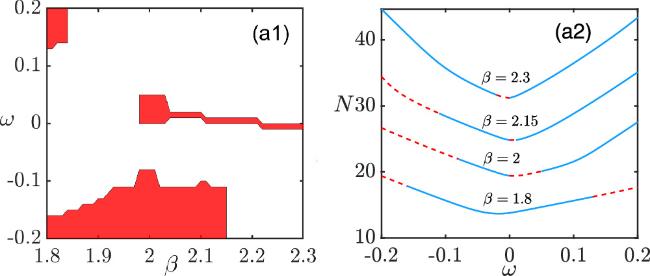
Figure 10. (a1) shows stability domains of vortex array about β and ω, and the red parts represent the stable area. (a2) shows the relationship between ω and N of vortex arrays under different β. The red dotted line represents stable regions and the blue solid line represents unstable regions. |
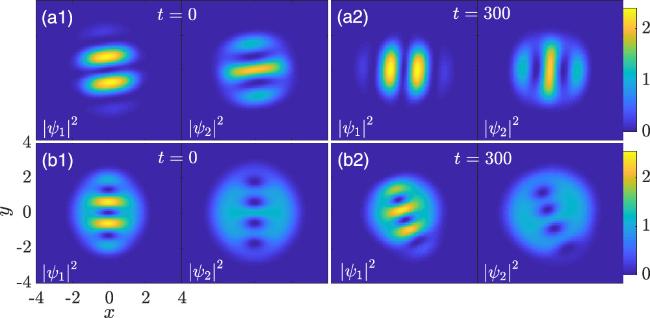
Typical evolution examples of stable and unstable vortex arrays are depicted in figure 11. The results of linear stability analysis and numerical evolution are consistent.
Figure 11. Stable (a) and unstable (b) vortex array at (a) ω = 0.01 and (b) ω = 0.2. Here, β = 2, σ1 = 1 and σ2 = 1. |
5. Summary
In summary, we have investigated the stationary matter-wave solitons within a quasi-two-dimensional BEC with spin-1/2. The system exhibited support for various stable matter-wave solitons. Through numerical solutions, we systematically examined the domains of existence and stability for four types of bright solitons, namely PW, stripe solitons, petal solitons, and vortex arrays. Additionally, we observed certain laws governing the existence and stability of solitons. Our analysis delved into the impact of SOC, repulsive interactions represented by σ2, and the rotation frequency ω on the presence of solitons. Our findings suggested that SOC and σ2 could generate diverse and intricate structures. Solitons were categorized based on their phase and shape. Specifically, when ω = 0 in the system, PW solitons were observed for weaker SOC, and all resulting solitons proved stable. As the strength of repulsive interaction increased, solitons underwent a transition from planar-wave solitons to stripe solitons, resulting in two distinct types of stripe solitons in the system. Notably, stable stripe solitons were obtained with larger β, and STR2 exhibited superior stability compared to the STR1. Varying μ and β led to the finding of odd-petal solitons with single and double layers. Stable petal solitons are identified when β was small, and double-layer petal solitons demonstrated greater stability than single-layer ones. The stability of single-layer petal solitons decreased with increasing petal number, while the stability of double-layer petal solitons increased with the same parameter. Furthermore, in BEC with repulsive interactions, the addition of ω induced a transition from PW solitons and stripe solitons to vortex arrays. The incorporation of ω created a soliton existence domain in the system, with associated stability domains. Notably, the vortex array has a larger stable region at ω < 0. In previous studies, people have paid more attention to the types of solitons and less research has been conducted on their existence domains and stability. Our results supplement the previous research, we mainly focus on the study of soliton types, existence domains and stability. In previous studies, there has been no research on petal solitons under harmonic potentials. We have obtained single-layer and double-layer petal solitons and analyzed their existence and stability domains. Our results are helpful for theoretical and experimental research of SOC-BEC. The properties of solitons under attractive interactions in the system can also be further explored.