


1. Introduction
The synthesis of the superheavy new elements is an absorbing arena of active experimental and theoretical studies. The superheavy nucleus 294Og176 [1] locates the current limit of nuclear charge, filling the 7th row of the periodic table of elements. Scientists worldwide are conducting experiments to synthesize Z = 119 and 120 in the 8th row to explore the superheavy new elements [2–5]. However, the production cross-section of the object nucleus is too small to be discovered. The recent experimental work with hot fusion reactions can only give the upper limit of the production cross-section of Z = 119 and 120 [2, 4, 6]. Indeed, the survivability of such superheavy nuclei hugely depends on their fission barrier structure. In the spontaneous fission channel, for each MeV change in the fission barrier height, there will be a factor of roughly 107 difference in half-life [7]. Therefore, the structure of the fission barrier, especially the height of the first fission barrier, is a critical quantity for understanding the survivability of the superheavy new element.
Fission is a process of a quantum system from an equilibrium point towards the fission barrier to splitting fragments. The liquid-drop model by Bohr and Wheeler [8] which expanded the Coulomb and surface energies to quadrupole deformations, is the first model to describe the fission barrier quantitatively. The next milestone is adding a shell correction to the liquid-drop-model barrier by Strutinsky [9], which theoretically started the macroscopic-microscopic model era. Then the ‘double-humped' or more humped fission barrier structures have attracted people's attention. Presently, four kinds of theoretical models have been widely used to study the fission barriers: firstly, the macroscopic-microscopic (MM) models [10–13]; secondly, the extended Thomas–Fermi plus Strutinsky integral (ETFSI) methods [14, 15]; thirdly, the nonrelativistic energy density functionals based on zero-range Skyrme and finite-range Gogny interactions [16–19]; and fourthly, the covariant density functional theory (CDFT) [20–25]. Indeed, a few calculations have considered the triaxial deformation systematically of the inner barrier for Z = 118, 119, 120 nuclei. Within the MM model, Kowal et al. assumed the axial symmetry of the ground states and performed in a five-dimensional deformation space including triaxial shapes at the saddle points [12, 13]. For some heavy and superheavy nuclei, it was recently found that the triaxial deformations also play a role in outer barriers, as well as the ground states [24, 26–28]. In fact, the general trend for fission barrier studies in recent years is to incorporate more shape and dynamic degrees of freedom in the calculation to improve the precision [11, 13, 25, 28–30]. Generally, the inner barriers are more accessible to measure than the outer barriers in experiments due to the little neutron-induced fission cross sections and play an important role in the spontaneous fission lifetimes compared with the outer barriers. The investigation of outer barriers should be considered with the octupole effects [10, 25, 31]. For instance, calculations using the density functional theory calculations have shown that octupole deformations are important for the fission barriers [23, 25, 32, 33]. Accordingly, we are focusing on the inner fission barriers with the inclusion of the triaxiality. It has been found that the triaxial deformation could influence the inner barriers significantly. For example, the heights of the inner barriers would be reduced by the triaxial deformation in the actinide region with the MM model and CDFT model [10, 25]. Experimentally, the triaxial deformation is revealed by the signature inversion [34], chiral doublets [35], and wobbling mode [36] in nuclear spectroscopic analysis. The triaxial deformation should be taken into account undoubtedly in the model deformation space to describe fission accurately.
A suitable tool is the MM approach, which usually describes the bulk properties of superheavy nuclei well and has the advantage of simplicity of physical picture and calculation. Previously, we systematically investigated the triaxiality effect on the static fission barriers for 95 even–even transuranium nuclei with Z = 94 − 118 synthesized in experiment by using the MM model [37]. The heights of the inner fission barrier are reduced remarkably in most nuclei with triaxial deformation. In addition, the dynamic fission barriers, namely the Coriolis effects on the fission barrier, have been studied in even–even nuclei with A = 256 as well [38]. With increasing rotational frequency, the triaxiality and Coriolis forces have a similar reduction behavior on the fission barrier, showing that the microscopic shell correction dominates evolution. We also systematically studied the effects of specific β2, γ, and β4 deformation on the fission barrier in even–even N = 152 isotones [39]. By including triaxiality, the fission barrier will pull down more significantly in comparison to the calculation with hexadecapole deformation. In this paper, we consider the effect of triaxiality on the inner fission barrier in the superheavy Z = 118, 119, 120 nuclei systematically. The fission barrier is a crucial input value to calculate the synthesis of superheavy new elements Z = 119 and 120 [40, 41]. One of the aims of this work is to provide a valuable reference for other theoretical calculations. The present multidimensional potential energy surface (PES) calculations are also carried out within the (β2, γ, β4) deformation space. Besides, we also briefly evaluate the validity and predictive power of the present model. The next closed shell after Z = 82 and N = 126 would be discussed with the universal Woods–Saxon single-particle potential. Especially for the nuclei far away from the β-stable line, e.g. the proton-rich nuclei, the model parameters may need to be refitted for the strengthened proton density distribution [42, 43]. Then, the evolution of the fission barrier structure is also illustrated in proton-rich nuclei with the Woods–Saxon parameter modification of the present work.
This article is organized as follows. In section 2 , we specify in detail the present PES calculations within the MM model. Section 3 displays the calculated Woods–Saxon single-particle levels, PESs, fission barriers, parameter modification results, and the discussions. Finally, the main conclusions and perspectives are given in section 4 .
2. Brief description of the model
The fundamental merit in the MM model is that the total potential energy of a deformed nucleus (Z, N, $\hat{\beta }$) can be separated into two parts of calculations, respectively. The macroscopic energy is obtained with a smooth function of nucleon numbers (Z, N) and deformations ($\hat{\beta }$). The microscopic quantum correction is derived from the inhomogeneous distributed single-particle potential levels. The present PES calculation [44] is based on such an MM model [45, 46], which is a pairing self-consistent Woods–Saxon–Strutinsky calculation in the grid of deformation space [9, 47]. This calculation has been widely used to reproduce nuclear bulk properties, such as the binding energies, ground-state deformations, and rotational properties [48–50]. We will outline the common procedure and the necessary references.
Firstly, the macroscopic energy is calculated from the standard liquid-drop model by Myers and Swiatecki [51], including the volume, surface, and Coulomb energy. The volume energy is A-dependent, whereas the surface and Coulomb energy are shape-dependent. In the present work, the nuclear surface Σ is represented as
$\begin{eqnarray}{\rm{\Sigma }}:R(\theta ,\phi )={R}_{0}\left[1+\displaystyle \sum _{\lambda }\displaystyle \sum _{\mu =-\lambda }^{+\lambda }{\alpha }_{\lambda \mu }{Y}_{\lambda \mu }^{* }(\theta ,\phi )\right],\end{eqnarray}$
where R0 is the radius of the isovolume spherical shape, which is determined by the volume of the deformed object nucleus equal to $4\pi {R}_{0}^{3}/3$, αλμ denotes all the deformation parameters applied here, and ${Y}_{\lambda \mu }^{* }$ is the spherical harmonics. Generally, the deformation parameters with lower-order multipolarity λ are much more important than the higher ones. In the present work, the deformation $\hat{\beta }$ includes the quadrupole deformations (α20, α2±2) and the hexadecapole deformations (α40, α4±2, α4±4). It can usually transform to the (β2, γ, β4) deformation space in Bohr's parametrization [52, 53] under the Lund Convention [37, 50, 54]. This deformation space could describe the structure properties well for even–even nuclei at A > 200 [37–39, 55]. After the nuclear shape was specified, the macroscopic energy could be obtained, and the one-body mean-field single-particle potential could also be generated.Secondly, the single-particle levels by the Woods–Saxon potential are calculated from the numerical solution of the Schrödinger equation. The Woods–Saxon Hamiltonian [56] is,
The blocking method has been implemented for descriptions of odd-A and odd–odd nuclei. During the diagonalization process of HWS, deformed harmonic oscillator states with the principal quantum number Np ≤ 12 and Nn ≤ 14 have been cut off as a basis, respectively, for protons and neutrons.
$\begin{eqnarray}\begin{array}{rcl}{H}_{\mathrm{WS}} & = & -\displaystyle \frac{{{\hslash }}^{2}}{2m}{{\rm{\nabla }}}^{2}+{V}_{\mathrm{cent}}(\vec{r};\hat{\beta })+{V}_{\mathrm{so}}(\vec{r},\vec{p},\vec{s};\hat{\beta })\\ & & +\displaystyle \frac{1}{2}(1+{\tau }_{3}){V}_{\mathrm{Coul}}(\vec{r},\hat{\beta }).\end{array}\end{eqnarray}$
The ${V}_{\mathrm{cent}}(\vec{r};\hat{\beta })$ is the central part of the Woods–Saxon potential [57], $\begin{eqnarray}{V}_{\mathrm{cent}}(\vec{r};\hat{\beta })=\displaystyle \frac{{V}_{0}[1\pm \kappa (N-Z)/(N+Z)]}{1+\exp [{\mathrm{dist}}_{{\rm{\Sigma }}}(\vec{r},\hat{\beta })/a]},\end{eqnarray}$
where the plus and minus signs corresponds to protons and neutrons, respectively. The ${V}_{\mathrm{so}}(\vec{r},\vec{p},\vec{s};\hat{\beta })$ is the spin-orbit potential defined by $\begin{eqnarray}\begin{array}{l}{V}_{\mathrm{so}}(\vec{r},\vec{p},\vec{s};\hat{\beta })=-\lambda {\left[\displaystyle \frac{{\hslash }}{2{mc}}\right]}^{2}\\ \times \left\{{\rm{\nabla }}\displaystyle \frac{{V}_{0}[1\pm \kappa (N-Z)/(N+Z)]}{1+\exp [{\mathrm{dist}}_{{{\rm{\Sigma }}}_{\mathrm{so}}}(\vec{r},\hat{\beta })/{a}_{\mathrm{so}}]}\right\}\vec{p}\cdot \vec{s},\end{array}\end{eqnarray}$
where λ denotes the strength parameter of the spin-orbit potential and the new surface Σso represents the surface of the spin-orbit potential. The ${V}_{\mathrm{Coul}}(\vec{r},\hat{\beta })$ is the Coulomb potential, which is added only for protons by a classical electrostatic potential for a uniformly charged drop. In the present calculation, the universal Woods–Saxon parameter set [46, 57], which describes not only the single-particle levels, but also the nuclear equilibrium deformations, has been applied as| a | (a) Central potential depth parameters: V0 = 49.6 MeV, κ = 0.86. |
| b | (b) Radius parameters of the central part: r0(p) = 1.275 fm, r0(n) = 1.347 fm. |
| c | (c) Radius parameters of the spin-orbit part: r0−so(p) = 1.320 fm, r0−so(n) = 1.310 fm. |
| d | (d) Strength of the spin-orbit potential: λ(p) = 36.0, λ(n) = 35.0. |
| e | (e) Diffuseness parameters of the central part and spin-orbit part: a(p) = a(n) = aso(p) = aso(n) = 0.70 fm. |
Thirdly, the microscopic energy is calculated by a shell correction δEshell and a pairing correction δEpair based on the above single-particle levels,
$\begin{eqnarray}\begin{array}{l}{E}_{\mathrm{mic}}(Z,N,\hat{\beta })=\delta {E}_{\mathrm{shell}}(Z,N,\hat{\beta })+\delta {E}_{\mathrm{pair}}(Z,N,\hat{\beta }).\end{array}\end{eqnarray}$
The $\delta {E}_{\mathrm{shell}}(Z,N,\hat{\beta })$ is obtained by the Strutinsky method [9], where the Strutinsky smoothing is performed with a six-order Laguerre polynomial and the smoothing range γ = 1.20 ℏω0 (ℏω0 = 41/A1/3 MeV). The $\delta {E}_{\mathrm{pair}}(Z,N,\hat{\beta })$ is evaluated with the Lipkin–Nogami (LN) method [58], ${H}_{\mathrm{LN}}\,={H}_{\mathrm{WS}}+{H}_{\mathrm{pair}}-{\lambda }_{1}N-{\lambda }_{2}{N}^{2}$, where HWS is the Woods–Saxon single-particle Hamiltonian, Hpair indicates the pairing interactions including the monopole and quadrupole pairing forces [50]. The LN method avoids the spurious pairing collapses encountered in the traditional Bardeen–Cooper–Schrieffer method. Note that the monopole and doubly stretched quadrupole pairings are considered. The former pairing strength is derived from the average gap method [59]. And the latter pairing strengths are determined by restoring the Galilean invariance broken by the seniority pairing force [60].Last but not least, in the actual calculations, the Cartesian quadrupole coordinates $X={\beta }_{2}\cos (\gamma +30^\circ )$ and $Y\,={\beta }_{2}\sin (\gamma +30^\circ )$ were used, where β2 denotes the magnitude of the quadrupole deformation and γ describes the nonaxial magnitude [37, 44]. In the PES, the triaxiality parameter γ covers the range [0°, 60°]. For two extreme cases, the nuclear shape is prolate (pro.) at γ = 0° while oblate (obl.) at γ = 60°. Note that the shape is only revealed by the γ degree of freedom in the present shape parametrization, whereas many studies evaluate the shape by the sign of β2. Then, at each point, the total energy of the object nucleus is calculated by the standard procedure mentioned above. Finally, the potential energy surface could be obtained with a cubic spline function interpolation between the lattice points. Accordingly, the ground-state equilibrium deformations (the minimum of PES), fission paths (the minimum energy versus the principal deformation β2), etc. , can be derived and studied based on the present PES calculation.
3. Results and discussions
The single-particle levels in the mean-field theory could be used to explain the nuclear properties effectively. A meaningful subject of nuclear structure in the superheavy nuclei is to study the next closed shell after Z = 82 and N = 126. Shell correction is always significant in the closed shell region, where superheavy nuclei may be more likely to survive against separation by macroscopic Coulomb energy. Generally, the minimum of the calculated potential energy surface corresponds to the low density of single-particle levels. In contrast, the saddle points coincide with high-level density in the potential energy surface calculations. Therefore, taking ${}_{118}^{294}$Og176 as an example, we have exhibited the Woods–Saxon single-particle diagrams with the universal parameter set near the Fermi surface in figure 1. It shows sizeable closed shell gaps at Z = 92, 114 (together with Z = 120,124) and N = 164, 178, 184 near the spherical shape, though deformed shell gaps can also be seen clearly. These locations are consistent with the folded-Yukawa single-particle potential that the enormous density of single-particle levels just above has the consequence at Z = 92, 114, 124 and N = 164,184 [61, 62]. For the shell gaps, around ${}_{118}^{294}$Og176, we could expect 298120178 as the next new element after Z = 118. In addition, the work in the nonrelativistic mean-field model favors Z = 114, 120, 126 and N = 184 [63, 64], and the suggestion by the relativistic mean-field model seems to be at Z = 114,126 and N = 172 [65]. Besides, it is worth noticing that many theoretical studies with machine learning usually input Z = 126 as a proton magic number after Z = 82 recently [66, 67].
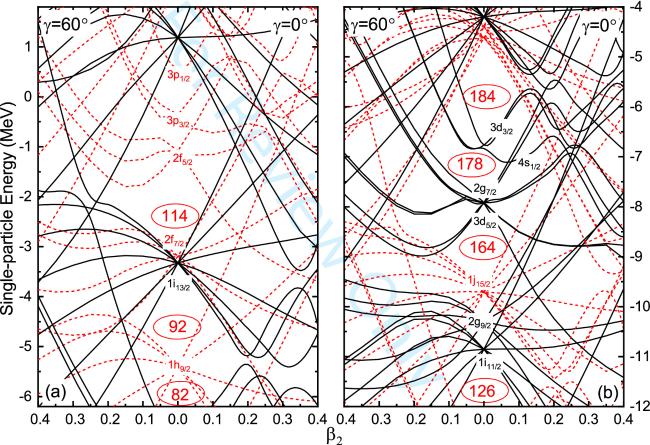
Figure 1. The calculated Woods–Saxon single-particle energy near the Fermi surface in the superheavy nucleus 294Og176. The solid (black) and dotted (red) lines denote the positive and negative parity levels for protons (a) and neutrons (b), respectively. |
Figure 2 shows the calculated PES of nucleus ${}_{118}^{294}$Og176. At each (β2, γ) lattice, the potential energy has been minimized with the deformation β4. We translate the conventional (X, Y) scale of the calculated PES to the (β2, γ) scale to describe the shape evolution clearly. One can see the ground-state shape of 294Og is oblate and very soft at β2 < 0.1. Indeed, there are various possible fission pathways and the most probable spontaneous fission pathway can be obtained by minimizing the self-consistent collective action [68]. The magenta dotted line with minus symbols represents the axial fission path (axial path) along the γ = 0°. The mathematical triaxial fission path (triaxial path-1), which is obtained by the minimum energy of each β2 point in the range γ ∈ (0, 60°), is displayed by the purple dotted line with plus symbols. It is so-called ‘mathematical' because the triaxial path-1 searches the minimum energy in the present deformation space with the increase of β2. The physical triaxial fission path (triaxial path-2) is labeled with multiple symbols by the purple dashed line. The triaxial path-2 looks for the saddle point first and searches the fission path linking the minimum and saddle point. Determining the optimal saddle point between two minima in the fission path is complicated in many calculations [10, 23, 24, 29, 37, 68]. Generally, the fictitious saddle points are often yielded in multidimensional PES calculations. It is a common misconception that additional shape degrees of freedom will lead to an accurate determination of saddle points. The technique of minimization with more than two variables would encounter a discontinuous jump. However, such fictitious saddle points could be higher or lower than the real ones. For 294Og, the saddle point with triaxial path-1 (fictitious saddle) is lower than triaxial path-2 (the real one) according to the PES. The triaxial degree of freedom should be included to find the real saddle point. For triaxial path-1, the oblate shape changes suddenly to prolate at β2 = 0.37, then towards triaxial at β2 = 0.47, back to prolate and finally to scission. This situation is not similar to the nucleus 252Cf, whose shape evolution in the axial and triaxial fission paths is somewhat smooth [37, 38]. The sudden changes do not seem physical, though the two shapes' energy is equal. One can argue that the tunneling effect from oblate to prolate occurs at β2 = 0.37, although it is possible in the microscopic world. For the triaxial path-2, we imitate the immersion method referred to in [10]. The shape evolution would vary smoothly along the fission path like water from minimum toward saddle point to scission point.
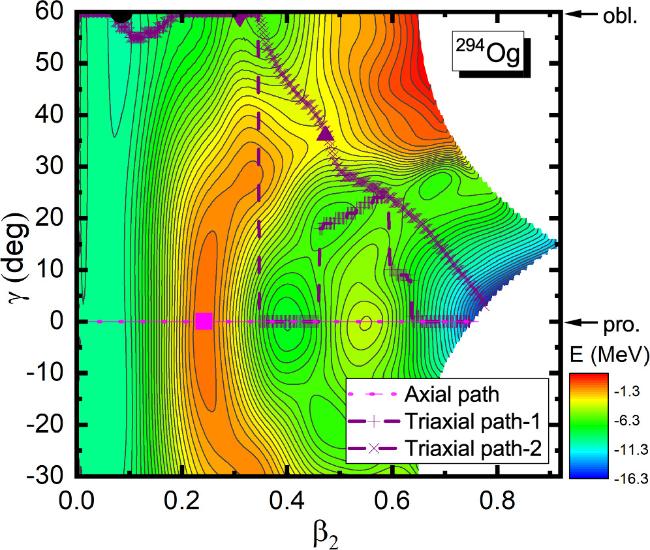
Figure 2. Calculated two-dimensional PES of 294Og in (β2, γ) space minimized over β4. The energy difference between the adjacent contours is 200 keV. The magenta dotted line with minus signs represents the axial fission path (axial path), the purple dashed line with plus signs denotes the triaxial fission path mathematically (triaxial path-1), and the purple dashed line with multiple signs stands for the triaxial fission path physically (triaxial path-2). The black solid circle denotes the ground-state point. The magenta solid square, purple solid lower and upper triangle represent the axial saddle point, triaxial saddle-1 and triaxial saddle-2. Further details are given within the text. |
To visually understand the above fission path, figure 3 shows the calculated three potential energy curves versus primary deformation β2 for 294Og. The fission barriers of the axial path and triaxial path-1 are ‘double-humped' structures, while the triaxial path-2 has only one peak at β2 < 0.7. Note that we are focusing on the first fission barrier as mentioned earlier. The height of the first fission barrier is 9.5 MeV along the axial path, 4.3 MeV along the triaxial path-1, and 7.1 MeV along the triaxial path-2, respectively. Also, the root mean square deviation of fission barriers between experimentally determined data and our previous work is 0.38 MeV in 13 available actinide nuclei [37]. One can see that the fission barrier of triaxial path-1 is significantly lower than the others (less than half of the axial path). Indeed, the inclusion of triaxiality reduces the height of the first barrier remarkably compared with the axial shape. The modified fission barriers would considerably influence fission rates and survival probabilities [69]. Besides, the potential energy curves of the axial path and triaxial path-2 have continuous change regularities except for triaxial path-1. The reason being is that the shape changes suddenly from oblate to prolate towards triaxial along the triaxial path-1, whereas the triaxial path-2 moves around the axial fission barrier towards the scission point as shown in figure 2. In addition to this, several theoretical results give the fission barrier height in 294Og previously. The macroscopic-microscopic model based on the fold-Yukawa (FY) single-particle potential and the finite-range liquid-drop model (FRLDM) suggests 8.48MeV [10], and the so-called heavy nuclei (HN) model is 5.99 MeV [12]. The ETFSI method recommends 6.6MeV [14], and the Skyrme–Hartree–Fock+BCS calculation obtains 10.0 MeV [69].
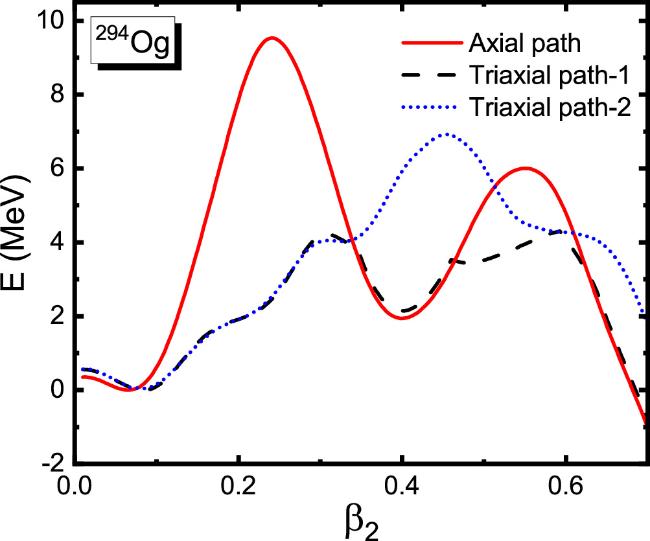
Figure 3. The calculated potential energy curves versus the primary deformation β2 for ${}_{118}^{294}$Og. The red solid line displays the potential energy curve for the axial path, whereas the black dash line shows the corresponding curve along the mathematically triaxial path-1 and the blue dot line represents the physically triaxial path-2. For the convenience of description, the energy curves are normalized with respect to the ground-state energy. |
The systematic multidimensional PES calculations for 291−296Og, 292−297119, and 293−298120 have been exhibited in figure 4, focusing on the influence of triaxiality on fission barriers in superheavy new elements. The PES calculations with odd-A or odd–odd nuclei are carried out by using the blocking method [44], which blocks the nucleon at several given orbitals around the Fermi surfaces. For example, according to figure 1, we block the positive neutron orbitals $2{g}_{\tfrac{7}{2}}$ and $3{d}_{\tfrac{5}{2}}$ to find the minimum energy since the ground-state of 291Og is near the spherical shape. Note that the PES between γ ∈ (0, 60°) and (−60°, 0) are symmetric. Then, it is enough to describe the fission path in the range of γ ∈ (0, 60°). In general, the scenes of the PESs in 291−296Og, 292−297119, and 293−298120 are similar to 294Og. For β2 < 0.1, the PESs near the minimum are very soft. Indeed, the equilibrium oblate or prolate shape could not be distinguishable to some extent. One can infer that the soft PES may correspond to vibrational collective properties [70]. Along the axial fission path, there is a relatively high fission barrier arising at β2 ≈ 0.21. With the inclusion of the triaxial degree of freedom, the triaxiality could drive the fission path to the low-lying saddle near the (β2, γ) ≈ (0.47, 40°) (triaxial path-2). If we search the triaxial fission path mathematically, it could find the minimized energy with respect to γ and β4 at each given β2 point (triaxial path-1). However, the triaxial path-1 is not continuous with the addition of β2 as mentioned in figure 3.
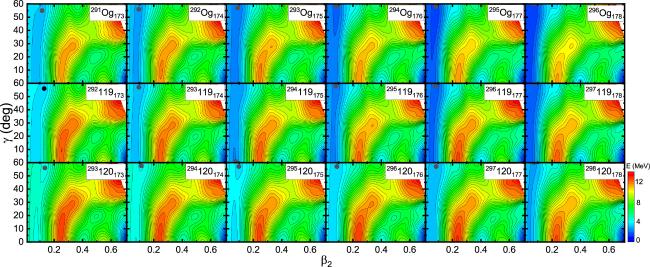
Figure 4. Similar to figure 2, but for 291−296Og, 292−297119, and 293−298120, respectively. For convenience, the energy is normalized with respect to the minimum of each PES. |
Taking the above facts into account, systematic potential energy curves for 291−296Og, 292−297119, and 293−298120 have been displayed in figure 5. Similar to figure 3, there are three fission paths, i.e. axial path, triaxial path-1, and triaxial path-2, obtained for these nuclei. The evolution of the fission barrier structure has been shown systematically with the increasing nucleon numbers. Recently, Cai and Yuan, based on random forest-based predictions, suggest α decay is the dominant decay mode for superheavy new elements Z = 119 − 122, except for a little spontaneous fission caused by the increased Coulomb repulsion and odd–even effect [71]. Generally, the fission barrier structure may play an important role in the theoretical prediction of the decay mode. For the axial path, the height of the fission barrier increases gradually with the addition of neutron numbers. However, with the inclusion of the triaxial degree of freedom, the height of triaxial path-1 does not vary significantly to some extent, though it is much lower (about 5 MeV) than the axial one. In general, the evolution of the fission barrier height in the triaxial path-2 is similar to the axial scenes, i.e. growing gently. Note that the width of the fission barrier in triaxial path-2 is much larger than the others, though there is only one hump in the range β2 < 0.7. In addition, the height of the fission barrier in the triaxial path-2 is almost comparable with the second fission barrier of the axial one in the lighter isotopes but higher than that in the heavier isotopes. Furthermore, regarding the fission barrier height, the nuclei 296119 and 297120 may be more likely to survive than their adjacent nuclei. Very recently, the discovery of new isotopes 222Np [72], 214U [73], 160Os and 156W [74] may render forthcoming High Intensity heavy-ion Accelerator Facility (HIAF) more confident to synthesizing the superheavy new elements. The present results indicate that the fission barrier of N = 177 is the highest among these three isotopes in the axial and triaxial path-2, possibly caused by the N = 178 subshell and odd–even effect. Finally, we summarize the calculated ground-state deformations β2 and the inner fission barriers Bf in table 1, together with other theoretical values for comparison. It should be pointed out that other theoretical values are obtained based on the FY single-particle potential and the finite-range droplet model (FRDM), namely ‘FFD' [75], the so-called ‘heavy nuclei' (HN) model [13], the Skyrme–Hartree–Fock–Bogoliubov (SHFB) approaches [76], the ETFSI methods [77], and the CDFT calculations [78]. Note that our calculated PESs are very soft near their ground-state equilibrium point. In general, the calculated β2 deformations are all very little except the ETFSI results. However, as shown in figure 4, our PES calculations actually suggest a fission isomer at β2 ≈ 0.4, though it is the minimum with ETFSI calculations. For the inner fission barriers Bf, the theoretical data by the FY single-particle potential and the FRLDM, namely ‘FFL' [10], the HN model [13], the SHFB approaches [76], the ETFSI methods [14], and the CDFT calculations [80] are given for comparison. Note that the β2 and Bf of SHFB approaches are applied with the SkM* parametrization. Generally, the triaxial calculations are lower than the axial results as expected. The Bf of SHFB approaches are highest and the CDFT ones are the lowest among these theoretical results. It is noteworthy that the Bf of N = 177 isotones by HN and ETFSI results are also higher than their neighbouring nuclei.
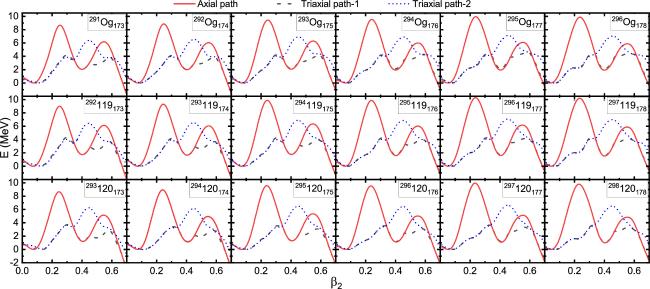
Figure 5. Similar to figure 3, but for 291−296Og, 292−297119, and 293−298120, respectively. |
Table 1. The calculated ground-state deformations β2 and inner fission barrier heights Bf for 291−296Og, 292−297119, and 293−298120. The β2 values with the FY+FRDM (FFD) [75], HN [13], SHFB [76], ETFSI [77] and CDFT [78] calculations, and the inner fission barriers Bf of the FY+FRLDM (FFL) [10], HN [13], SHFB [79], ETFSI [14] and CDFT [80] calculations, are given for comparison. |
| Nuclei | β2 | Bf | ||||||||||
|---|---|---|---|---|---|---|---|---|---|---|---|---|
| PESa | FFD | HN | ETFSI | SHFB | CDFT | PES | FFL | HN | ETFSI | SHFB | CDFT | |
| Tb | A | A | A | A | T | T | A | T | A | A | T | |
| 291Og | 0.115 | 0.075 | 0.08 | 0.43 | — | — | 6.34 | 8.41 | 6.40 | 7.1 | — | — |
| 292Og | 0.095 | 0.075 | 0.08 | 0.43 | −0.12 | 0.012 | 6.64 | 8.41 | 6.09 | 6.8 | 9.11 | 4.35 |
| 293Og | 0.090 | 0.075 | 0.08 | 0.43 | — | — | 6.97 | 8.53 | 6.62 | 7.4 | — | — |
| 294Og | 0.085 | 0.064 | −0.09 | 0.43 | −0.10 | 0.047 | 7.08 | 8.48 | 6.09 | 6.6 | 9.19 | 4.12 |
| 295Og | 0.083 | −0.084 | −0.09 | 0.43 | — | — | 7.38 | 8.46 | 6.64 | 7.1 | — | — |
| 296Og | 0.070 | −0.063 | −0.09 | 0.43 | −0.09 | 0.057 | 7.22 | 8.36 | 6.12 | 7.0 | 9.47 | 3.87 |
| 292119 | 0.130 | 0.086 | 0.08 | 0.43 | — | — | 6.31 | 8.05 | 6.55 | 7.1 | — | — |
| 293119 | 0.095 | 0.075 | 0.08 | 0.43 | — | — | 6.48 | 8.12 | 6.21 | 7.2 | — | — |
| 294119 | 0.078 | 0.075 | 0.08 | 0.43 | — | — | 6.80 | 8.29 | 6.95 | 6.8 | — | — |
| 295119 | 0.080 | 0.075 | 0.08 | 0.43 | — | — | 6.91 | 8.06 | 6.32 | 6.7 | — | — |
| 296119 | 0.080 | 0.064 | −0.10 | 0.43 | — | — | 7.19 | 8.07 | 6.71 | 7.2 | — | — |
| 297119 | 0.073 | −0.063 | −0.09 | 0.43 | — | — | 7.04 | 7.94 | 6.20 | 7.0 | — | — |
| 293120 | 0.135 | 0.086 | 0.09 | 0.43 | — | — | 6.13 | 7.44 | 6.06 | — | — | — |
| 294120 | 0.113 | 0.086 | 0.09 | 0.43 | −0.11 | 0.000 | 6.10 | 7.57 | 5.62 | 5.7 | 9.15 | 4.73 |
| 295120 | 0.098 | 0.075 | 0.09 | 0.43 | — | — | 6.41 | 7.71 | 6.28 | 6.1 | — | — |
| 296120 | 0.088 | 0.075 | 0.09 | 0.43 | −0.10 | 0.000 | 6.47 | 7.69 | 5.79 | 6.2 | 9.48 | 4.92 |
| 297120 | 0.085 | 0.064 | −0.10 | 0.43 | — | — | 6.74 | 7.54 | 6.02 | 6.7 | — | — |
| 298120 | 0.073 | −0.063 | −0.09 | 0.43 | −0.09 | 0.000 | 6.56 | 7.33 | 5.56 | 6.6 | 10.05 | 4.27 |
aThe calculated ∣γ∣ values are not displayed because the ground-state of these nuclei is very soft and near spherical shape. | |
bThe label ‘T' stands for the calculations with triaxial deformation and ‘A' denotes the axial results. |
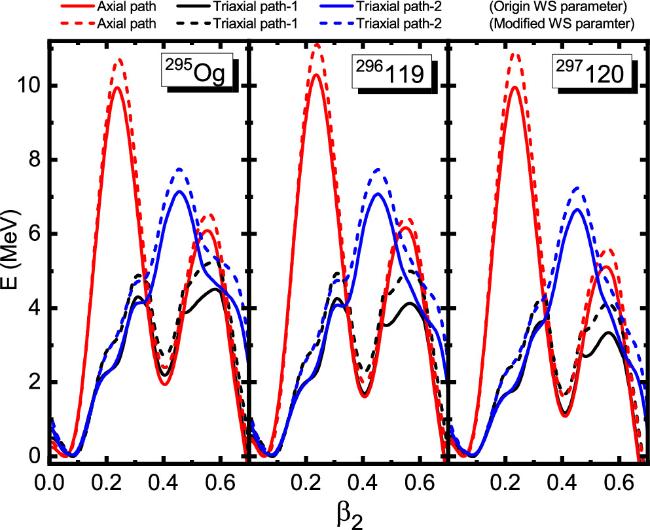
Furthermore, the single-particle levels used in the MM calculation are always deduced from the fitting procedures with the experimental observable. Therefore, the isospin dependence of the nuclear surface diffuseness parameter and the spin-orbit coupling strength should be considered carefully far away from the β-decay stable line [43, 81]. Previously, we have demonstrated that adjusting the Woods–Saxon potential parameters could modify the fission barrier structure [37, 82]. With this in mind, we exemplify the proton-rich nuclei to show the isospin-dependent effect, which may be helpful to the study of superheavy new elements. Follow the empirical β-stability line formula Z = A/(1.98 + 0.0155A2/3) [83–85], the nuclei 320Og, 322119, and 326120 may be excluded the possibility of the β decay. Thus, for the proton-rich nuclei 295Og, 296119, and 297120, their proton surface diffuseness parameter and spin-orbit coupling strength should be slightly enlarged. Referring to the isospin dependence of the strength of the spin-orbit potential λp and surface diffuseness ap [43], we illustrate the increased combination (0.73, 38) in the N = 177 isotones with the addition of proton numbers systematically. In figure 6, the fission barriers with the modified Woods–Saxon parameters are slightly raised, indicating that the corresponding half-life could be expanded by several orders of magnitude. For example, the first fission barrier height of the axial path increases by ∼0.8 MeV and the one of the triaxial path-2 has swollen by ∼0.6 MeV. A further investigation of the optimized Woods–Saxon parameter in superheavy nuclei is undergoing in our future work.
Figure 6. Similar to figure 3, but the potential energy curves compared with the modified Woods–Saxon (WS) parameter combination (ap = 0.73, λp = 38) for the proton-rich N = 177 isotones. All other potential parameters are still equal to those of universal values. |
4. Summary
In summary, we have systematically studied the influence of triaxial deformation on the fission barriers in the Z = 118 − 120 nuclei by using the pairing-deformation self-consistent PES calculation in the (β2, γ, β4) deformation space. Firstly, the calculated Woods–Saxon single-particle levels with universal parameter set indicate the next closed shell after Z = 82 and N = 126 are Z = 92, 114 and N = 164, 178, 184, though the shell gap yields at Z = 120 and 124 to some extent. Secondly, we illustrate three fission paths in the calculated PES of 294Og according to the (β2, γ) scale. The axial path is along the γ = 0°. The triaxial path-1 searches the minimum energy in the present deformation space with the increase of β2. The triaxial path-2 is obtained by the immersion method. The ground-state deformation of 294Og is oblate and very soft. The axial path and triaxial path-1 are double-humped, but the triaxial path-2 is only one hump in the range β2 < 0.7. Compared with the axial one, the height of the first fission barrier in the triaxial path-1 and triaxial path-2 has been reduced to 5.2 MeV and 2.4 MeV, respectively. Then, a systematical PES calculation is carried out in the Z = 118 − 120 nuclei. The height of the first fission barrier in the axial path and triaxial path-2 arises gradually with the addition of neutron numbers, but the fission barrier height of the triaxial path-1 varies little. It is found that the fission barrier heights of N = 177 isotones are the highest in the Z = 118 − 120 isotopes. Lastly, we have modified the strength of the spin-orbit potential and surface diffuseness due to the isospin dependence. The fission barriers with modified parameters are increased by more than half MeV compared with the origin Woods–Saxon parameters. The subsequent work will present an optimized Woods–Saxon parameter set in the superheavy nuclei. This systematic investigation should be helpful to the synthesis of superheavy new elements in both theoretical and experimental studies.
Conflict of interest
The authors declare that they have no known competing financial interests or personal relationships that could have appeared to influence the work reported in this paper.