


1. Introduction
Spontaneous pattern formation in driven systems constitutes an important universal phenomenon observed in disparate scenarios ranging from hydrodynamics, solid-state physics, nonlinear optics and chemistry to biology [1, 2]. In the past few decades, new advanced techniques achieved in Bose–Einstein condensates (BECs) provide an ideal setting to explore hydrodynamic instability in the quantum version [3]. One characteristic hydrodynamic instability is the parametric surface wave which is well-known in classic fluids. A paradigmatic example of pattern formation in parametrically driven surface waves is Faraday patterns (or waves) [4], which refer to standing waves arising through a parametric instability on the surface of a vertically vibrated fluid layer. One-dimensional Faraday patterns have been observed experimentally in elongated BECs by modulating periodically either the trap frequency in the tight confinement direction [5, 6] or the interatomic interaction through the Feshbach resonance [7]. On the theoretical side, following a complete analysis of the Faraday instability [8–12] and extensive numerical simulations [13, 14] for BECs, Faraday patterns are also studied extensively in a wealth of contexts, including dipolar BECs [15–18], fermionic superfluid [19, 20], multi-component BECs [21–25] and Bose–Fermi superfluid mixtures [26]. However, all the above studies focus on the one-dimensional pattern—the so-called striped pattern (comprised of a single standing wave) and higher-dimensional patterns still remain largely unexplored.
Very recently, generating two-dimensional spatial patterns has attracted a great deal of attention [27–29]. Due to the instability of surface modes with different azimuthal wavenumbers, polygon-shaped BECs varying from ellipses to heptagons are observed by a periodic modulation of the interatomic interaction with a single frequency [27]. The same method can also realize a square lattice pattern in homogeneous BECs [28], which is analytically demonstrated to correspond to a stable fixed point of time-evolution equations of amplitudes derived from the Gross–Pitaevskii (GP) equation [30]. In contrast, by modulating the interaction with dual-frequency [29], the emergences of square or hexagonal lattice patterns depend on the ratio of the two driving frequencies, in analog to the formation of superlattice patterns on the surface of a fluid resulting from three-wave resonant interactions [31].
In this work, we study the spatiotemopral pattern formation in a harmonically trapped BEC driven by a periodic modulation of the scattering length through the Feshbach resonance. In order to study the dynamical instability, we numerically solve the quasi-two-dimensional GP equation with a phenomenological dissipation term. Differently from pattern formations in homogenous BECs that are irrelevant to the driving frequency [28, 29], we find that the formation of a square lattice pattern in a harmonically trapped BEC should satisfy the resonant condition of the modulation frequency. We make a detailed study of the density distributions evolving at very small time steps driven by a continuous modulation of the interaction and a huge analysis of fast Fourier transformation (FFT) to the corresponding density distributions [32]. We observe the spatial and temporal periodicities of the oscillating lattice pattern. The spontaneous breaking of both continuous space and time translation symmetry is called space–time crystal, which has been realized in highly elongated BECs [33] and ultracold Fermi gases [34]. Our results are helpful for the realization of space–time crystals in a higher dimension.
Moreover, we study the effects of different driving strengths and dissipations on the dynamics of square lattice patterns. In order to unravel the underlying physics, we extract the time-evolution of the amplitudes of unstable modes from the momentum distributions. A triad interaction corresponding to the formation of a superlattice state is well explained by the nonlinear amplitude equation for superimposed stripes [2, 30].
This paper is organized as follows: in section 2 , we introduce the theoretical model and the parameter settings for our numerical simulations. In section 3 , we first demonstrate the resonant condition for the pattern formation. Then we present the numerical results for nonlinear dynamics of square lattice patterns under different driving strengths and dissipations, together with an analysis of the nonlinear amplitude equation. Section 4 is devoted to a conclusion.
2. Theoretical model
We consider the BEC confined in a harmonic trap potential, ${V}_{\mathrm{trap}}({\boldsymbol{r}})=\tfrac{1}{2}m[{\omega }_{\perp }^{2}({x}^{2}+{y}^{2})+{\omega }_{z}^{2}{z}^{2}]$. In order to achieve the quasi-two-dimension regime [35], we assume the trapping frequency ωz ≫ ω⊥, such that the dynamics in the z-direction are restricted to a zero-point state [36]. The normalized wave function along the z-axis is $\exp {(-{z}^{2}/2{a}_{z})/(\sqrt{\pi }{a}_{z})}^{1/2}$, with the corresponding oscillator length ${a}_{z}=\sqrt{{\hslash }/m{\omega }_{z}}$. The dynamics of the BEC are described by the following dimensionless time-dependent GP equation
$\begin{eqnarray}\begin{array}{l}(i-\gamma )\displaystyle \frac{\partial \phi (x,y,t)}{\partial t}=\left[-\displaystyle \frac{1}{2}{{\rm{\nabla }}}^{2}+{V}_{\mathrm{trap}}(x,y)\right.\\ \quad \left.+\,g(t)| \phi (x,y,t){| }^{2}-\mu (t)\Space{0ex}{3ex}{0ex}\right]\phi (x,y,t),\end{array}\end{eqnarray}$
where ∇2 = ∂2/∂x2 + ∂2/∂y2 and Vtrap(x, y) = (x2 + y2)/2. The spatial coordinates, time, condensate wave function and energies are in units of ${a}_{\perp }=\sqrt{{\hslash }/m{\omega }_{\perp }}$, ${\omega }_{\perp }^{-1}$, $\sqrt{{N}_{b}}/{a}_{\perp }$, ℏω⊥, respectively. We consider a typical system [37] with Nb = 2 × 10⁴ atoms of 7Li and the transversal and axial trapping frequencies of ω⊥ = 2π × 10 Hz and ωz = 2π × 2500 Hz.The interaction strength is harmonically modulated according to [38]
$\begin{eqnarray}\begin{array}{rcl}g(t) & = & \displaystyle \frac{2\sqrt{2\pi }N}{{a}_{z}}a(t)\\ & = & \displaystyle \frac{2\sqrt{2\pi }N}{{a}_{z}}{a}_{{bg}}\left[1+\displaystyle \frac{{\rm{\Delta }}}{B(t)-{B}_{\infty }}\right],\end{array}\end{eqnarray}$
with $\begin{eqnarray}B(t)=\bar{B}+{\rm{\Delta }}B\sin ({\rm{\Omega }}t).\end{eqnarray}$
The experimental parameters are taken as [38] abg = –24.5 a0, a0 being the Bohr radius, Δ = 192.3 G, B∞ = 736.8 G, and $\bar{B}=572.5$ G. ΔB is a driving amplitude and Ω is the driving or modulation frequency. In terms of these values, the modulated scattering length is approximated as $a(t)\,\approx 4.2{a}_{0}[1+0.04\,{\rm{\Delta }}B\sin ({\rm{\Omega }}t)]$. We define a relative modulation strength as δ = 0.04 ΔB, i.e δ = 1 for ΔB = 24 G.To account for finite-temperature effects, a dissipation parameter γ ≪ 1 is introduced phenomenologically into the GP equation [39]. Because of the dissipative term, the time-dependent GP equation (1 ) conserves neither the energy and the number of condensate atoms. In order to conserve the number of condensate atoms for a nonzero value of γ, the chemical potential μ(t) is treated as time-dependent and is adjusted at each time step. In our simulation, we calculate the correction to the chemical potential in every step as ${\rm{\Delta }}\mu \,={({\rm{\Delta }}t)}^{-1}\mathrm{ln}[\int {\rm{d}}x{\rm{d}}y| \phi (t){| }^{2}/\int {\rm{d}}x{\rm{d}}y| \phi (t+{\rm{\Delta }}t){| }^{2}]$ [40], which can conserve the norm, but the energy decreases monotonically eventually leading to stationary states. At the initial time t = 0, the interaction strength starts from ${\tilde{g}}_{0}\,=4.2{a}_{0}(2\sqrt{2\pi }{N}_{b}/{a}_{z})$, and the corresponding density distribution is $n(x,y)=| \phi (x,y){| }^{2}=[{\mu }_{g}-({x}^{2}+{y}^{2})/2]/{\tilde{g}}_{0}$ given by the Thomas–Fermi expression, with the chemical potential ${\mu }_{g}=\sqrt{{\tilde{g}}_{0}/\pi }$ determined by the normalization ∫∫dxdy n(x, y) = 1.
3. Numerical results
3.1. The formation of a square lattice pattern
We calculate the time-dependent root-mean-square widths of condensates as
$\begin{eqnarray}\begin{array}{l}\langle {x}^{2}(t){\rangle }^{1/2}=\sqrt{{\displaystyle \int }_{-\infty }^{+\infty }{\rm{d}}x{\displaystyle \int }_{-\infty }^{+\infty }{\rm{d}}y\ {x}^{2}| \phi \left(x,y,t\right){| }^{2}}.\end{array}\end{eqnarray}$
Due to rotational symmetry, the condensate widths in the x and y directions are the same Rrms(t) = ⟨x2(t)⟩1/2 = ⟨y2(t)⟩1/2. We show in figure 1 for a moderate driving strength δ = 0.42. When the driving frequency Ω corresponds to the frequency ωb = 2 of the breathing mode [37] in figure 1(a), one can find that condensates exhibit resonant oscillations [41–43]. As a result, the condensate undergoes dynamical instability accompanying by a pattern formation, which can be evidenced by the characteristic of the increases of both the expanding and shrinking sizes. By contrast, in the presence of dissipation γ = 0.01 denoted by dashed lines, the accounted finite-temperature effect attenuates the resonant oscillations and suppresses the pattern formation. The Fourier transform spectrum (right panel) contains a breathing (driving) mode of frequency ωb and its higher-order harmonics 2ωb.
Figure 1. Left panels: time-dependent condensate widths calculated as root-mean-square values Rrms(t) = ⟨x2(t)⟩1/2 = ⟨y2(t)⟩1/2 for (a) the driving frequency Ω = 2 resonant with a breathing oscillation and (b) the off-resonant driving frequency Ω = 1.46, respectively. The dashed line represents the dissipative case γ = 0.01. Right panels: the corresponding Fourier transform spectrum. |
For other frequencies of the driving out of the resonance, i.e. Ω ≠ nωb with n = 1, 2, … , we find no pattern formation. As an example, we exactly match the driving frequency Ω = ωq to another eigenmode. The frequency of quadrupole mode ${\omega }_{q}=\sqrt{\left(8+2p\right)/\left(2+p\right)}=1.46$ is corrected by the effect of finite atomic number $p=\sqrt{8/\pi }{N}_{b}a/{a}_{z}$ [44]. The resulting time evolution of the condensate width shows a beating phenomenon in figure 1(b), without the character of dynamical instability in the resonant case. The spectrum is made up of two primary excitations, a breathing mode of frequency ωb and a mode corresponding to the driving (quadrupole) mode Ω = ωq.
Under a continuous resonant driving δ = 0.42, we show the formation and dynamics of a square lattice pattern. After 6 periods of driving, a periodic lattice pattern emerges (see figure 2(a)). In the corresponding momentum distribution (right panel), it is clearly the wavevectors of two unstable modes on the critical circle ∣kx∣ = ∣ky∣ = 2πkc that are perpendicular kx · ky = 0. The obtained square lattice pattern is considered to be constructed by a superposition of two perpendicular sets of symmetric stripes. Due to this rotational symmetry, we only study one of the unstable modes, whose wavevector is indicated by the arrow and wavenumber is around 2πkc = 2π × 1.6. After a longer time (around 10 periods in figure 2(b)), the lattice pattern is developing and spanning over the space. In the momentum distribution, the amplitude of the unstable modes increases, accompanied with high-order mode from the coupling kf = kx + ky.
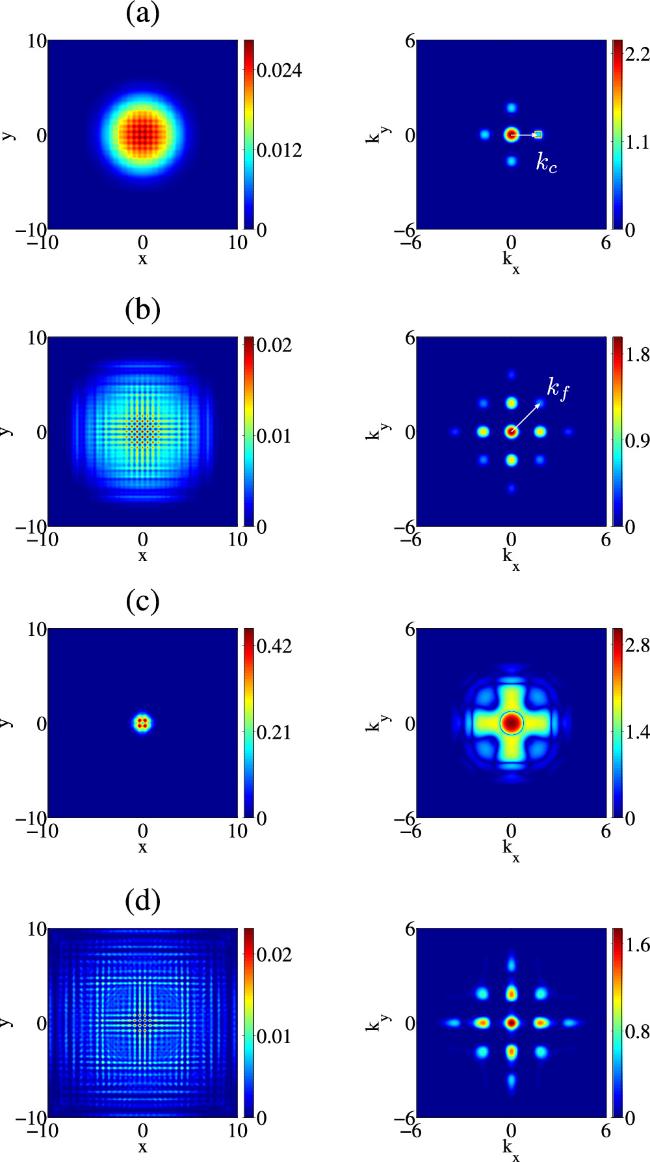
Figure 2. The time evolutions of a square lattice pattern under a continuous resonant driving δ = 0.42. Left panels: density distributions at (a) t = 18.02, (b) 30.36, (c) 34.46 and (d) 58.42, respectively. Right panels: the corresponding momentum distributions. The logarithm values of the Fourier transforms are used to improve the visibility of the momentum peaks. The critical wavevector kc and the coupling kf = kx + ky are marked. A square area with a side length of 0.4 is depicted, over which the mean value is calculated. |
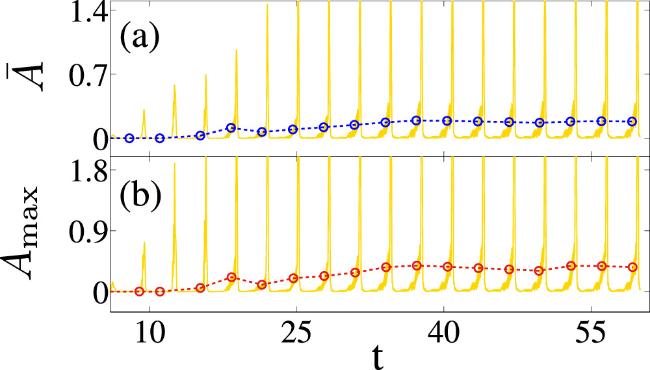
The square lattice pattern is periodically spaced and oscillates as a function of time. To get a better visualization we zoom out the central region. As indicated in figure 3(a), the pattern has a spatial periodicity λc = 0.6 in agreement with the critical wavenumber 2πkc = 2π/λc. We make a huge analysis of FFT to density distributions at one time step of 0.02 [32]. We plot the time evolutions of the critical wavevector located around kc. The mean values obtained by averaging over a square region (indicated by the box in figure 2(a)) are presented in figure 4(a), and the maximal values within the region are presented in figure 4(b).
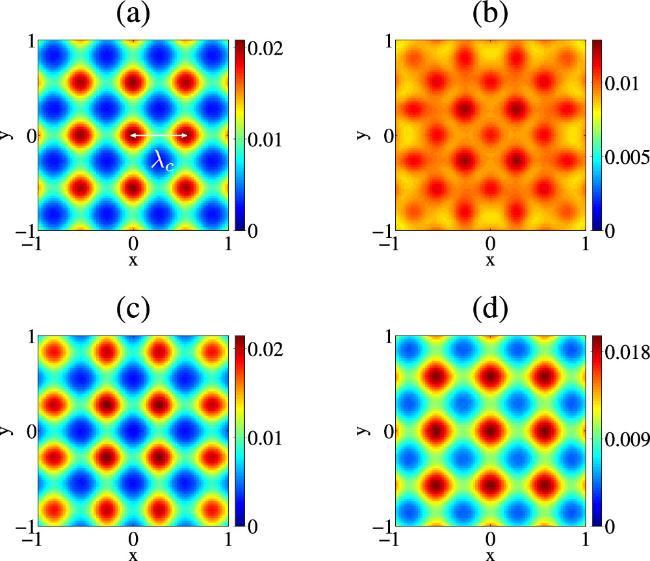
Figure 3. Time-periodic square lattice pattern with period Tc = 0.1. (a) t0 = 30.36, (b) t0 + Tc/4, (c) t0 + Tc/2, and (d) t0 + Tc. The case is the same as in figure 2. |
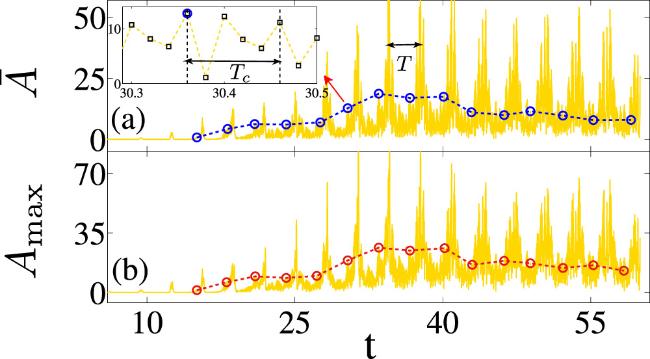
Figure 4. Time-evolutions of (a) mean $\bar{A}$ and (b) maximal ${A}_{\max }$ values of the critical wavevector at around kc = 1.6. The period of the breathing oscillation is indicated by T = π. The values corresponding to the amplitudes of the unstable mode are distinguished by open circles, and the dashed line is a guide to the eye. In the inset, one period of the oscillating pattern is indicated by Tc = 0.1. The driving strength is δ = 0.42 and no dissipation γ = 0. |
We note that the apparent peaks in figure 4 do not correspond to the amplitude of the unstable modes, but represent the situation of the minimum contracting of the condensate. As shown in figure 2(c), the condensate shrinks a lot with a deformed boundary displaying a polygon shape. As a consequence, the center momentum peak becomes prominent and occupies the regions of the critical wavevectors. The interval of two adjacent peaks is actually one period T = 2π/ωb = π of the breathing oscillation. The time-dependent amplitudes of the unstable mode are distinguished and denoted by open circles, in which the mean and maximal values are slightly different but their trends are the same.
We enlarge a very tiny range of time in the inset of figure 4(a) to show the amplitude of the unstable mode oscillating periodically, and mark one oscillation period by Tc = 0.1. In figure 3(a) the density distribution is taken at t = 30.36 (corresponding to the first circle in the range of Tc), where the crests of the pattern reach a maximal height and begin to descend. After half of the period (the third circle) the crests are replaced by troughs in figure 3(c), and the pattern recovers after one period in figure 3(d) at t = 30.36 + Tc (the last circle). To our knowledge, such temporal oscillation of a two-dimensional pattern [45] in BECs has not been reported in the literature.
The lattice square pattern results from the dynamical instability caused by an amplification of elementary excitation. Excitations in BECs are described by the Bogoliubov dispersion relation $\omega =\sqrt{{\left({k}^{2}/2\right)}^{2}+{\tilde{g}}_{0}{n}_{0}{k}^{2}}$, relating the excitation's angular frequency ω to the wavenumber $k=\sqrt{{k}_{x}^{2}+{k}_{y}^{2}}$ being the modulus of the two-dimensional wavenumber k = (kx, ky). The uniform density n0 is evaluated by the central density $n(0,0)=1/\sqrt{\pi {\tilde{g}}_{0}}$. For the modulus $k=\sqrt{2}\cdot 2\pi {k}_{c}$ of the unstable mode, the corresponding Bogoliubov frequency is ωc = 104 and the oscillation period is theoretically predicted by Tc = 2π/ωc = 0.06 consistent with the numerical result.
3.2. The effects of driving strength and dissipation
We plot the time evolutions of the amplitudes of unstable modes for different driving strengths without dissipation in figures 5(a) (mean value) and 5(b) (maximal value). Compared to the experimental findings [28], our numerical results showcase more information. The pattern formation is generally described by the nonlinear evolution equation for the amplitudes of superimposed stripes (standing waves) [2]5 ) is first derived from the Navier–Stokes equation for an incompressible and viscous fluid layer [46]. In a hydrodynamic system, the expression g(θnm) of the coupling function is crucial to determine the preferred patterns with various symmetries [47], e.g. N = 1 stripes; N = 2 squares; N = 3 hexagons or triangles; N = 4 and 5 (8- and 10-fold) quasi-crystalline. For a square pattern in BECs, an amplitude equation with N = 2 can be also analytically derived from the GP equation [30, 48], and the expressions of the coupling functions are provided explicitly.
$\begin{eqnarray}\displaystyle \frac{{\rm{d}}{A}_{n}}{{\rm{d}}t}=\sigma {A}_{n}-{g}_{0}{A}_{n}^{3}-\displaystyle \sum _{\displaystyle \genfrac{}{}{0em}{}{m=1}{m\ne n}}^{N}g({\theta }_{{nm}}){A}_{m}^{2}{A}_{n},\end{eqnarray}$
where σ is the linear growth rate, and the self-interaction coefficient g0 of a single stripe provides for the saturation of the amplitude. The coupling function g(θnm) gauges the interaction between strips n, m with an angle θnm between the wavevectors km and kn. The standing wave amplitude equation (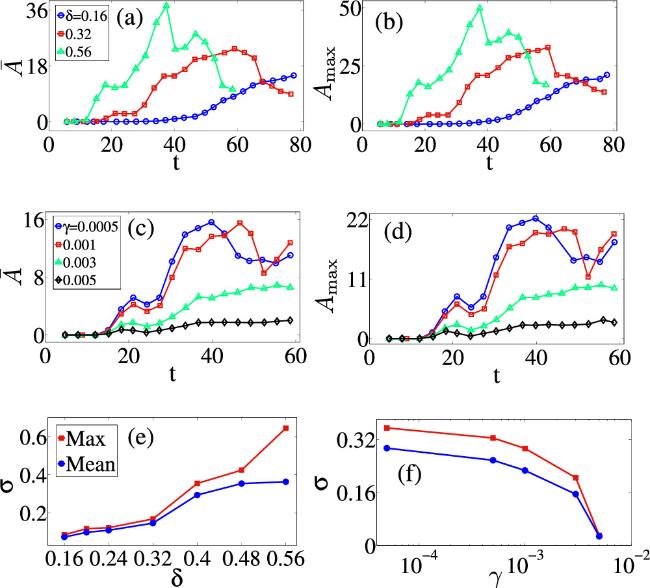
Figure 5. Time evolutions of the amplitudes ((a) for mean value and (b) for maximal value) of the unstable modes for different driving strengths and no dissipation γ = 0, and (e) is the dependences of exponential growth σ on the driving strengths. (c) and (d) for different dissipations and a fixed strength δ = 0.42, and (f) is the dependences of σ on the dissipation parameters. |
Under a weak driving strength δ = 0.16, the amplitude grows exponentially at a rate σ in the early time and gradually reaches steady values due to saturation [30, 48]. This is just the experimental observation (see figure 2(b) of [28]). One can easily understand it by the fact that the amplitudes of unstable modes generated by a weak strength are small, and only the first two terms of equation (5 ) dominate to govern the time evolutions. The exponential growth rate σ as expected by parametric resonance is fitted by the values in the early time, and its dependences on driving strengths are shown in figure 5(e).
However, if the driving strength increases δ = 0.32, one can find that the time evolutions of the amplitudes become qualitatively different. After increasing in the early time, the amplitudes descend significantly instead of saturation as in the case of the weak driving. With an increase of the driving strength δ = 0.56, the growth rate of the amplitude increases and its decrease rate also increases. The decrease in the amplitude of the unstable mode is attributed to the third term of equation (5 ), i.e. the triad (three-wave) interaction [47]. In our case, there are two relevant waves (N = 2 stripes in equation (5 )) with perpendicular wavevectors km = kx and kn = ky. The three-wave interaction involves a triad of wavevectors kn, km and kf = kn + km. The two waves with wavevectors km and kn couple to produce a third wave at kf (see figure 2(b)) with an amplitude proportional to AmAn. The third wave kf then couples back to the original wave at −km to give a contribution ${A}_{m}^{2}{A}_{n}$ to dAn/dt, providing a dissipation channel for the wave kn.
Such triad interaction can be evidenced by the momentum distribution of figure 2(d): after a continuous modulation of nearly 20 periods, the higher-order momentum becomes more significant but the critical momentum is weakened. From the density distribution of figure 2(d), we also find the formation of a superlattice pattern, which consists of the superposition of two discrete but interacting sublattices [31]. The emergent higher-order modes kf indicate the formation of a second square sublattice rotated by an angle π/4 with respect to the origin sublattice formed by the critical mode kc. The two square sublattices are coupled through the triad interaction and form the superlattice pattern.
The triad interaction along with the superlattice formation would be observed at low dissipation. In realistic situations, energy dissipation is always present due to finite temperatures. In figure 6 we discuss the effects of dissipations on the case of figure 2(d). One can find that the structure of the pattern is not affected, but the momentum peaks are less and less obvious as the damping γ increases. For the case of γ = 0.003 in figure 6(b) with the disappearance of the high-order wavevectors, the triad interaction is forbidden and the superlattice state vanishes. This can be also confirmed from figures 5(c) and (d) for γ = 0.003. The dissipation suppresses the increase of the amplitude of the unstable modes that saturates at the later stage, the same as the weak driving case. By examining the weaker damping γ = 0.0005 and 0.001, we further find that the amplitudes do not sustain to descend but increase at the later stage. It implies that the presence of the dissipation continuously attenuates the amplitudes of unstable modes and prevents the triad interaction. It is suggested that future experiments should keep the temperature as low as possible to observe superlattice states resulting from the triad interaction.
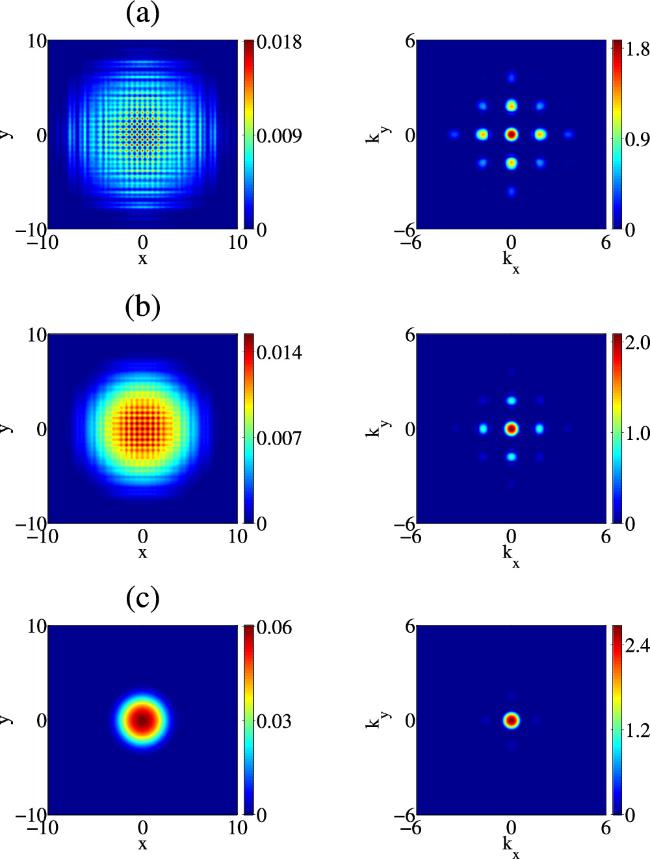
Figure 6. Effects of dissipations on the square lattice pattern at t = 58.42 under the driving strength δ = 0.42. (a) γ = 0.001, (b) 0.003 and (c) 0.01. Right panels: the corresponding momentum distributions. |
The square lattice pattern cannot be emergent for a strong damping γ = 0.01 as shown in figure 6(c). By comparing with figure 4 for no dissipation, figure 7 shows that the time-evolutions of the values of the wavevectors located around kc are strongly attenuated due to the strong damping, and the amplitude of the unstable mode does not exponentially grow (see the open circles). We plot the dependences of exponential growth rate σ on the dissipation parameters in figure 5(f), where σ = 0 for γ = 0.01 is not shown.
Figure 7. The same as in figure 4, but with the dissipation parameter γ = 0.01. |
4. Conclusion
We have studied the formation and nonlinear dynamics of a square lattice pattern in harmonically trapped BECs by periodically modulating the interatomic interaction. We find that the pattern formation emerges under the resonant condition that the driving (modulating) frequency is equal to an integral multiple of the frequency of the breathing mode. The obtained square lattice pattern contains two orthonormal stripes with the wavevectors on the critical circle. We observe not only the spatial periodicity of the lattice pattern but also the temporal oscillating frequency, which satisfies the Bogoliubov dispersion of the elementary excitations. All the mentioned intrinsic properties of the system are irrelevant to the driving strengths and the dissipations.
Moreover, we study the effects of driving strengths and dissipations on the time evolutions of the amplitudes of the unstable modes. The rich results include not only the saturation at the later time stage as observed experimentally, but also a significant decrease in the cases of strong driving strength and low dissipation. The decreases in the amplitudes of the unstable modes are attributed to the triad interaction, which is explained by the nonlinear amplitude equation for superimposed stripes. The observable superlattice state resulting from the triad interaction has not reported before. This work not only complements the recent experiments but also paves the way for engineering exotic patterns in future experiments [49, 50].