


1. Introduction
Under the impact of a time-delayed external force, the damped Helmholtz–Duffing oscillator exhibits a complicated system with multiple interacting dynamic elements. It takes a deep comprehension of these elements as well as the use of the proper mathematical methods to analyze such a system. These studies have applications in engineering, physics, and other scientific fields, in addition to being of academic interest. Understanding the dynamics of these oscillators can lead to discoveries in complex systems, improve control system design, and make it easier to predict system reactions in engineering applications. The Helmholtz–Duffing oscillator is a dynamical system that combines features of both the Helmholtz and Duffing oscillators, incorporating linear and nonlinear dynamics [1–4]. In this oscillator, the motion is influenced by an external forcing term, which can take various forms depending on the specific application [5–7]. The equation describing the forced Helmholtz–Duffing oscillator typically includes parameters representing mass, damping, spring stiffness, nonlinear effects, and the amplitude and frequency of the external forcing [8]. Understanding the behavior of the forced Helmholtz–Duffing oscillator is crucial in various fields such as mechanical engineering, physics, and applied mathematics, as it provides insights into phenomena like resonance, nonlinear vibrations, and chaotic behavior [9]. Research on this oscillator has been conducted extensively, with studies focusing on analytical solutions, numerical simulations, and experimental validations to explore its behavior under different conditions and parameter regimes (Reference: Provide relevant citations from studies on forced Helmholtz–Duffing oscillators) [10]. Research that covers various aspects of forced oscillators, including theoretical analysis, numerical methods, and applications in engineering and physics is pointed out in Literature [11]. The recent references delve into various aspects of the forced Helmholtz–Duffing oscillator, including dynamics, bifurcation analysis, chaos control, synchronization, and analytical studies, providing valuable contributions to the current understanding of this complex system [12–15].
Fractal forced nonlinear oscillators are used in many domains, including engineering and physics [16]. These systems are used in physics to simulate complicated phenomena like self-similarity, chaotic dynamics, and fractal patterns in natural systems [17]. The design and study of systems having nonlinear dynamics, such as electronic circuits, mechanical vibrations, and chemical reactions, are examples of engineering applications [18]. Fractal-forced nonlinear oscillators are also used in biology, neuroscience, and economics to investigate a variety of phenomena, including financial markets, ecological dynamics, and patterns of neuronal firing [19]. Fractal forced nonlinear oscillators have been applied in a variety of fields, according to recent research [20].
Applications of the forced Helmholtz–Duffing fractal nonlinear oscillator are found in several domains, including engineering and physics [21]. This complicated system is a useful tool for comprehending complex processes because it displays rich dynamical features like chaos, bifurcations, and self-similarity [22]. Its capacity to represent nonlinear dynamics is very useful in modeling biological systems, as recent studies have explored [23]. Furthermore, applications in communications and signal processing have been studied, utilizing the fractal character of the oscillator to improve the efficiency of information encoding and transmission [24]. Recent work by Li et al [25] showed the fractal-forced Helmholtz–Duffing oscillator's potential for useful engineering applications by demonstrating its usefulness in defect diagnosis of mechanical systems. Moreover, Zhang et al's work [26] has shown its efficacy in chaos-based cryptography, highlighting its significance for protecting sensitive data. The fractal-forced Helmholtz–Duffing nonlinear oscillator holds great potential for improving technological breakthroughs and deepening our understanding of complex systems, provided that researchers continue to investigate its wide range of applications [27].
Because of its special properties, the delayed fractal forced Helmholtz–Duffing nonlinear oscillator has potential applications in a variety of domains [28]. By combining delayed and fractal effects, this oscillator provides a more sophisticated understanding of intricate dynamical systems [29]. It is used in engineering to represent and analyze systems that respond slowly, like electrical circuits with feedback loops and vibrations in structures [30]. Furthermore, the delayed fractal forced Helmholtz–Duffing oscillator is a useful instrument in practical mathematics and physics for studying time delay and nonlinear dynamics phenomena such as pattern generation and synchronization [31].
The non-perturbative method holds significant promise across various fields for its ability to provide accurate solutions to complex problems without relying on perturbation techniques [32]. In physics, this method finds application in understanding and predicting phenomena ranging from quantum field theory to classical mechanics, offering insights into fundamental interactions and particle behavior [33]. In quantum mechanics, non-perturbative methods are essential for studying strong coupling regimes and phenomena such as confinement in quantum chromodynamics [34]. Moreover, in condensed matter physics, these methods are employed to explore exotic phases of matter, including topological insulators and superconductors [35]. In chemistry, non-perturbative techniques play a crucial role in modeling molecular dynamics and electronic structure calculations, enabling the accurate prediction of chemical reactions and material properties [36]. Additionally, in engineering and applied mathematics, non-perturbative methods are utilized for solving complex differential equations and optimizing system performance, with applications ranging from fluid dynamics to machine learning algorithms [37]. Recent advancements in non-perturbative methods, such as numerical algorithms and computational techniques, have further expanded their applicability, paving the way for breakthroughs in understanding and manipulating complex systems across multiple disciplines [38].
J H He provides a non-perturbative method in his works [39, 40] for figuring out how often nonlinear oscillators oscillate, specifically conservative nonlinear oscillators like the ones that are explained below:
$\begin{eqnarray}\ddot{u}+f(u)=0;\,u(0)=A\,{\rm{and}}\,\dot{u}(0)=0,\end{eqnarray}$
where $f(u)$ indicates the nonlinear restoring force that is odd. This author has utilized the function $f(u)$ to determine the frequency ${{\rm{\Omega }}}^{2}$ in the following form in the articles mentioned above $\begin{eqnarray}{{\rm{\Omega }}}^{2}=\mathop{\mathrm{lim}}\limits_{u\to \tfrac{1}{2}A}\displaystyle \frac{{\rm{d}}f(u)}{{\rm{d}}u}.\end{eqnarray}$
For the function's cubic nonlinearity, formula (2 ) has been well-worked. When applying this formula to higher odd nonlinearity, it was observed that there are errors. In order to account for higher odd nonlinearity, an improved version of He's frequency formula becomes necessary. As a result, the restoring function with higher odd nonlinearity has been examined in the following form:1 ), it has been proposed that the trial solution should have
$\begin{eqnarray}{f}_{\mathrm{odd}}(u)=\displaystyle \sum _{n=0}^{N}{a}_{2n+1}{u}^{2n+1},\end{eqnarray}$
where ${a}_{2n+1}$ indicate a coefficient that is constant. Based on the initial conditions specified in equation ( $\begin{eqnarray}{u}_{0}(t)=A\,\cos \,{\rm{\Omega }}t.\end{eqnarray}$
El-Dib [41] therefore changed He's frequency formula to have the form
$\begin{eqnarray}\begin{array}{rcl}{{\rm{\Omega }}}^{2}\left(A\right) & = & \mathop{\mathrm{lim}}\limits_{u\to \tfrac{1}{2}A}\displaystyle \sum _{n=0}^{\infty }\displaystyle \frac{1}{n!}{a}_{2n+1}{u}^{n-1}{D}_{u}^{n}{u}^{2n+1}\\ & = & {a}_{1}+\displaystyle \frac{3}{4}{a}_{3}{A}^{2}+\displaystyle \frac{5}{8}{a}_{5}{A}^{4}+\displaystyle \frac{35}{64}{a}_{7}{A}^{6}\\ & & +\,\displaystyle \frac{63}{128}{a}_{9}{A}^{8}+\displaystyle \frac{231}{512}{a}_{11}{A}^{10}\mathrm{..}.\\ & = & \displaystyle \frac{1}{{2}^{2n}}\displaystyle \frac{\left(2n+1\right)!}{n!\left(n+1\right)!}{a}_{2n+1}{A}^{2n}.\end{array}\end{eqnarray}$
This is a development of He's fundamental frequency formula, where ${D}_{u}^{n}$ represents nth order derivative concerning the variable u. The polynomial (5 ), in conclusion, can be rewritten as
$\begin{eqnarray}{{\rm{\Omega }}}^{2}\left(A\right)=\displaystyle \sum _{n=0}^{N}{k}_{n}{A}^{2n}{a}_{2n+1},\end{eqnarray}$
where the following can be done to evaluate the number kn using the least squares method's property: $\begin{eqnarray}{k}_{n}=\displaystyle \frac{2}{T}{\int }_{0}^{T}{\left(\displaystyle \frac{{\rm{d}}{u}_{0}(t)}{{\rm{d}}A}\right)}^{2n+2}{\rm{d}}t;\,T=\displaystyle \frac{2\pi }{{\rm{\Omega }}}.\end{eqnarray}$
When quadratic nonlinear oscillation has been considered as
$\begin{eqnarray}\ddot{u}+{f}_{\mathrm{even}}(u)=0;\,u(0)=A\,\mathrm{and}\,\dot{u}(0)=0,\end{eqnarray}$
$\begin{eqnarray}{f}_{\mathrm{even}}(u)=\displaystyle \sum _{n=1}^{N}{a}_{2n}{u}^{2n}.\end{eqnarray}$
In the case of the quadratic nonlinearity, El-Dib's modification for the frequency formula [41] has been suggested as
$\begin{eqnarray}{{\rm{\Omega }}}^{2}\left(A\right)=\displaystyle \sum _{n=1}^{N}\displaystyle \frac{{a}_{2n}}{2n+1}{k}_{n}{A}^{2n}.\end{eqnarray}$
Observing that the frequency provided in (10 ) can be obtained by replacing the quadratic function $g(u)$ with
$\begin{eqnarray}G(u)={\int }_{0}^{u}{f}_{\mathrm{even}}(p){\rm{d}}p=\displaystyle \sum _{n=1}^{N}\displaystyle \frac{{a}_{2n}}{2n+1}{u}^{2n+1}.\end{eqnarray}$
Observably, when the oscillation has non-zero beginning conditions and odd and quadratic nonlinearity, such that
$\begin{eqnarray}\ddot{u}+{f}_{\mathrm{odd}}(u)+{f}_{\mathrm{even}}(u)=0;\,u(0)=A\,\mathrm{and}\,\dot{u}(0)=B,\end{eqnarray}$
then the frequency can be sought as $\begin{eqnarray}{{\rm{\Omega }}}^{2}\left(r\right)={a}_{1}+\displaystyle \sum _{n=1}^{N}\left({a}_{2n+1}+\displaystyle \frac{{a}_{2n}}{2n+1}\right){k}_{n}{r}^{2n},\end{eqnarray}$
where ${r}^{2}={A}^{2}+\tfrac{{B}^{2}}{{{\rm{\Omega }}}^{2}}.$It is important to note that, as long as the restoring function excludes the velocity $\dot{u}$ or $\ddot{u}$ and their combination, the frequency formula mentioned above has been successfully applied. El-Dib [41] created the best and most efficient formula to address these drawbacks, and it may be used to generate successive approximations of the nonlinear oscillation solutions [42]. To summarize, the linearized version of equation (1 ) has the following form:
$\begin{eqnarray}\ddot{u}+{{\rm{\Omega }}}^{2}u=0.\end{eqnarray}$
The following error was made while comparing equations (14 )–(1 ):
$\begin{eqnarray}E({{\rm{\Omega }}}^{2})=\left|f(u,\dot{u})-{{\rm{\Omega }}}^{2}u\right|.\end{eqnarray}$
The mean square error is defined as
$\begin{eqnarray}{\bar{E}}^{2}({\Omega }^{2})={\int }_{0}^{T}{\left(f\left(u,\dot{u}\right)-{\Omega }^{2}u\right)}^{2}{\rm{d}}t.\end{eqnarray}$
The minimum value requires that
$\begin{eqnarray}\begin{array}{l}\displaystyle \frac{{\rm{d}}{\bar{E}}^{2}\left({\Omega }^{2}\right)}{{\rm{d}}\left({\Omega }^{2}\right)}\\ =\,\displaystyle \frac{{\rm{d}}}{{\rm{d}}\left({\Omega }^{2}\right)}{\int }_{0}^{T}\left[{\Omega }^{4}{u}^{2}-2{\Omega }^{2}uf\left(u,\dot{u}\right)+f{\left(u,\dot{u}\right)}^{2}\right]{\rm{d}}t=0.\end{array}\end{eqnarray}$
Since the function $f\left(u,\dot{u}\right)$ is not related to the frequency ω the simplification leads to
$\begin{eqnarray}{\Omega }^{2}{\int }_{0}^{T}{u}^{2}(t){\rm{d}}t-{\int }_{0}^{T}u(t)f\left(u,\dot{u}\right){\rm{d}}t=0.\end{eqnarray}$
The El-Dib's formula is the outcome of solving equation (18 ) [43]. The aforementioned integrals can be used to determine the frequency that corresponds to the suitable trial solution that meets the beginning requirements. This approach has the advantage of allowing frequency analysis for consecutive approximations to the generalized Duffing oscillator. The most effective and simple way to calculate frequency is with the formula shown above. The accuracy of the frequency formula is verified by the above-described analytical process.
2. Description of the problem in continuous space
The particular form of the differential equation governing the dynamics of a damped Helmholtz–Duffing oscillator impacted by a forced delay in continuous space must be taken into consideration for analysis. This kind of oscillator is a complicated dynamical system that combines the features of Duffing and Helmholtz oscillators, as well as the effects of external forcing and damping. Usually, the equation has terms that indicate:
$\begin{eqnarray}\ddot{u}+\mu \dot{u}+{\omega }_{0}^{2}u+{P}_{1}{u}^{2}+{P}_{2}{\dot{u}}^{2}+{P}_{3}u\dot{u}+Q{u}^{3}=\theta (t-{\tau }_{0}),\end{eqnarray}$
along, with the initial conditions: $\begin{eqnarray}u(0)=A\,{\rm{and}}\,\dot{u}(0)=0.\end{eqnarray}$
The term (ω02 u) represents the linear stiffness of the system, where ω0 is the natural frequency. It is responsible for the restoring force that tends to bring the system back to its equilibrium position. The term μ$\dot{u}$ represents the damping, which accounts for the loss of energy in the system due to resistance forces. Its role is to gradually diminish the system's oscillations over time. In a damped oscillator, it usually appears as a function of the velocity, with a damping coefficient μ representing the strength of the damping. The part of the equation (P1u2+P2$\dot{u}$2+P3u$\dot{u}$) representing the Helmholtz oscillator dynamics encapsulates the specific nonlinear characteristics associated with the Helmholtz behavior. This part of the equation is crucial for modeling the specific responses of the Helmholtz oscillator within the system. The term Qu3 signifies the Duffing oscillator's contribution, emphasizing the cubic nonlinearity in the system. This nonlinearity is pivotal for capturing behaviors and responses that are not possible in linear systems, such as complex oscillatory patterns and potentially chaotic dynamics. The inhomogeneous term θ(t–τ0) represents the external force applied to the system. This force could be periodic and is subjected to a time delay τ0. The delay factor makes the system's response dependent on both its current state and its state at a previous time (t–τ0), adding a significant layer of complexity to the system's dynamics. Each of these elements plays a crucial role in determining the overall behavior of the damped Helmholtz–Duffing oscillator. The interplay between linear stiffness, damping, nonlinear Helmholtz and Duffing dynamics, and the time-delayed external force creates a rich tapestry of potential dynamical behaviors, which can be analyzed through various mathematical and computational techniques to understand and predict the system's behavior under different conditions.
3. Methodology
Because of the numerous contributions mentioned above, the differential equation for such an oscillator in continuous space may be complicated. Depending on the particulars of the oscillator and the type of external forcing, one may use non-perturbative techniques [43], perturbative approaches [1], or numerical methods [44] to solve or analyze the system (19 ). Understanding the behavior of the system under various circumstances, such as varied damping levels, the degree of nonlinearity, or the properties of the external delayed force, is frequently the aim.
Systems having a minor nonlinearity or a small parameter that can be enlarged benefit from the use of perturbation methods [1]. These techniques are particularly useful for systems that are nearly linear or have weakly nonlinear behavior since they approximate the solution by expanding it in series [45]. For extremely nonlinear systems, where perturbative approaches might not be applicable, non-perturbative strategies can be beneficial [46]. These methods are able to more fully capture the essence of the system's behavior without depending on small parameter expansions. Studying systems where nonlinear effects predominate is where it is most helpful. The non-perturbative approach offers a more straightforward way to analyze complex nonlinear systems, making it a valuable tool in various scientific and engineering applications [47]. It is especially beneficial in cases where traditional perturbative methods fall short, such as in systems with strong nonlinearities or far-from-equilibrium dynamics.
The essence of employing a non-perturbative approach in the analysis of nonlinear dynamical systems is presented. The non-perturbative approach simplifies the analysis of nonlinear systems by transforming the nonlinear differential equation into its linear counterpart [46]. This transformation is not a direct simplification but a strategic reconfiguration that aims to retain the core dynamics of the original nonlinear system [48]. The resulting linear oscillator is designed to encompass the entire oscillation history of the original nonlinear system [49]. It aims to represent the system's behavior over time accurately, despite the simplification from nonlinear to linear dynamics. The approach offers a more manageable pathway to understanding the system's behavior. The linearization process does not significantly deviate from the true behavior of the system.
The non-perturbative approach described here involves transforming a nonlinear dynamical system with a delayed periodic force into an equivalent system with damping and natural frequencies that are altered by nonlinearities and external forces. The approach can be outlined as follows:
Consideration is given to all potential quadratic nonlinearity in both displacement and velocity (P1u2+P2$\dot{u}$2+P3u$\dot{u}$). These nonlinear factors could be part of the nonlinear damping force and the nonlinear stiffness part, respectively. In order to construct the system frequency and establish the solution to the problem incorporating the impact of the quadratic nonlinearity, El-Dib [50] added a quadratic stiffness factor to the constitutive equation in the first place. To achieve this, a cubic term was used in place of the quadratic term while integrating over the variable u. A systematic non-perturbative approach was then used. Moreover, El-Dib [51] converts the damping inhomogeneous nonlinear oscillator to homogenous damping linear oscillating in the presence of an external stimulus. Through this process, it is possible to analyze how the amplitude of the damping solution varies with the model's various parameters and talk about how it differs from the linear model. On the other hand, when operating periodically, the nonlinear components can significantly impact the magnitude of the homogenous solution that attracts the oscillations. But for the current issue, the steps are as follows:
$\begin{eqnarray}{P}_{1}{u}^{2}+{P}_{2}{\dot{u}}^{2}\Rightarrow \displaystyle {\int }_{0}^{u}\left({P}_{1}{x}^{2}+{P}_{2}{\dot{x}}^{2}\right){\rm{d}}x,\end{eqnarray}$
$\begin{eqnarray}{P}_{3}u\dot{u}\Rightarrow {P}_{3}\dot{u}\displaystyle {\int }_{0}^{u}x{\rm{d}}x.\end{eqnarray}$
The delayed external force is introduced, which can also contribute to the equivalent frequency. This force is expressed as a function of time, considering the delay factor.
Consider the delayed external force is given as
$\begin{eqnarray}\theta (t-{\tau }_{0})=q\,\cos \,\omega \left(t-{\tau }_{0}\right)={\theta }_{C}\left(t;{\tau }_{0}\right)+{\theta }_{S}\left(t;{\tau }_{0}\right),\end{eqnarray}$
where $\begin{eqnarray}\begin{array}{c}{\theta }_{C}\left(t;{\tau }_{0}\right)=q\,\cos \,\omega {\tau }_{0}\,\cos \,\omega t,\\ {\theta }_{S}\left(t;{\tau }_{0}\right)=q\,\sin \,\omega {\tau }_{0}\,\sin \,\omega t.\end{array}\end{eqnarray}$
It is easy to rewrite the periodic force as
$\begin{eqnarray}\theta (t-{\tau }_{0})=\left(\displaystyle \frac{1}{u}\theta \left(t-{\tau }_{0}\right)\right)u.\end{eqnarray}$
Employing the identified nonlinear contributions (21 ) and (22 ) and the delayed external force (25 ), the original nonlinear equation (19 ) is transformed to
$\begin{eqnarray}\ddot{u}+g({u}^{2})\dot{u}+f(u;{\tau }_{0})u=0.\end{eqnarray}$
The transformed equation (26 ) is then rearranged to clearly define the nonlinear functions that influence the system's dynamics. These functions are expressed in terms of the system's parameters, including the nonlinearities and the external force where the nonlinear functions $g({u}^{2})$ and $f(u;{\tau }_{0})$ are
$\begin{eqnarray}g({u}^{2})=\mu +\displaystyle \frac{1}{2}{P}_{3}{u}^{2},\end{eqnarray}$
$\begin{eqnarray}f(u;\tau )={\omega }_{0}^{2}+Q{u}^{2}+\displaystyle \frac{1}{3}{P}_{1}{u}^{2}+{P}_{2}{\dot{u}}^{2}-\displaystyle \frac{u}{{u}^{2}}\theta (t-{\tau }_{0}).\end{eqnarray}$
It is worth noting that the form given in (26 ) represents a delayed forced Van der Pol–Duffing oscillator. This transformation makes the equation more tractable for analysis. The re-performed of the nonlinear equation (19 ) as pointed out in the form of equation (26 ) can be analyzed using various mathematical and computational techniques. The focus is on understanding how the damping, natural frequency, and external force (including its delay) influence the system's behavior.
In the non-perturbative approach, as outlined by El-Dib [43], the process involves a detailed analysis that accounts for the effects of equivalent damping μeq and natural frequency ωeq, along with the influences of nonlinearities, external forces, and their delayed effects. The methodology can be broken down into the following steps:
$\begin{eqnarray}{\mu }_{\mathrm{eq}}=\displaystyle \frac{{\int }_{0}^{T}g({u}^{2}){u}^{2}{\rm{d}}t}{{\int }_{0}^{T}{u}^{2}{\rm{d}}t},\end{eqnarray}$
$\begin{eqnarray}{\omega }_{\mathrm{eq}}^{2}=\displaystyle \frac{{\int }_{9}^{T}f(u;{\tau }_{0}){u}^{2}{\rm{d}}t}{{\int }_{0}^{T}{u}^{2}{\rm{d}}t}.\end{eqnarray}$
The approach starts with equations (29 ) and (30 ), which are key to analyzing the dynamics of the system. These equations presumably relate to the calculation of the equivalent damping coefficient and natural frequency, considering the nonlinear and time-delayed external force contributions. To perform the integrals in equations (29 ) and (30 ), a trial solution U(t) is proposed, defined in equation (31 )
$\begin{eqnarray}U(t)=A\,\cos \,{\rm{\Omega }}t.\end{eqnarray}$
The total frequency of the system, which is represented by the term Ω in the solution (31 ) will be found out later in the analysis. The trial solution is then applied to the formulas (29 ) and (30 ). This step is crucial since it allows us to integrate the equations and get the expressions μeq and ωeq. The trial solution should provide a realistic approximation of the system's behavior and help simplify the analysis while capturing the essential dynamics of the system. In this procedure, the oscillation period is defined as (T = 2π/Ω). In addition, the excited frequency ω may be normalized as (ω $\to \sigma /T$). Further, for simplicity, the delay parameter may normalize as (τ0 $\to $ τT) [52]. Once μeq and ωeq have been established the procedures result in the linear form of equation (26 ) being as follows:
$\begin{eqnarray}\ddot{u}+{\mu }_{\mathrm{eq}}\dot{u}+{\omega }_{\mathrm{eq}}^{2}u=0,\end{eqnarray}$
where $\begin{eqnarray}\begin{array}{rcl}{\omega }_{\mathrm{eq}}^{2} & = & {\omega }_{0}^{2}+\displaystyle \frac{3}{4}{A}^{2}Q+\displaystyle \frac{1}{4}{A}^{2}\left({P}_{1}+{\Omega }^{2}{P}_{2}\right)\\ & & -\,\displaystyle \frac{2q\sigma \left(\sin \left(\sigma -\sigma \tau \right)+\,\sin \,\sigma \tau \right)}{A\left({\sigma }^{2}-4{\pi }^{2}\right)},\end{array}\end{eqnarray}$
$\begin{eqnarray}{\mu }_{\mathrm{eq}}=\mu +\displaystyle \frac{{A}^{2}{P}_{3}}{8}.\end{eqnarray}$
In view of the initial conditions (20 ) the exact solution of equation (32 ) has the form
$\begin{eqnarray}u(t)=A{{\rm{e}}}^{-\tfrac{1}{2}{\mu }_{\mathrm{eq}}t}\left(\cos \,{\rm{\Omega }}t+\displaystyle \frac{1}{2{\rm{\Omega }}}{\mu }_{\mathrm{eq}}\,\sin \,{\rm{\Omega }}t\right).\end{eqnarray}$
The total frequency Ω in the trial solution (31 ) is a crucial aspect of the research. It needs to be determined in a way that accurately reflects the dynamics of the system, accounting for the influence of the external force and nonlinearity. Once Ω has been established, after expressing the force in terms of a potential function the study of the system's behavior can be carried out. This entails comprehending the interactions and effects on the system's overall dynamics of the damping, frequency, nonlinearities, and external influences (including delays)
$\begin{eqnarray}{{\rm{\Omega }}}^{2}={\omega }_{{\rm{e}}{\rm{q}}}^{2}-\displaystyle \frac{1}{4}{\mu }_{{\rm{e}}{\rm{q}}}^{2}.\end{eqnarray}$
The stability criteria require that the frequency Ω be real values,
$\begin{eqnarray}{\omega }_{{\rm{e}}{\rm{q}}}^{2}-\displaystyle \frac{1}{4}{\mu }_{{\rm{e}}{\rm{q}}}^{2}\gt 0.\end{eqnarray}$
Insert (36 ) into (33 ) the equivalent natural frequency becomes free of the frequency Ω as follows:
$\begin{eqnarray}\begin{array}{l}{\omega }_{\mathrm{eq}}^{2}=\displaystyle \frac{4}{4-{A}^{2}{P}_{2}}\Space{0ex}{2.5ex}{0ex}({\omega }_{0}^{2}+\displaystyle \frac{3}{4}{A}^{2}Q+\displaystyle \frac{1}{4}{A}^{2}{P}_{1}\\ -\,\displaystyle \frac{2q\sigma \left(\sin \left(\sigma -\sigma \tau \right)+\,\sin \,\sigma \tau \right)}{A\left({\sigma }^{2}-4{\pi }^{2}\right)}-\displaystyle \frac{{A}^{2}{P}_{2}}{16}{\mu }_{\mathrm{eq}}^{2}\Space{0ex}{2.5ex}{0ex}).\end{array}\end{eqnarray}$
Employ (38 ) into the stability condition (37 ) yields
$\begin{eqnarray}\begin{array}{l}\displaystyle \frac{4}{4-{A}^{2}{P}_{2}}\Space{0ex}{2.5ex}{0ex}({\omega }_{0}^{2}+\displaystyle \frac{3}{4}{A}^{2}Q+\displaystyle \frac{1}{4}{A}^{2}{P}_{1}\\ -\,\displaystyle \frac{2q\sigma \left(\sin \left(\sigma -\sigma \tau \right)+\,\sin \,\sigma \tau \right)}{A\left({\sigma }^{2}-4{\pi }^{2}\right)}-\displaystyle \frac{1}{4}{\mu }_{\mathrm{eq}}^{2}\Space{0ex}{2.5ex}{0ex})\gt 0.\end{array}\end{eqnarray}$
3.1. Numerical validation
The effectiveness of the approach used in this study was verified through a comparison between the analytical solution derived in equation (35 ) and the numerical solution of the original equation (19 ). It is noted that the software used to generate the figures, is the Mathematica 12.1. For a system with specific parameters, including P1 = P2 = P3 = Q = 0.01, μ = 0.1, ω0 = 1, τ = 0.1, q = 0.1, σ = 4, A = 1, a comparison was made and illustrated in figure 1. The histogram displays the computation results, showing excellent agreement between the analytical and numerical solutions. The relative error between the two solutions was found to be −0.00216, indicating a high level of consistency. This comparison confirms that the effects of the excitation frequency, the magnitude of the external delayed force, and the quadratic nonlinearity were all appropriately incorporated into the frequency of the system's response. The close agreement between the analytical and numerical solutions further validates the effectiveness and accuracy of the approach used in this study. This verification process enhances confidence in the reliability of the results and underscores the utility of the proposed methodology for analyzing similar systems in the future.

Figure 1. Comparison of the numerical solution of equation ( |
The stability criterion presented in equation (39 ) is visualized in figure 2. This criterion is essential as it ensures the validity of the solution derived in equation (35 ), contingent upon the damping coefficient μeq being positive. The plot depicts the (σ–q) plane, where the stable and unstable regions are delineated. Within the stable region, it is observed that very small values of q have negligible effects on the stability behavior. However, as q increases, an unstable zone emerges within the stable region at a specific value of q for τ = 0.1. This unstable zone takes the shape of a parabola, starting at the position of (0.3355, 7.679). The width of this unstable zone increases with increasing q, illustrating how the amplitude of the stimulated force can lead to instability. Furthermore, the behavior of the unstable region's parabola changes with variations in the delay parameter τ. Specifically, as τ increases, the width of the unstable region's parabola decreases, indicating a stabilizing effect. This behavior suggests that raising the delay parameter τ has a stabilizing influence on the system, leading to a reduction in the potential for instability. Overall, the visualization provided in figure 2 offers insights into how changes in parameters such as q and τ affect the stability behavior of the system, highlighting the importance of considering these factors in the analysis of resonance phenomena. For the identical system depicted in figure 2, the effect of increasing the damping parameter on the stability landscape is investigated and illustrated in figure 3. The variation of the damping coefficient μ is represented on the graph in figure 3. Upon examination of this graph, it becomes evident that as μ increases, the diameter of the unstable zone expands, and its position shifts towards lower values along the q-axis. This behavior implies that an increase in the parameter μ results in a destabilizing effect on the system. However, it is important to note that this behavior is specifically observed in the context of resonance response. Conversely, in the non-resonance scenario, the stabilizing effect of μ is well established, indicating that variations in the damping coefficient can have contrasting effects depending on the system's response regime. Overall, the insights provided by figure 3 shed light on the dynamic interplay between the damping coefficient μ and the stability behavior of the system, particularly in the context of resonance phenomena.
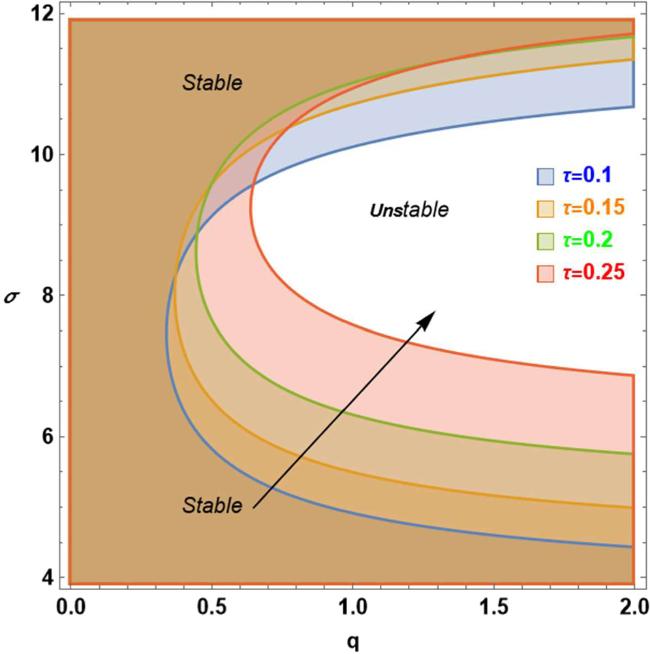
Figure 2. The plane (σ–q) illustrating the stability behavior for condition ( |

Figure 3. The plane (σ–q) illustrating the stability behavior for condition ( |
4. Description of the problem in fractal space
In a non-homogeneous medium, the properties of fractal space are well-suited for addressing the problem at hand [43]. Given the complexity of the problem, simplifying the mathematical process becomes crucial. The initial step involves converting the nonlinear problem into its equivalent linear form within the continuous space description. Subsequently, El-Dib's formula [53, 54] can be applied to transition the derivative from continuous space to its counterpart in fractal space. The solution to the resultant equation in fractal space can then be efficiently obtained using the two-scales method [55].
By replacing conventional continuous differential equations with fractal differential equations, researchers can deepen their understanding of the system's response within novel mathematical frameworks. In order to streamline mathematical analysis, previous researchers suggested converting fractal differential equations back to their continuous space counterparts. This was achieved using the two-scale approach by several authors such as He et al [54–59]. El-Dib and colleagues employed a clever and creative transformation method, as demonstrated in their seminal work [53, 54]
$\begin{eqnarray}\displaystyle \frac{{\rm{d}}u}{{\rm{d}}{t}^{\alpha }}={S}^{\alpha }\,\cos \left(\tfrac{1}{2}\pi \alpha \right)\,u+{S}^{\alpha -1}\,\sin \left(\tfrac{1}{2}\pi \alpha \right)\,\dot{u},\,0\lt \alpha \lt 1,\end{eqnarray}$
where S is a real constant indicating a fractalness parameter of the medium, depending on the fractal dimension α. Introducing the following notation: $\begin{eqnarray}\xi (\alpha )=S\,\cot \left(\tfrac{1}{2}\pi \alpha \right),\,\end{eqnarray}$
$\begin{eqnarray}\zeta (\alpha )={S}^{\alpha -1}\,\sin \left(\tfrac{1}{2}\pi \alpha \right).\end{eqnarray}$
Consequently, the form (40 ) is produced as
$\begin{eqnarray}\displaystyle \frac{{\rm{d}}u}{{\rm{d}}{t}^{\alpha }}=\zeta \left(\dot{u}+\xi u\right).\end{eqnarray}$
Investigating the forced Helmholtz–Duffing oscillator in fractal space presents a novel approach to understanding its dynamic behavior. By transitioning from conventional continuous differential equations to their fractal counterparts, one gains insights into the system's response under new mathematical frameworks. This analysis requires the development of innovative techniques for converting differential derivatives into fractal derivatives, paving the way for exploring oscillatory systems in non-traditional domains. Studies have shown that the dynamics of oscillators in fractal space can exhibit unique behaviors, with damping elements transitioning to diffuse and unstable characteristics compared to their counterparts in continuous space. These investigations offer valuable insights into the complexities of nonlinear systems and provide opportunities for further exploration in areas such as chaos theory, complex dynamics, and applied mathematics.
To establish the image of conventional continuous differential operators in the fractal shape one can proceed as follows:
Redesigned transformation (43 ) such that it becomes
$\begin{eqnarray}\dot{u}=\displaystyle \frac{1}{\zeta }\displaystyle \frac{{\rm{d}}u}{{\rm{d}}{t}^{\alpha }}-\xi u.\end{eqnarray}$
As a result, we can confirm that
$\begin{eqnarray}\begin{array}{rcl}\ddot{u} & = & \left(\displaystyle \frac{1}{\zeta }\displaystyle \frac{{\rm{d}}}{{\rm{d}}{t}^{\alpha }}-\xi \right)\left(\displaystyle \frac{1}{\zeta }\displaystyle \frac{{\rm{d}}}{{\rm{d}}{t}^{\alpha }}-\xi \right)u\\ & = & \displaystyle \frac{1}{{\zeta }^{2}}\left(\displaystyle \frac{{\rm{d}}}{{\rm{d}}{t}^{2\alpha }}-2\xi \zeta \displaystyle \frac{{\rm{d}}}{{\rm{d}}{t}^{\alpha }}+{\zeta }^{2}{\xi }^{2}\right)u.\end{array}\end{eqnarray}$
To illustrate the solution of equation (32 ) in fractal space we may transform the traditional derivative to the equivalent in the fractal space. This transformation can be accomplished through the following formula:
Using (44 ) and (45 ) in equation (32 ) with the initial conditions (20 ) resulted in a reduction to
$\begin{eqnarray}\displaystyle \frac{{\rm{d}}u}{{\rm{d}}{t}^{2\alpha }}+\zeta \left({\mu }_{eq}-2\xi \right)\displaystyle \frac{{\rm{d}}u}{{\rm{d}}{t}^{\alpha }}+{\zeta }^{2}\left({\xi }^{2}-{\mu }_{\mathrm{eq}}\xi +{\omega }_{\mathrm{eq}}^{2}\right)u=0.\end{eqnarray}$
In addition to the initial circumstances:
$\begin{eqnarray}u\left(0\right)=A,\,\displaystyle \frac{{\rm{d}}u\left(0\right)}{{\rm{d}}{t}^{\alpha }}=A\xi \zeta .\end{eqnarray}$
The form of the fractal solution of equation (46 ) under conditions (47 ) is performed as
$\begin{eqnarray}u\left({t}^{\alpha }\right)=A{{\rm{e}}}^{-\,\tfrac{1}{2}\left({\mu }_{\mathrm{eq}}-2\xi \right)\zeta {t}^{\alpha }}\left(\cos \,{\rm{\Theta }}{t}^{\alpha }+\displaystyle \frac{1}{2{\rm{\Theta }}}\zeta {\mu }_{\mathrm{eq}}\,\sin \,{\rm{\Theta }}{t}^{\alpha }\right),\end{eqnarray}$
where the system's fractal frequency Θ is given by $\begin{eqnarray}{\Theta }^{2}(\alpha )={\zeta }^{2}\left({\xi }^{2}-{\mu }_{\mathrm{eq}}\xi +{\omega }_{\mathrm{eq}}^{2}\right)-\frac{1}{4}{\zeta }^{2}{\left({\mu }_{\mathrm{eq}}-2\xi \right)}^{2}.\end{eqnarray}$
The simplification of (49 ) leads to
$\begin{eqnarray}{\Theta }^{2}(\alpha )={\zeta }^{2}\left({\omega }_{\mathrm{eq}}^{2}-\displaystyle \frac{1}{4}{\mu }_{\mathrm{eq}}^{2}\right).\end{eqnarray}$
4.1. The two-scales approach
To introduce the two-scale approach [55–59] the following transformation can be used:48 ) in the two-scale description becomes
$\begin{eqnarray}{t}^{\alpha }=\chi ,\end{eqnarray}$
accordingly, the fractal solution ( $\begin{eqnarray}u\left(\chi \right)=A{{\rm{e}}}^{-\,\tfrac{1}{2}\left({\mu }_{\mathrm{eq}}-2\xi \right)\zeta \chi }\left(\cos \,{\rm{\Theta }}\chi +\displaystyle \frac{1}{2{\rm{\Theta }}}\zeta {\mu }_{\mathrm{eq}}\,\sin \,{\rm{\Theta }}\chi \right).\end{eqnarray}$
Note that when the parameter ξ is selected to have the value $2\xi ={\mu }_{\mathrm{eq}},\,2\xi \lt {\mu }_{\mathrm{eq}},\,2\xi \gt {\mu }_{\mathrm{eq}},$ the fractal solution above can offer the periodic solution, damping solution, or increasing behavior, respectively.
4.2. Stability analysis
Given that Θ must be real and the damping coefficient must be positive for stability to exist, the following prerequisites must be met:
$\begin{eqnarray}{\omega }_{\mathrm{eq}}^{2}-\displaystyle \frac{1}{4}{\mu }_{\mathrm{eq}}^{2}\gt 0,\,\mathrm{and}\end{eqnarray}$
$\begin{eqnarray}\zeta \left({\mu }_{\mathrm{eq}}-2\xi \right)\gt 0.\end{eqnarray}$
Employing (38 ) into (53 ) becomes
$\begin{eqnarray}\begin{array}{l}\displaystyle \frac{4}{4-{A}^{2}{P}_{2}}\left({\omega }_{0}^{2}+\displaystyle \frac{3}{4}{A}^{2}Q+\displaystyle \frac{1}{4}{A}^{2}{P}_{1}\right)\\ -\,\displaystyle \frac{8q\sigma \left(\sin \left(\sigma -\sigma \tau \right)+\,\sin \,\sigma \tau \right)}{A\left(4-{A}^{2}{P}_{2}\right)\left({\sigma }^{2}-4{\pi }^{2}\right)}\gt \displaystyle \frac{1}{4}\left(\displaystyle \frac{4}{4-{A}^{2}{P}_{2}}\right){\mu }_{\mathrm{eq}}^{2}.\end{array}\end{eqnarray}$
The following stability criteria can be established by passing through conditions (54 ) and (55 ):
$\begin{eqnarray}{P}_{2}\lt \displaystyle \frac{4}{{A}^{2}},\,{\rm{and}}\end{eqnarray}$
$\begin{eqnarray}\begin{array}{c}{\omega }_{0}^{2}+\displaystyle \frac{3}{4}{A}^{2}Q+\displaystyle \frac{1}{4}{A}^{2}{P}_{1}\\ -\,\displaystyle \frac{2q\sigma \left(\sin \left(\sigma -\sigma \tau \right)+\,\sin \,\sigma \tau \right)}{A\left({\sigma }^{2}-4{\pi }^{2}\right)}\\ -\,\left(\mu +\displaystyle \frac{1}{8}{A}^{2}{P}_{3}\right)\xi +{\xi }^{2}\gt 0.\end{array}\end{eqnarray}$
The finding ζ 2 = 1 is reached when the frequency in equation (50 ), within fractal space, is compared to its counterpart in equation (36 ), within continuous space. This relation, applied by equation (42 ) yields the following result:
$\begin{eqnarray}S={S}^{\alpha }\,\sin \left(\tfrac{1}{2}\pi \alpha \right).\end{eqnarray}$
Once the fractal order α is chosen, the solution of the above transcendental equation provides the values of the parameter ξ. Subsequently, the stability condition given in equation (57 ) will be plotted as a function of α. This visualization will help us understand how the stability of the system varies with different values of the fractal order α. The calculations are performed for a system with the parameters $\mu ={P}_{1}={P}_{2}={P}_{3}=Q={\omega }_{0}=\tau =0.1$ and A = 1 as illustrated in figure 4. In this graph, the applied frequency parameter σ is plotted against its amplitude q. The plane is divided into stable regions and multi-unstable zones characterized by unstable-1, −2, … and so forth. These resonance zones occur along the increasing axis of σ. As σ is increased, the width of the unstable zones decreases. It is observed that the decrease in the α values leads to the suppression of the unstable effect. This role is more pronounced in the consecutive resonance zones. This implies that high values of σ support the stabilizing role of the decreasing parameter α. When the damping parameter μ is increased to μ = 0.3, as depicted in figure 5, the stabilizing role of both α and σ is impeded, as can be seen by comparing figures 4 and 5. Figure 3 illustrates the destabilizing effect that has been previously discovered in continuous space as a result of the rise in the parameter μ figure 6 shows the examination of a gradually increasing delay parameter τ on the stability image; for the identical system shown in figure 4, the delay parameter τ has risen to a value of τ = 0.17. A significant stabilizing impact is played by a very slight increase in τ, as demonstrated by the comparison of figures 6 and 4. This function is seen in figure 2 before.

Figure 4. The plane (σ–q) illustrating the stability behavior for condition ( |
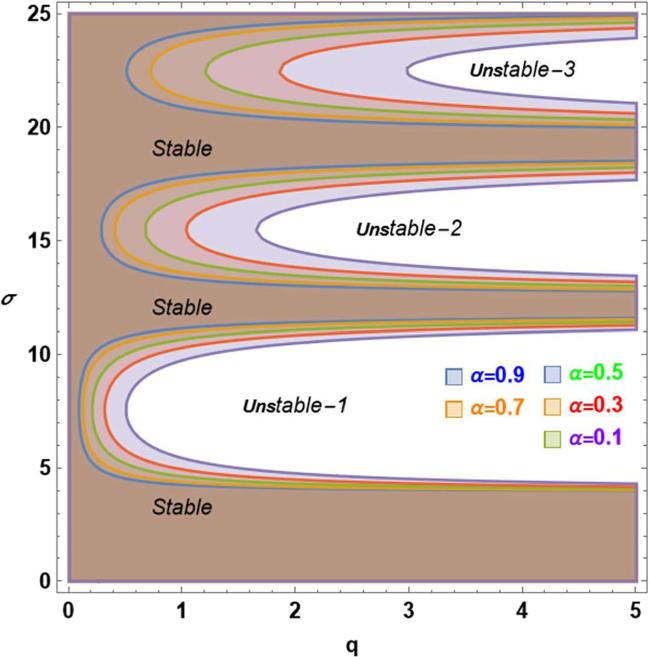
Figure 5. The plane (σ–q) illustrating the stability behavior for condition ( |

Figure 6. The plane (σ–q) illustrating the stability behavior for condition ( |
4.3. Illustration of the time-history in fractal space
The influence of the parameter α on the fractal solution is highlighted in figures 7 and 8, which show the time-history of the solutions (48 ) and (52 ) in fractal space. The system selected for analysis is the same as the one taken into consideration in figure 1, enabling an investigation of the effects of changes in α on the fractal solution's time history. It is noteworthy that figure 1 represents a damping behavior when α = 1. A very small variation in α (where α < 1) is shown in figures 7 and 8 to demonstrate how variations in this parameter affect the solution's behavior over time. The graph's red curve, representing the case where α = 0.99, is extremely similar to the situation shown in figure 1, where damping behavior is seen. Slowly decreasing α causes the oscillation's amplitude to grow over time, which eventually reduces the damping characteristic. The graph for the situation of α = 0.90 shows this transition, where the oscillation's amplitude grows more quickly. Increases in oscillation amplitude are considerably more noticeable when α is further decreased.

Figure 7. The variation of the fractal parameter α on the time-history for the fractal solution ( |

Figure 8. The variation of the fractal parameter α on the time history for the two-scale fractal solution ( |
These data suggest that there is a quick change in the mechanism controlling the damping behavior in fractal space. It is interesting to note that damping behavior in continuous space seems to have the opposite effect in fractal space. In the part that follows, this conclusion can be further clarified through analytical research.
4.4. Solution in fractal space that is not influenced by parameters S
Equations (48 ) and (52 ), which present fractal solutions, rely on parameter S for the parameters ξ and ζ, which in turn depend on α as defined in equations (41 ) and (42 ). The parameter ξ is still dependent on S even though the comparison of the frequencies provided by equations (50 ) and (36 ) results in the relation (58 ) with ζ = 1, which is independent of S. The following procedure can be used to get appropriate values for ξ such that it is independent of the parameter S [47]:
4.5. The residual approach
The residual function can be established by inserting the approximate solution (52 ) into equation (46 ) yielding the residual equation in the form
$\begin{eqnarray}\begin{array}{rcl}R({\rm{\Theta }};\chi ) & = & -\displaystyle \frac{1}{{\rm{\Theta }}}{{\rm{e}}}^{-\,\tfrac{1}{2}\left({\mu }_{\mathrm{eq}}-2\xi \right)\zeta \chi }\left({\rm{\Theta }}\,\cos \,{\rm{\Theta }}\chi +\displaystyle \frac{1}{2}\zeta {\mu }_{\mathrm{eq}}\,\sin \,{\rm{\Theta }}\chi \right)\\ & & \times \,\left({\Theta }^{2}+\displaystyle \frac{1}{4}{\zeta }^{2}{\mu }_{\mathrm{eq}}^{2}-{\zeta }^{2}{\omega }_{\mathrm{eq}}^{2}\right).\end{array}\end{eqnarray}$
It should be noticed that the weighted function multiplied by the frequency function found in equation (50 ) makes up the residual mentioned above. The following gives the weighted function:
$\begin{eqnarray}\displaystyle \frac{{\rm{d}}u(\chi )}{{\rm{d}}A}={{\rm{e}}}^{-\,\tfrac{1}{2}\left({\mu }_{\mathrm{eq}}-2\xi \right)\zeta \chi }\left(\cos \,{\rm{\Theta }}\chi +\displaystyle \frac{1}{2{\rm{\Theta }}}\zeta {\mu }_{\mathrm{eq}}\,\sin \,{\rm{\Theta }}\chi \right).\end{eqnarray}$
Given that the weighted function above is made up of two fundamental functions $\cos \,{\rm{\Theta }}\chi $and $\sin \,{\rm{\Theta }}\chi ,$ two Galerkin integrals are provided by50 ), the outcome of the aforementioned integrals can be found as
$\begin{eqnarray}\displaystyle \frac{2}{T}{\int }_{0}^{T}\displaystyle \frac{{\rm{d}}u}{{\rm{d}}A}\,\cos \,{\rm{\Theta }}\chi {\rm{d}}\chi =0,\end{eqnarray}$
$\begin{eqnarray}\displaystyle \frac{2}{T}{\int }_{0}^{T}\displaystyle \frac{{\rm{d}}u}{{\rm{d}}A}\,\sin \,{\rm{\Theta }}\chi {\rm{d}}\chi =0.\end{eqnarray}$
where T = 2π/Θ is the period. In terms of the frequency equation ( $\begin{eqnarray}2{\xi }^{2}-3\xi {\mu }_{\mathrm{eq}}+4{\omega }_{\mathrm{eq}}^{2}=0.\end{eqnarray}$
$\begin{eqnarray}-2\xi +3{\mu }_{\mathrm{eq}}=0.\end{eqnarray}$
The following values for the parameter ξ are found in these equations:
$\begin{eqnarray}\xi =\displaystyle \frac{3}{2}{\mu }_{\mathrm{eq}},\,\mathrm{and}\,\xi =\displaystyle \frac{3}{4}\left({\mu }_{\mathrm{eq}}\pm \sqrt{{\mu }_{\mathrm{eq}}^{2}-\displaystyle \frac{32}{9}{\omega }_{\mathrm{eq}}^{2}}\right).\end{eqnarray}$
The damping coefficient in the fractal equation (46 ) becomes negative when the parameter ξ is utilized in the first case, which causes the solution (52 ), to diverge as can be seen in figures 7 and 8. Incorporate the second, positive-sign value of ξ into the damping component of equation (46 ), which yields a negative damping coefficient with $4{\omega }_{\mathrm{eq}}^{2}\gt {\mu }_{\mathrm{eq}}^{2}$ in proportion to the reality value for Θ. The third instance of ξ's value is represented by the negative sign in (65 ). Using this third value results in a positive damping coefficient for equation (46 ), with a condition $4{\omega }_{\mathrm{eq}}^{2}\lt {\mu }_{\mathrm{eq}}^{2}$ that implies that Θ is imaginary. In the fractal space, the solutions (48 ) and (52 ) will exhibit growth behavior with these three possible values of the parameter ξ.
5. Conclusion
The current study delves into the influence of a delayed periodic external force on the stability dynamics of the Helmholtz–Duffing oscillator. Employing a non-perturbative methodology, the research transforms the initial nonlinear equation describing the oscillator's behavior into a comparable form akin to a simplified linear damping harmonic oscillator. This transformation is aimed at streamlining analysis while upholding fundamental aspects of the system. The investigation considers two key factors: the external periodic force exerted on the oscillator and its inherent quadratic nonlinearity. Notably, the periodic force is treated uniquely, assumed to possess a zero-power effect on the quadratic nonlinearity. By amalgamating the impacts of both odd and quadratic nonlinearities, alongside the influence of delayed forces, the study synthesizes a comprehensive system frequency. This frequency furnishes insights into the oscillatory behavior of the oscillator under the collective influence of these factors. Such an approach provides a deeper comprehension of how these elements interplay to impact the stability of the Helmholtz–Duffing oscillator, offering valuable insights into its behavior in practical settings. The numerical analysis showcases a noteworthy alignment between the numerical solution and the stability diagram. The stability diagram delineates unstable zones encircled by a stable region. Within these unstable regions, a parabolic contour emerges, expanding in width as the force's amplitude increases. Significantly, the delayed parameter exhibits a stabilizing effect, mitigating the likelihood of instability. Conversely, the original damping parameter contributes to a destabilizing effect, particularly pronounced in resonance scenarios.
The study was initially conducted within the framework of continuous space, where conventional derivatives characterize the differential equations. However, to delve into the oscillator's behavior within the realm of fractal space, a pioneering technique was introduced. This innovative approach marks the first attempt at converting conventional differential derivatives into fractal derivatives, thereby paving the way for novel insights into fractal systems. Upon transforming the simplified linear equation into a fractal equation, notable disparities in damping behavior between continuous and fractal spaces became apparent. In the fractal domain, the damping element exhibited a remarkable shift, evolving into a diffuse and unstable entity, in stark contrast to its damping effect in continuous space. Particularly within the resonance region, this transition was striking, with the periodic force generating numerous resonance zones under the fractal framework. Such observations underscore the profound impact of fractal dynamics on the behavior of oscillatory systems, opening new avenues for exploration and understanding in this field. The current attempt to convert into a fractalized system is a novel technique that is being used for the first time.