


1. Introduction
An efficient coupling of a laser beam with plasma is a topic of current research in many areas such as laser-induced fusion and charged particle acceleration [1–6]. In the laser-plasma coupling process, when a laser beam interacts with plasma, various parametric instabilities such as filamentation, harmonic generation, oscillating two-stream instability, stimulated Brillouin scattering (SBS), stimulated Raman scattering (SRS), etc., take place [7–13]. Stimulated Raman scattering (SRS) is an important nonlinear process in high-power laser- plasma interaction [14–17]. In stimulated Raman scattering process, an electromagnetic pump wave decays into a low-frequency plasma wave and a scattered electromagnetic sideband wave. The generated plasma wave can trap the electrons and accelerate them to high energies. The sideband can propagate in forward or backward directions [18–22].
An electron beam propagating in plasma may affect the growth of parametric instability [23, 24]. Electron beam–plasma instabilities are expected to play an important role in fast ignition. Such beams are produced by a high-power ignition laser interacting with long scale length plasmas. The relativistic electron beams are very useful for plasma heating via two-stream instability [25]. The instability associated with lower-hybrid waves may be excited by an electron beam in a plasma via Cerenkov interaction. The instability has the largest growth rate when the frequency and wave number of the modulation are comparable to that of the unstable wave [26]. The Raman instability of a laser in plasma is very sensitive with the electron beam. The instability growth is sensitive to phase matching of an electron beam with the plasma wave, which drops by an order of one due to phase mismatch [27]. Praburam and Sharma [28] have observed that the second-harmonic excitation of a Gould–Trivelpiece (GT) mode by an electron beam in a magnetized plasma. The power level of second-harmonic is enhanced when the second-harmonic frequency is closed to upper-hybrid frequency. The findings of this work have shown the effect of electron beam energy on GT mode excitation. Gupta and Sharma [29] have studied the beam driven large amplitude GT mode in a strongly magnetized plasma system. The GT mode parametrically couples to a beam space-charge mode and GT mode sideband to drive the instability. Moreover, Nakamura [30] proposed that the suppression of the two-stream instability oscillation occurred when the beam density was modulated with a frequency nearly equal to that of the oscillation. In all of these studies, it has been revealed that the propagation of an electron beam in plasmas may have significant effects in the excitation of parametric instabilities. Motivated by this previous research, we now investigate Raman instability in the presence of an electron beam in plasmas. The electron beam is density modulated to enhance the growth rate of the Raman instability.
In this paper, we study the SRS in laser-plasma interaction in the presence of a co-propagating density-modulated electron beam. We propose a way to enhance the growth rate of Raman instability in plasma, which is crucial in plasma accelerators, as well as in inertial conferment fusion. The density modulation in a co-propagating electron beam affects the low-frequency beam mode during the SRS. Consequently, the energy coupling among the interacting waves could be affected. As a result, the growth rate of the SRS can be modified. At resonance, when the density modulation parameter of the electron beam approaches one, the growth rate of the Raman instability could be maximized. The phase mismatch of the density-modulated electron beam is also studied, which reduces the growth rate of the Raman instability. Based on the proposed theoretical and analytical model, we claim that the inclusion of density modulation in a co-propagating electron beam severely affects the growth of Raman instability in a plasma. The growth rate of the SRS significantly enhances, which is crucial in laser-driven fusion. The paper is organized as follows: in section 2 , we obtain the growth rate of the SRS in phase-matched and phase-mismatched cases. We obtain the growth rate of SRS under beam-dominated decay in the Compton regime and the Raman regime in section 3 . Numerical results are discussed in section 4 . A summary of the results is presented in the last section of this paper.
2. Instability analysis
Consider the propagation of a density-modulated electron beam in a plasma. The equilibrium velocity of the electron beam is ${\upsilon }_{0b}^{0}\hat{z}(\approx {\omega }_{0b}/{k}_{0z}).$ The electron beam density is modulated as ${n}_{0b}^{0}+{n}_{s}\exp \left(-{\rm{i}}({\omega }_{0b}t-{k}_{0z}z)\right),$ where ${n}_{s}={n}_{0b}^{0}{\rm{\Delta }}$ and ${\rm{\Delta }}$ being the density modulation parameter (its value ranges from 0 to 1).
The laser has electric field ${{\boldsymbol{E}}}_{{\boldsymbol{0}}}=\hat{x}{A}_{0}\exp \left(-{\rm{i}}({\omega }_{0}t-{k}_{0}z)\right).$ The response of the electrons to the electromagnetic fields can be governed by the equation of motion and the equation of continuity. These equations can be solved in conjunction with Maxwell's equations. The response of the ions can be neglected as it is smaller than that of the electrons by the mass ratio $m/{m}_{i},$ where $m$ and ${m}_{i}$ are the masses of the electron and the ion, respectively. The pump laser beam imparts oscillatory velocity to the beam and plasma electrons as ${{\boldsymbol{v}}}_{0b}=e{{\boldsymbol{E}}}_{0}/m{\rm{i}}{\gamma }_{0}({\omega }_{0}-{k}_{0}{\upsilon }_{0b}^{0})$ and ${{\boldsymbol{v}}}_{0}=e{{\boldsymbol{E}}}_{0}/m{\rm{i}}{\omega }_{0},$ respectively, where ${\gamma }_{0}={\left(1-{{\upsilon }_{0b}^{0}}^{2}/{c}^{2}\right)}^{-1/2}$ is the relativistic factor for the beam electrons, $-e$ is the electron charge and $c$ is the speed of light in vacuum.
In the SRS process, an electromagnetic pump wave $({\omega }_{0},{k}_{0})$ is coupled with an electrostatic perturbation $\varnothing =\varphi \exp \left(-{\rm{i}}(\omega t-{kz})\right)$ and generates a scattered electromagnetic sideband ${{\boldsymbol{E}}}_{1}=\hat{{x}}{A}_{1}\exp \left(-{\rm{i}}\left({\omega }_{1}t-{k}_{1}z\right)\right).$ The phase matching conditions for the process can be written as ${\omega }_{1}={\omega }_{0}-\omega ,$ ${{\boldsymbol{k}}}_{1}={{\boldsymbol{k}}}_{0}-{\boldsymbol{k}}.$
The response of the beam electrons to the electrostatic perturbation can be obtained by solving the fluid equation of motion and the continuity equation
$\begin{eqnarray}\displaystyle \frac{\partial {{\boldsymbol{\upsilon }}}_{b}}{\partial t}+({{\boldsymbol{\upsilon }}}_{b}{\rm{\nabla }}){{\boldsymbol{\upsilon }}}_{b}=\displaystyle \frac{e}{m}{\boldsymbol{E}},\end{eqnarray}$
$\begin{eqnarray}\displaystyle \frac{\partial {n}_{b}}{\partial t}+{\rm{\nabla }}.({n}_{b}{{\boldsymbol{\upsilon }}}_{b})=0,\end{eqnarray}$
where $=-{\rm{\nabla }}\,\varphi .$By linearizing equations (1 ) and (2 ) with ${n}_{b}={n}_{0b}^{0}\,+{n}_{s}\exp \left(-{\rm{i}}({\omega }_{0b}t-{k}_{0z}z)\right)$ + ${n}_{\omega b}\exp \left(-{\rm{i}}(\omega t-{k}_{z}z)\right)$ and ${{\boldsymbol{v}}}_{b}\,={v}_{0b}^{0}\hat{z}+{v}_{\omega b}\hat{z}\exp \left(-{\rm{i}}(\omega t-{k}_{z}z)\right),$ we obtain the beam density perturbation at $\left(\omega ,{\boldsymbol{k}}\right)$ as
$\begin{eqnarray*}\begin{array}{ccc}{n}_{\omega b} & = & -({n}_{0b}^{0}+{n}_{s})e{k}_{z}^{2}\varphi /m{\gamma }_{0}{(\omega -{k}_{z}{\upsilon }_{0b}^{0})}^{2}\\ & & -{n}_{s}e{k}_{0z}{k}_{z}\varphi /m{\gamma }_{0}{(\omega -{k}_{z}{\upsilon }_{0b}^{0})}^{2},\end{array}\end{eqnarray*}$
$\begin{eqnarray*}{{\boldsymbol{v}}}_{\omega b}=e{\boldsymbol{E}}/m{\rm{i}}{\gamma }_{0}(\omega -{k}_{z}{\upsilon }_{0b}^{0}).\end{eqnarray*}$
The pump and sideband waves exert ponderomotive force on the beam and plasma electrons at $\left(\omega ,\,{\boldsymbol{k}}\right),$ i.e., ${{\boldsymbol{F}}}_{p}=e{\rm{\nabla }}{\,\varphi }_{p}$ and ${{\boldsymbol{F}}}_{{pb}}=e{\rm{\nabla }}{\,\varphi }_{{pb}},$ respectively, where ${\phi }_{p}\,=-(e/2m{\omega }_{0}{\omega }_{1}^{* }){E}_{0}{E}_{1}^{* }$ and ${\varphi }_{pb}=-(e/2m{\gamma }_{0}{\omega }_{0}{\omega }_{1}^{* }){E}_{0}{E}_{1}^{* }.$ The electron density perturbation at $\left(\omega ,\,{\boldsymbol{k}}\right)$ due to $(\phi ,{\phi }_{p})$ and $(\phi ,{\phi }_{pb})$ can be written as
$\begin{eqnarray}{n}_{e}=\frac{{k}_{z}^{2}}{4\pi e}{\chi }_{e}(\varphi +{\varphi }_{p}),\end{eqnarray}$
$\begin{eqnarray}{n}_{{eb}}=\frac{{k}_{z}^{2}}{4\pi e}{\chi }_{{eb}}\left(1+{\rm{\Delta }}\left(1+\frac{{k}_{0z}}{{k}_{z}}\right)\right)(\varphi +{\varphi }_{{pb}}),\end{eqnarray}$
where ${\rm{\Delta }}={n}_{s}/{n}_{0b}^{0},$ ${\chi }_{{eb}}=-{\omega }_{{pb}}^{2}/\left({(\omega -{k}_{z}{\upsilon }_{0b}^{0})}^{2}{\gamma }_{0}^{3}\right),$ ${\omega }_{{pb}}\,={(4\pi {n}_{0b}{e}^{2}/{\gamma }_{0}m)}^{1/2},$ and ${\chi }_{e}=-{\omega }_{p}^{2}/{\omega }^{2},$ and ${\omega }_{p}={(4\pi {n}_{0}{e}^{2}/m)}^{1/2}.$Using these expressions in Poisson's equation, we obtain
$\begin{eqnarray}\varepsilon \varphi =-{\chi }_{e}{\varphi }_{p}-{\chi }_{{eb}}{\varphi }_{{pb}},\end{eqnarray}$
where $\varepsilon =1+{\chi }_{e}+{\chi }_{{eb}}\left(1+{\rm{\Delta }}\left(1+\frac{{k}_{0z}}{{k}_{z}}\right)\right).$Both the plasma and beam electron density perturbations at $\left(\omega ,\,{\boldsymbol{k}}\right)$ couple with oscillatory velocity because the pump produces a nonlinear current at $\left({\omega }_{1},{{\boldsymbol{k}}}_{{\boldsymbol{1}}}\right),$ ${J}_{1}^{{NL}}\,=-({n}_{e}e{\upsilon }_{0}^{* }/2+{n}_{{eb}}e{\upsilon }_{0b}^{* }/2).$ Using the above equations, we obtain ${J}_{1}^{NL}=-\displaystyle \frac{{k}_{z}^{2}}{8\pi e}{\chi }_{e}(\phi +{\phi }_{p}){\upsilon }_{0}^{* }$ $-\displaystyle \frac{{k}_{z}^{2}}{8\pi e}{\chi }_{eb}\left(1+{\rm{\Delta }}(1+{k}_{0z}/{k}_{z})\right)\times (\phi +{\phi }_{pb}){\upsilon }_{0b}^{* }.$ For resonant decay $\varepsilon \approx 0,$ $(\phi \gt \,\gt {\phi }_{p},{\phi }_{pb}),$ we write
$\begin{eqnarray}\begin{array}{ccc}{{\boldsymbol{J}}}_{1}^{{NL}} & = & -\frac{{k}_{z}^{2}}{8\pi e}\frac{e{{\boldsymbol{E}}}_{0}{\varphi }^{* }}{m{\rm{i}}{\omega }_{0}}\left[\frac{{\omega }_{p}^{2}}{{\omega }^{2}}+\frac{{\omega }_{{pb}}^{2}}{{\gamma }_{0}^{3}{(\omega -{{k}_{z}\upsilon }_{0b}^{0})}^{2}}\right.\\ & & \left.{\rm{\times }}\left(1+{\rm{\Delta }}\left(1+\frac{{k}_{0z}}{{k}_{z}}\right)\right)\right].\end{array}\end{eqnarray}$
Following the standard method [31], the dispersion relation of the sideband electromagnetic wave can be written as5 ) and (7 ), we obtain the nonlinear dispersion relation of the SRS27,
$\begin{eqnarray}{\varepsilon }_{1}{{\boldsymbol{E}}}_{1}=-4\pi {\rm{i}}{\omega }_{1}{{\boldsymbol{J}}}_{1}^{{NL}},\end{eqnarray}$
where ${\varepsilon }_{1}={\omega }_{1}^{2}-{\omega }_{p}^{2}-{k}_{1}^{2}{c}^{2}.$ Using equations ( $\begin{eqnarray}\begin{array}{ccc}{\varepsilon \varepsilon }_{1} & = & \frac{{k}_{z}^{2}{{\rm{|}}{{\boldsymbol{v}}}_{0}{\rm{|}}}^{2}}{4}\left[\frac{{\omega }_{p}^{2}}{{\omega }^{2}}+\frac{{\omega }_{{pb}}^{2}}{{\gamma }_{0}^{3}{(\omega -{{k}_{z}\upsilon }_{0b}^{0})}^{2}}\right.\\ & & {\rm{\times }}{\left.\left(1+{\rm{\Delta }}\left(1+\frac{{k}_{0z}}{{k}_{z}}\right)\right)\right]}^{2}.\end{array}\end{eqnarray}$
In the absence of the pump, $({{\boldsymbol{\upsilon }}}_{0}=0),$ the factor on the right-hand side is equal to zero, yielding the dispersion relations of the beam mode $(\varepsilon =0)$ and the electromagnetic sideband wave $({\varepsilon }_{1}=0).$ In a resonant decay process (when ${{\boldsymbol{\upsilon }}}_{0}\ne 0$), we write $\omega ={\omega }_{r}+{\rm{i}}{\rm{\Gamma }}$ and ${\omega }_{1}={\omega }_{1r}+{\rm{i}}{\rm{\Gamma }},$ which are the roots of $\varepsilon =0$ and ${\varepsilon }_{1}=0,$ respectively. Now we expand $\varepsilon $ and ${\varepsilon }_{1}$ around $\omega $ and ${\omega }_{1},$ respectively, and use the Taylor expansion. Then equation (8 ) gives the maximum growth rate of the SRS as
$\begin{eqnarray}{{\unicode{x00413}}}_{m}^{2}=\frac{{k}_{z}^{2}{\left|{{\boldsymbol{v}}}_{0}\right|}^{2}}{16{\omega }_{1}}\frac{{\left[\frac{{\omega }_{p}^{2}}{{\omega }^{2}}+\frac{{\omega }_{{pb}}^{2}}{{\gamma }_{0}^{3}{\left(\omega -{{k}_{z}\upsilon }_{0b}^{0}\right)}^{2}}\left(1+\unicode{x02206}\left(1+\frac{{k}_{0z}}{{k}_{z}}\right)\right)\right]}^{2}}{\left[\frac{{\omega }_{p}^{2}}{{\omega }^{3}}+\frac{{\omega }_{{pb}}^{2}}{{\gamma }_{0}^{3}{\left(\omega -{{k}_{z}\upsilon }_{0b}^{0}\right)}^{3}}\left(1+\unicode{x02206}\left(1+\frac{{k}_{0z}}{{k}_{z}}\right)\right)\right]}.\end{eqnarray}$
In obtaining the instability growth rate, Landau damping has not been incorporated. We have considered a fluid theory for this instability, where Landau damping may not be important. For kinetic treatment, Landau damping may be important. Two-fluid theory is appropriate to obtain the growth rate of the instability with the phase-matched interaction of the electron beam with the plasma wave, where a finite maximum density perturbation (which does not become singular) is present. Thus, the absence of singularity confirms the validity of fluid equations for growth rate estimation. However, the density perturbation associated with the electron beam may have singularity beyond the maximum amplitude of the plasma wave due to the thermal effects, that we do not consider in this study. In that case, one needs to consider Landau damping for the instability growth rate.
CASE-I: Perfect phase matching: when ${\omega }_{p}={k}_{z}{\upsilon }_{0b}^{0},$ ${k}_{1}^{2}{c}^{2}={({\omega }_{p}-{\omega }_{0})}^{2}-{\omega }_{p}^{2}$ and $\omega ={\omega }_{p}+\delta ={k}_{z}{\upsilon }_{0b}^{0}+\delta .$ Using these conditions, we get
$\begin{eqnarray*}{\delta }^{3}={\omega }_{p}{\omega }_{{pb}}^{2}\left(1+{\rm{\Delta }}\left(1+\frac{{k}_{0z}}{{k}_{z}}\right)\right)/2{\gamma }_{0}^{3},\end{eqnarray*}$
and $\begin{eqnarray}\begin{array}{l}2\left({\omega }_{0}-{\omega }_{p}\right){\delta }^{3}\left(\displaystyle \frac{{\omega }_{pb}^{2}\left(1+{\rm{\Delta }}\left(1+\displaystyle \frac{{k}_{0z}}{{k}_{z}}\right)\right)}{{\gamma }_{0}^{3}}-\displaystyle \frac{2{\delta }^{3}}{{\omega }_{p}}\right)\\ =\displaystyle \frac{{k}_{z}^{2}| {\upsilon }_{0}{| }^{2}}{4}{\left(\displaystyle \frac{{\omega }_{pb}^{2}\left(1+{\rm{\Delta }}\left(1+\displaystyle \frac{{k}_{0z}}{{k}_{z}}\right)\right)}{{\gamma }_{0}^{3}}+{\delta }^{2}\right)}^{2}.\end{array}\end{eqnarray}$
In the absence of pump $({{\boldsymbol{\upsilon }}}_{0}=0),$ using the expression of ${\delta }^{2}=({\omega }_{p}/\delta )\left[{\omega }_{{pb}}^{2}\left(1+{\rm{\Delta }}\left(1+\frac{{k}_{0z}}{{k}_{z}}\right)\right)/2{\gamma }_{0}^{3}\right]$ in equation (10 ) and considering $(2{\omega }_{p}{\gamma }_{0}/2\delta )\gg 1,$ we obtain
$\begin{eqnarray}{\delta }^{2}{\delta }^{* }+\frac{{k}_{z}^{2}{\rm{|}}{\upsilon }_{0}{{\rm{|}}}^{2}{\omega }_{p}}{16({\omega }_{0}-{\omega }_{p})}\delta -\frac{{\omega }_{{pb}}^{2}\left(1+{\rm{\Delta }}\left(1+\frac{{k}_{0z}}{{k}_{z}}\right)\right){\omega }_{p}}{2{\gamma }_{0}^{3}}=0.\end{eqnarray}$
On solving the above equation, we obtain the growth rate as $\begin{eqnarray}{\delta }_{i}=(\sqrt[3]{16}{s}^{2}-\sqrt[3]{1/2}6p)/s,\end{eqnarray}$
where $p=\left({\omega }_{p}^{2}{\omega }_{pb}/16({\omega }_{0}-{\omega }_{p})\right)| {\upsilon }_{0}{| }^{2}/{{\upsilon }_{0b}^{0}}^{2},$ ${k}_{z}={\omega }_{p}/{\upsilon }_{0b}^{0},$ ${k}_{z}{\upsilon }_{0b}^{0}={\omega }_{p},$ $s=\left(4.5{\omega }_{pb}^{2}{\omega }_{p}\left(1+{\rm{\Delta }}(1+{k}_{0z}/{k}_{z})\right)/{\gamma }_{0}^{3}\right.$ ${\left.+1.73\sqrt{4{p}^{3}+27{({\omega }_{pb}^{2}\left(1+{\rm{\Delta }}(1+{k}_{0z}/{k}_{z})\right){\omega }_{p}/{\gamma }_{0}^{3})}^{2}}\right)}^{1/3},$ ${\gamma }_{0}={\left(1-{{\upsilon }_{0b}^{0}}^{2}/{c}^{2}\right)}^{-1/2},$ and ${\upsilon }_{0b}^{0}={\omega }_{p}c/{\omega }_{0}[{(1-{({\omega }_{p}/{\omega }_{0})}^{2})}^{1/2}-{(1-2{\omega }_{p}/{\omega }_{0})}^{1/2}].$CASE-II: Finite phase mismatch; When ${\omega }_{p}\ne {k}_{z}{\upsilon }_{0b}^{0},$ in this case let ${\omega }_{p}={k}_{z}{\upsilon }_{0b}^{0}+{\rm{\Omega }}$ and $\omega ={\omega }_{p}+\delta ={k}_{z}{\upsilon }_{0b}^{0}\,+\delta +{\rm{\Omega }},$ where ${\rm{\Omega }}$ is the finite mismatch frequency. Using these conditions in equation (8 ), we get
$\begin{eqnarray}\begin{array}{l}2\left({\omega }_{0}-{\omega }_{p}\right){\delta }^{3}\left(\displaystyle \frac{{\omega }_{pb}^{2}\left(1+{\rm{\Delta }}\left(1+\displaystyle \frac{{k}_{0z}}{{k}_{z}}\right)\right)}{{\gamma }_{0}^{03}}\displaystyle \frac{{\delta }^{2}}{{(\delta +{\rm{\Omega }})}^{2}}-\displaystyle \frac{2{\delta }^{3}}{{\omega }_{p}}\right)\\ =\displaystyle \frac{{k}_{z}^{2}| {\upsilon }_{0}{| }^{2}}{4}{\left(\displaystyle \frac{{\omega }_{pb}^{2}\left(1+{\rm{\Delta }}\left(1+\displaystyle \frac{{k}_{0z}}{{k}_{z}}\right)\right)}{{\gamma }_{0}^{03}}\displaystyle \frac{{\delta }^{2}}{{(\delta +{\rm{\Omega }})}^{2}}+{\delta }^{2}\right)}^{2}.\end{array}\end{eqnarray}$
Using the standard method used in Case-I to calculate the growth rate, we also obtain the growth rate for the finite mismatch frequency (${\rm{\Omega }}$). In the absence of pump $({{\boldsymbol{\upsilon }}}_{0}=0),$ using the expression of ${\delta }^{2}\,=\left({\omega }_{p}/(\delta +{\rm{\Omega }})\right)[{\omega }_{pb}^{2}\left(1+{\rm{\Delta }}(1+{k}_{0z}/{k}_{z})\right)/2{\gamma }_{0}^{3}]$ in equation (13 ), we obtain
$\begin{eqnarray}\begin{array}{l}{\delta }^{2}{\delta }^{* }+\displaystyle \frac{{k}_{z}^{2}| {\upsilon }_{0}{| }^{2}{\omega }_{p}}{16\left({\omega }_{0}-{\omega }_{p}\right)}\left(\delta +{\rm{\Omega }}\right)\\ -\displaystyle \frac{{\omega }_{pb}^{2}\left(1+{\rm{\Delta }}\left(1+{k}_{0z}/{k}_{z}\right)\right){\omega }_{p}}{2{\gamma }_{0}^{3}}=0.\end{array}\end{eqnarray}$
The solution of this equation gives the growth rate for a finite mismatch case as $\begin{eqnarray}{\delta }_{i}=(0.33{s}^{2}-0.756p-{{\rm{\Omega }}}^{2})/s.\end{eqnarray}$
If the mismatch frequency ${\rm{\Omega }}$ = 0 for ${\omega }_{p}={k}_{z}{\upsilon }_{0b}^{0},$ equation (15 ) gives the SRS growth rate for the perfect phase matching case. The growth rate of SRS is reduced significantly due to phase mismatch between the electron beam and the plasma wave. The deviation of the frequency resonance diverts the electron beam energy. Therefore, the beam coupling could be weak to excite the instability.
3. Growth rate analysis and numerical results
In the case when the low-frequency wave is the beam mode ($\omega ={k}_{z}{\upsilon }_{0b}^{0}$), ${\chi }_{b}\gt \,\gt {\chi }_{e}$ (beam-dominated decay), the nonlinear dispersion relation of the instability can be written as (from equation (8 ))
$\begin{eqnarray}{\varepsilon \varepsilon }_{1}=\frac{{k}_{z}^{2}{{\rm{|}}{{\boldsymbol{v}}}_{0}{\rm{|}}}^{2}}{4}{\left[\frac{{\omega }_{{pb}}^{2}}{{\gamma }_{0}^{3}{(\omega -{{k}_{z}\upsilon }_{0b}^{0})}^{2}}\left(1+{\rm{\Delta }}\left(1+\frac{{k}_{0z}}{{k}_{z}}\right)\right)\right]}^{2}.\end{eqnarray}$
We analyze this dispersion relation for two different cases as follows:a. Compton regime
In the case that beam density is small ${\chi }_{b}\lt \,\lt 1,$ equation (16 ) can be written as
$\begin{eqnarray}\begin{array}{l}{\left(\omega -{k}_{z}{\upsilon }_{0b}^{0}\right)}^{4}\left(1-\displaystyle \frac{{\omega }_{p}^{2}}{{\omega }_{1}^{2}}\right)\\ \unicode{x0007E}R\displaystyle \frac{{k}_{z}^{2\,}}{{k}^{2}}{\left[\displaystyle \frac{{\omega }_{pb}^{2}}{{\gamma }_{0}^{3}}\left(1+{\rm{\Delta }}\left(1+\displaystyle \frac{{k}_{0z}}{{k}_{z}}\right)\right)\right]}^{2},\end{array}\end{eqnarray}$
where $R=\frac{{k}_{z}^{2}{{\rm{|}}{{\boldsymbol{v}}}_{0}{\rm{|}}}^{2}}{4{{\unicode{9077}}}_{1}^{2}}.$The maximum growth rate of the instability occurs near the simultaneous zeros of the left-hand side. Choosing $\omega ={k}_{z}{\upsilon }_{0b}^{0}+\delta $ and ${\omega }_{1}={\omega }_{1r}+\delta ,$ where $\delta $ is the frequency mismatch, we solve the equation and get
$\delta ={\left[R{\omega }_{1r}\frac{{k}_{z}^{2\,}}{{k}^{2}}\frac{{\omega }_{{pb}}^{2}}{2{\gamma }_{0}^{3}}\left(1+\unicode{x02206}\left(1+\frac{{k}_{0z}}{{k}_{z}}\right)\right)\right]}^{1/3}{{\rm{e}}}^{{\rm{i}}2\pi l/3},$ where $l=0,1,2.$ The growth rate turns out to be
$\begin{eqnarray}G={\rm{Im}}(\delta )=\frac{\surd 3}{2}{\left[R{\omega }_{1r}\frac{{k}_{z}^{2\,}}{{k}^{2}}\frac{{\omega }_{{pb}}^{2}}{2{\gamma }_{0}^{3}}\left(1+\unicode{x02206}\left(1+\frac{{k}_{0z}}{{k}_{z}}\right)\right)\right]}^{1/3},\end{eqnarray}$
$\mathrm{where}\,{k}^{2}={k}_{0z}^{2}\frac{{\omega }_{0}^{2}}{{\omega }_{p}^{2}}+{\left({k}_{0z}+{k}_{z}\right)}^{2}\frac{{({\omega }_{0}+{{k}_{z}\upsilon }_{0b}^{0})}^{2}}{{\omega }_{p}^{2}}+{k}_{z}^{2}$ $\mathrm{for}\,{\omega }_{1}={\omega }_{0}\,-\,\omega ,{k}_{1}={k}_{0}\,-\,k.$Variation of the normalized growth rate ($G/{\omega }_{p}$) in the Compton regime with a normalized wave number of low-frequency wave (${k}_{z}/{k}_{0z}$) for different density modulation parameters is shown in figure 1. The other parameters are ${\omega }_{0}\approx 10{\omega }_{p},$ ${\omega }_{pb}=0.2{\omega }_{p},$ ${n}_{e}\approx {10}^{18}\,{{\rm{cm}}}^{-3},$ ${k}_{0z}c/{\omega }_{0}=3,$ ${\upsilon }_{0b}^{0}=0.1c$ and ${\upsilon }_{0}=0.2c.$ Our results show that the growth rate ($G/{\omega }_{p}$) of the SRS varies with the normalized wave number of the low-frequency wave (${k}_{z}/{k}_{0z}$) for different density modulation parameters ${\rm{\Delta }}=0$ (black curve), ${\rm{\Delta }}=0.5$ (red curve) and ${\rm{\Delta }}=1$ (blue curve). From our calculations, it is found that the growth rate of SRS increases with the wave number of the low-frequency wave. Furthermore, the growth rate also depends on the density modulation parameter. It increases with the density modulation parameter. The growth rate of Raman instability increases with the density modulation parameter ($\unicode{x02206}$). The particle velocity and the beam modulation should be chosen so that the beam electrons can amplify the density perturbation caused by the instability. The contribution of the electron beam is to amplify the low-frequency mode via resonant energy transfer to the electrons. The modulation parameter allows the plasma electrons to interact with the beam electrons efficiently due to the large scale perturbations associated with the density-modulated electron beam. Thus the growth of sideband is increased due to the feedback mechanism of the instability and consequently the growth rate of Raman instability.
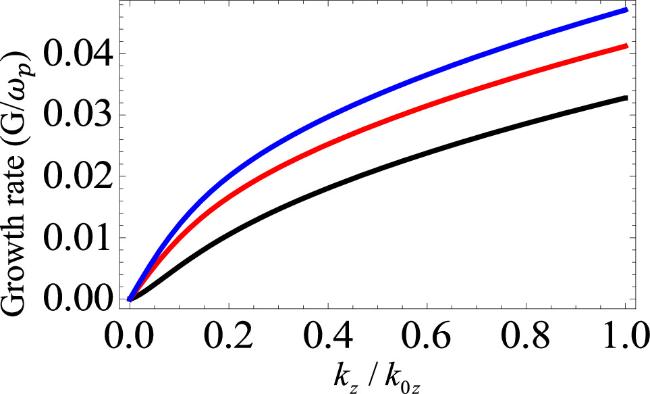
Figure 1. Normalized growth rate ($G/{\omega }_{p}$) of stimulated Raman scattering in the Compton regime as a function of the normalized wave number of low-frequency wave (${k}_{z}/{k}_{0z}$) for different density modulation parameters ${\rm{\Delta }}=0$(black curve), ${\rm{\Delta }}=0.5$ (red curve) and ${\rm{\Delta }}=1$ (blue curve). The other parameters are ${\omega }_{0}\approx 10{\omega }_{p},$ ${\omega }_{pb}=0.2{\omega }_{p},$ ${n}_{e}\approx {10}^{18}\,{{\rm{cm}}}^{-3},$ ${k}_{0z}c/{\omega }_{0}=3,$ ${\upsilon }_{0b}^{0}=0.1c$ and ${\upsilon }_{0}=0.2c$. |
From the expression of the growth rate of stimulated Raman scattering in the Compton regime, it is obvious that both the electron beam density and the density modulation parameter affect the instability growth. To estimate these effects, we have shown, in figure 2, the normalized growth rate ($G/{\omega }_{p}$) of stimulated Raman scattering in the Compton regime as a function of the density modulation parameter (${\rm{\Delta }}$) for different electron beam densities ${\omega }_{pb}=0.1{\omega }_{p}$ (black curve), ${\omega }_{pb}=0.2{\omega }_{p}$ (red curve) and ${\omega }_{pb}=0.3{\omega }_{p}$ (blue curve).
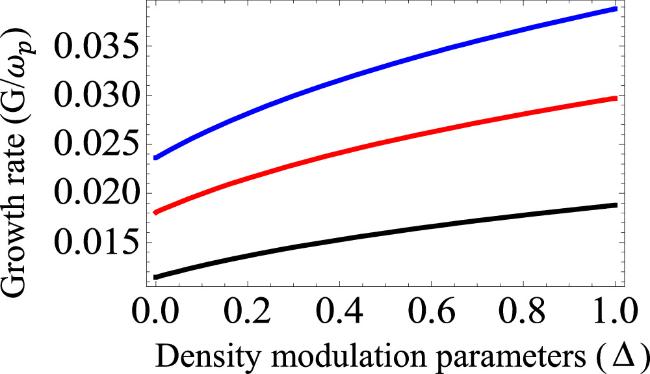
Figure 2. Normalized growth rate ($G/{\omega }_{p}$) of stimulated Raman scattering in the Compton regime as a function of the density modulation parameter (${\rm{\Delta }}$) for different electron beam densities ${\omega }_{pb}=0.1{\omega }_{p}$ (black curve), ${\omega }_{pb}=0.2{\omega }_{p}$ (red curve) and ${\omega }_{pb}=0.3{\omega }_{p}$ (blue curve). The other parameters are ${\omega }_{0}\approx 10{\omega }_{p},$ ${n}_{e}\approx {10}^{18}\,{{\rm{cm}}}^{-3},$ ${k}_{z}/{k}_{0z}=0.4,$ ${k}_{0z}c/{\omega }_{0}=3,$ ${\upsilon }_{0b}^{0}=0.1c$ and ${\upsilon }_{0}=0.2c$. |
This calculation shows that the growth rate of the instability also depends on the density of the electron beam. The growth rate increases with the density of the electron beam. As the electron beam density increases, the resonance condition for efficient energy transfer may be dominant. For higher beam density, the way of excitation of the low-frequency oscillations, based on the nonlinear transformation of the energy of the high-frequency waves into low frequency, can be more effective. The modulation in the density of the electron beam at a high density leads to a change in increment of the growth of the high-frequency oscillations with the period of these fluctuations. If the group velocity of the high-frequency wave is equal to the phase velocity of the low-frequency beam mode oscillations, then these waves turn out to be resonantly coupled, as a result of which there is amplification of low-frequency oscillations at the expense of the energy of the high-frequency waves. Hence, the growth rate of instability is increased significantly in the case of density-modulated electron beam propagation in plasmas.
As the density modulation parameter approaches to unity, the energy required for instability increases. Hence, the growth rate of the instability reaches a maximum level for ${\rm{\Delta }}=1.$ The deviation of the density modulation parameter from unity reduces the instability growth due to the phase mismatch between the electron beam and the plasma wave. The damping of the plasma wave for a small modulation parameter occurs because of the thermal absorption by the electrons in the beam.
Similarly, figure 3 shows the variation of the growth rate ($G/{\omega }_{p}$) with respect to the oscillatory velocity (${\upsilon }_{0}/c$) of the plasma electrons in the Compton regime. The growth rate of SRS depends on the electron oscillatory velocity (${\upsilon }_{0}/c$). The growth rate increases with the electron oscillatory velocity (${\upsilon }_{0}/c$). The growth rate of SRS could be enhanced more effectively with the large density modulation parameter at a particular oscillatory velocity. Thus the pump strength is crucial in the determination of the growth rate of the Raman instability.
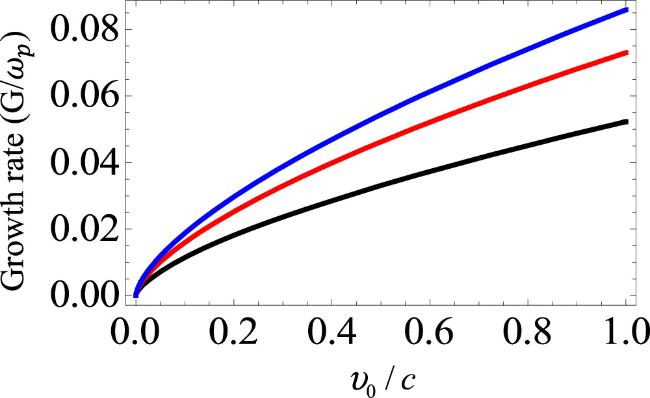
Figure 3. Normalized growth rate ($G/{\omega }_{p}$) of stimulated Raman scattering in the Compton regime as a function of the normalized oscillatory velocity (${\upsilon }_{0}/c$) for different density modulation parameter ${\rm{\Delta }}=0$ (black curve), ${\rm{\Delta }}=0.5$ (red curve) and ${\rm{\Delta }}=1$ (blue curve). The other parameters are ${\omega }_{0}\approx 10{\omega }_{p},$ ${\omega }_{pb}=0.2{\omega }_{p},$ ${n}_{e}\approx {10}^{18}\,{{\rm{cm}}}^{-3},$ ${k}_{0z}c/{\omega }_{0}=3,$ ${\upsilon }_{0b}^{0}=0.1c$ and ${k}_{z}/{k}_{0z}=0.4$. |
b. Raman regime
At a high beam density, one may have $\varepsilon =0,$ in this case, self-consistent potential far exceeds the ponderomotive one ($\phi \gt \,\gt {\phi }_{pb}$). Then the solution to the equation around the simultaneous zeros on the left-hand side of the equation takes form
$\begin{eqnarray}\begin{array}{l}\left[1-\displaystyle \frac{{\omega }_{p}^{2}}{{\omega }^{2}}\displaystyle \frac{{k}_{z}^{2}}{{k}^{2}}-\displaystyle \frac{{\omega }_{pb}^{2}}{{\gamma }_{0}^{3}{\left(\omega -{k}_{z}{\upsilon }_{0b}^{0}\right)}^{2}}\displaystyle \frac{{k}_{z}^{2}}{{k}^{2}}\left(1+{\rm{\Delta }}\left(1+\displaystyle \frac{{k}_{0z}}{{k}_{z}}\right)\right)\right]\\ \,\times \left[1-\displaystyle \frac{{\omega }_{p}^{2}}{{\omega }_{1}^{2}}-\displaystyle \frac{{k}_{1}^{2}{c}^{2}}{{\omega }_{1}^{2}}\right]=R.\end{array}\end{eqnarray}$
The maximum growth rate of the instability occurs near the simultaneous zeros of the left-hand side. Choosing $\omega ={\omega }_{r}+\delta $ and ${\omega }_{1}={\omega }_{1r}+\delta ,$where,19 ), the growth rate turns out to be
$\begin{eqnarray*}\begin{array}{ccc}{\omega }_{r} & = & {{k}_{z}\upsilon }_{0b}^{0}+{\left[\frac{({{\omega }_{p}^{2}-\omega }_{{pb}}^{2})}{{\gamma }_{0}^{3}\left(1-\left({\omega }_{p}^{2}{k}_{z}^{2}/{\omega }^{2}{k}_{1}^{2}\right)\right)}\frac{{k}_{z}^{2}}{{k}^{2}}\left(1+\unicode{x02206}\left(1+\frac{{k}_{0z}}{{k}_{z}}\right)\right)\right]}^{1/2},\\ {\omega }_{1r} & = & {\left[{k}_{1}^{2}{c}_{1}^{2}+{\omega }_{p}^{2}\right]}^{1/2},\end{array}\end{eqnarray*}$
and $\delta $ is the frequency mismatch. By solving equation ( $\begin{eqnarray}\begin{array}{ccc}G & = & {\rm{Im}}(\delta )=\left[\frac{R{\omega }_{1r}({{\omega }_{p}^{2}-\omega }_{{pb}}^{2})}{{16{\omega }_{r}\gamma }_{0}^{3}\left(1-\left({\omega }_{p}^{2}{k}_{z}^{2}/{\omega }^{2}{k}_{1}^{2}\right)\right)}\right.\\ & & \times {\left.\frac{{k}_{z}^{2}}{{k}^{2}}\left(1+\unicode{x02206}\left(1+\frac{{k}_{0z}}{{k}_{z}}\right)\right)\right]}^{1/2},\end{array}\end{eqnarray}$
where ${k}^{2}={k}_{0z}^{2}\frac{{\omega }_{0}^{2}}{{\omega }_{p}^{2}}$ + ${({k}_{0z}+{k}_{z})}^{2}{\left(\frac{{k}_{z}{\upsilon }_{0b}^{0}}{{\omega }_{p}}-\frac{{\omega }_{{pb}}^{2}\left(1+{\rm{\Delta }}(1+\frac{{k}_{0z}}{{k}_{z}})\right)/{\omega }_{p}^{2}}{{\gamma }_{0}^{3}{(1-{\omega }_{p}^{2}/{\omega }^{2})}^{1/2}}\frac{{k}_{z}^{2}}{{k}^{2}}\right)}^{1/2}$ + ${k}_{z}^{2}$ (which is the phase matching condition in the Raman regime).In the Raman regime, the electron beam effects are dominants, thus the growth rate of the Raman instability is higher than the previous case. The reason behind this is the dominant effect of the electron beam to excite the low-frequency mode. The estimation of the enhancement of the growth rate of SRS in the Raman regime is plotted in figure 4 for different electron beam densities ${\omega }_{pb}=0.4{\omega }_{p}$ (black curve), ${\omega }_{pb}=0.5{\omega }_{p}$ (red curve) and ${\omega }_{pb}=0.6{\omega }_{p}$ (blue curve). From the expression of the growth rate of stimulated Raman scattering in the Raman regime, it is obvious that the beam density and the density modulation parameter both affect the instability growth. To estimate this effect, in figure 4, we have shown the normalized growth rate ($G/{\omega }_{p}$) of stimulated Raman scattering in the Raman regime as a function of the density modulation parameter (${\rm{\Delta }}$) for different electron beam density ${\omega }_{pb}=0.4{\omega }_{p}$ (black curve), ${\omega }_{pb}=0.5{\omega }_{p}$ (red curve) and ${\omega }_{pb}=0.6{\omega }_{p}$ (blue curve). The other parameters are ${\omega }_{0}\approx 10{\omega }_{p},$ ${n}_{e}\approx {10}^{18}\,{{\rm{cm}}}^{-3},$ ${k}_{z}/{k}_{0z}\,=0.4,$ ${k}_{0z}c/{\omega }_{0}=3,$ ${\upsilon }_{0b}^{0}=0.1c$ and ${\upsilon }_{0}=0.2c.$ The growth rate of instability increases with the density modulation parameter and attains a maximum value at ${\rm{\Delta }}=1.$ The calculation shows that the growth rate increases with the density of the electron beam.
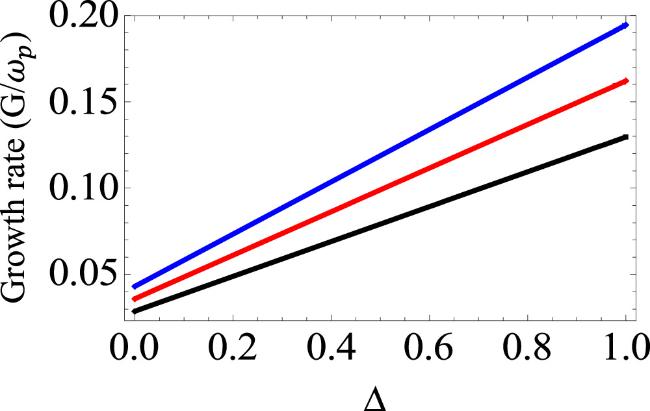
Figure 4. Normalized growth rate ($G/{\omega }_{p}$) of stimulated Raman scattering in the Raman regime as a function of the density modulation parameter (${\rm{\Delta }}$) for different electron beam density ${\omega }_{pb}=0.4{\omega }_{p}$ (black curve), ${\omega }_{pb}=0.5{\omega }_{p}$ (red curve) and ${\omega }_{pb}=0.6{\omega }_{p}$ (blue curve). The other parameters are ${\omega }_{0}\approx 10{\omega }_{p},$ ${n}_{e}\approx {10}^{18}\,{{\rm{cm}}}^{-3},$ ${k}_{z}/{k}_{0z}=0.4,$ ${k}_{0z}c/{\omega }_{0}=3,$ ${\upsilon }_{0b}^{0}=0.1c$ and ${\upsilon }_{0}=0.2c$. |
Variation of the normalized growth rate ($G/{\omega }_{p}$) with normalized wave number of the low-frequency wave (${k}_{z}/{k}_{0z}$) for different density modulation parameters in the Raman regime is shown in figure 5. Our results show that the growth rate ($G/{\omega }_{p}$) of the SRS varies with the normalized wave number of the low-frequency wave (${k}_{z}/{k}_{0z}$) for different density modulation parameters ${\rm{\Delta }}=0$ (black curve), ${\rm{\Delta }}=0.5$ (red curve) and ${\rm{\Delta }}=1$ (blue curve). The growth rate of instability is increased for larger modulation parameters as discussed for the case of the Compton regime.
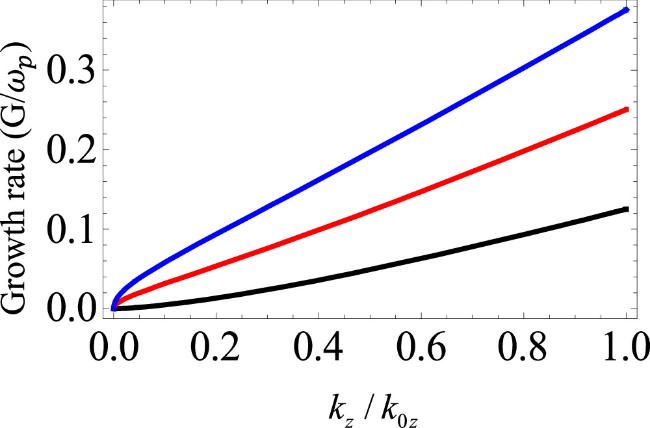
Figure 5. Normalized growth rate ($G/{\omega }_{p}$) of stimulated Raman scattering in the Raman regime as a function of the normalized wave number of the low-frequency wave (${k}_{z}/{k}_{0z}$) for different density modulation parameters ${\rm{\Delta }}=0$ (black curve), ${\rm{\Delta }}=0.5$ (red curve) and ${\rm{\Delta }}=1$ (blue curve). The other parameters are ${\omega }_{0}\approx 10{\omega }_{p},$ ${\omega }_{pb}=0.5{\omega }_{p},$ ${n}_{e}\approx {10}^{18}\,{{\rm{cm}}}^{-3},$ ${k}_{0z}c/{\omega }_{0}=3,$ ${\upsilon }_{0b}^{0}=0.1c$ and ${\upsilon }_{0}=0.2c$. |
Finally, figure 6 shows the variation of growth rate ($G/{\omega }_{p}$) with respect to the oscillatory velocity (${\upsilon }_{0}/c$) in the Raman regime. The growth rate of SRS varies with the oscillatory velocity (${\upsilon }_{0}/c$). The growth rate increases with the oscillatory velocity (${\upsilon }_{0}/c$). However, the beam mode is dominant in this regime but still the plasma electron velocity imparted by the pump plays a crucial role in determining the growth rate of the instability. That means that the plasma effects are still operative in the beam-dominant regime.

Figure 6. Normalized growth rate ($G/{\omega }_{p}$) of stimulated Raman scattering in the Raman regime as a function of the normalized oscillatory velocity (${\upsilon }_{0}/c$) for different density modulation parameters ${\rm{\Delta }}=0$ (black curve), ${\rm{\Delta }}=0.5$ (red curve) and ${\rm{\Delta }}=1$ (blue curve). |
4. Conclusion
We have shown that the density-modulated electron beam can have significant effects on the growth of SRS. The mechanism of SRS growth is based on the nonlinear interaction of the beam mode with the high-frequency waves. The revised growth rate of SRS is calculated for the case of density-modulated electron beams. The role of the density modulation parameter is analyzed. From the expression of the growth rate of stimulated Raman scattering in the Compton and Raman regime, it was found that the beam density and the density modulation parameter both affect the Raman instability growth. The growth rate of instability increases with the density modulation parameter and attains a maximum value at the density modulation parameter ${\rm{\Delta }}=1.$ The growth rate of instability was found to be enhanced significantly with the density-modulated electron beam propagation in plasmas. The growth rate also increases with the density of the electron beam, as well as with the electron oscillatory velocity (or pump energy). If we take different density modulation parameters, the growth rate of SRS could be enhanced more effectively for a particular electron beam density corresponding to the appropriate pump intensity. The growth rate of SRS may be reduced if the electron beam will have negative energy or the propagation of the electron beam is opposite the pump wave. In that case, the plasma wave may be damped due to the negative electron density perturbation associated with the beam.