


1. Introduction
Active matter refers to non-equilibrium systems composed of self-driven individuals that consume energy from their local environment to perform mechanical motion. The collective motion of these active individuals is prevalent both in vitro and in vivo, as seen in examples such as bacterial suspensions [1–4], microtubules [5–8], and actin filaments [9, 10]. Recent research has explored the collective dynamics of active systems through theoretical analysis, experiments, and simulations [5–8, 11–15]. Additionally, there has been a growing focus on controlling collective motions. Developing methods to manipulate active matter systems has far-reaching implications in biomedicine and other areas, including material design [12, 16] and the study of intracellular dynamics [7, 17, 18].
Many efforts have been dedicated to controlling active systems, employing methods such as electromagnetic fields [19], light sources [20], and, most commonly, geometric confinements [8, 21–35]. Interactions between active particles and boundary walls, coupled with the flow generated by active forces, enable geometric confinements to regulate the collective motions of the active systems. These confinements include circular domains [21–25], channels [26–29], and even more intricate 3D confinements [8, 30–32], or combinations of shapes [33, 34].
In addition to external factors, the inherent properties of active entities also play a crucial role in the structural formation and collective motion of the entire system. Among them, the self-driven speed of active individuals is a primary factor. In nature, active matters exhibit varying self-propelled speeds due to different intrinsic properties. In experiments, self-driven speeds can be changed through various artificial means, such as exposing active particles to a designed light field [36] or adjusting the local concentration of polymers in the surrounding environment [37]. In previous studies, the self-driven speed was often fixed in simulations of active systems [38, 39] or cannot be directly represented in the model [23, 29]. However, there are reports indicating that an increase in self-driven speed intensifies the interaction between the boundary and the nearby active particles [40]. This leads to changes in particle orientations and the generation of boundary currents, raising questions about how increasing self-driven speed will impact the collective motion of all particles in the confined system.
Circular rotation is a distinctive and representative collective movement observed in previous studies [7, 23, 25, 41, 42], particularly in confined active systems of various length scales. The structural evolution of circular rotation exhibits pronounced responses to changes in the self-driven speed of particles. Although it is difficult to quantitatively measure the self-driven speed of particles in experiments, observing changes in circular rotations can effectively reflect variations in the self-driven speed of active particles. This approach is highly suitable for quantitatively analyzing the impact of self-driven speed on the collective motion of confined active systems.
In this work, we aim to explore the influence of self-driven speed on collective motions of 2D circular confined active particles. We employ a highly-tunable model to demonstrate how confinements can cause active nematic systems with particles of various self-driven speeds to behave differently. By adjusting the size of the confinement and the alignment strength coefficient between particles, distinct collective motions emerge. Transitions between different system structures exhibit a significant response to changes in self-driven speed when the system is confined, a phenomenon that is not evident under periodic conditions. We find that the circular rotation state forms over a larger range of parameters as the self-driven speed of active particles increases. Additionally, we analyze the motion of the obtained flow field and the behavior of defects in the active particle field. Notably, larger self-driven speeds contribute to the formation of a more stable vortex in the circular rotation state.
2. Model
We study active systems confined to a thick plane, and therefore the model and simulation are configured in a two-dimensional domain. The model incorporates highly adjustable parameters that makes it easy to simulate various types of active systems.
In active systems, particles interact with the surrounding flow field. They generate force dipoles and induce flow fields, and the resulting flow fields reciprocally influences their orientations and movements. In this study, we employ pusher swimmers as active individuals, recognized for producing extensile force dipoles [43, 44]. Typically, we consider bacteria such as Bacillus subtilis as representative pusher particles. For an active nematic system which contains N self-driven pusher particles, we consider the following model [38, 45, 46]. Particles navigate in an incompressible fluid flow field ${\boldsymbol{V}}\left({{\boldsymbol{r}}}_{i}\right)$, described by the particle’s position ${{\boldsymbol{r}}}_{i}\left(t\right)$ and orientation ${{\boldsymbol{u}}}_{i}\left(t\right)=(\cos {\theta }_{i}(t),\sin {\theta }_{i}(t))$. The motion of particle i ∈ [1, N] is described as equations (1 )–(2 ):1 ), v0 denotes the self-driven speed of active individuals, and ${{\boldsymbol{R}}}_{i,j}=(1-\left|{{\boldsymbol{r}}}_{i}-{{\boldsymbol{r}}}_{j}\right|)\tfrac{{{\boldsymbol{r}}}_{i}-{{\boldsymbol{r}}}_{j}}{\left|{{\boldsymbol{r}}}_{i}-{{\boldsymbol{r}}}_{j}\right|}$ represents the soft repulsion force between particle neighbors within the interaction range, with the force magnitude Cr. In equation (2 ), the first term denotes the strength of interparticle nematic alignment, modulated by the tunable coefficient C. The subsequent two terms originate from Jeffery’s work [47], elucidating the motion of a rigid ellipsoidal body surrounded by an incompressible fluid field. Here, ∇ × V denotes the local vorticity, E = (∇V + ∇VT)/2 represents the local strain of the fluid velocity field, and the coefficients CV and CS are influenced by the particle’s shape. The last term is the noise term, which is a unit-variance angular Gaussian noise ξθ regulated by the noise strength Cn. To describe the fluid flow field ${\boldsymbol{V}}\left({\boldsymbol{r}},t\right)$, we solve the following Navier–Stokes equation:5 ):
$\begin{eqnarray}{\dot{{\boldsymbol{r}}}}_{i}={\boldsymbol{V}}\left({{\boldsymbol{r}}}_{i}\right)+{{\boldsymbol{v}}}_{0}\left({\theta }_{i}\right)+{C}_{r}\displaystyle \sum _{i,j}{{\boldsymbol{R}}}_{i,j},\end{eqnarray}$
$\begin{eqnarray}\begin{array}{rcl}{\dot{\theta }}_{i} & = & C\displaystyle \sum _{i,j}\sin \left[2\left({\theta }_{j}-{\theta }_{i}\right)\right]+{C}_{V}\left({\rm{\nabla }}\times {\boldsymbol{V}}\left({{\boldsymbol{r}}}_{i}\right)\right)\cdot \hat{{\boldsymbol{z}}}\\ & & +{C}_{S}{\hat{{\boldsymbol{u}}}}_{i}\times \left({\boldsymbol{E}}\cdot {\hat{{\boldsymbol{u}}}}_{i}\right)\cdot \hat{{\boldsymbol{z}}}+{C}_{n}{\xi }_{\theta }.\end{array}\end{eqnarray}$
In equation ( $\begin{eqnarray}\begin{array}{l}\mu {{\rm{\nabla }}}^{2}{\boldsymbol{V}}({\boldsymbol{r}},t)+{\rm{\nabla }}p-\alpha ({\boldsymbol{r}}){\boldsymbol{V}}({\boldsymbol{r}},t)+{\boldsymbol{F}}={\partial }_{t}{\boldsymbol{V}}({\boldsymbol{r}},t),\\ {\rm{\nabla }}\cdot {\boldsymbol{V}}({\boldsymbol{r}},t)=0,\end{array}\end{eqnarray}$
μ signifies the fluid viscosity, p represents the pressure and α(r) characterizes the friction with substrates. α(r) is a position-dependent function that shows variation between the interior and exterior of the confinement: $\begin{eqnarray}\alpha ({\boldsymbol{r}})=\left\{\begin{array}{ll}{\alpha }_{{\rm{in}}},\qquad & {\rm{if}}\quad {\boldsymbol{r}}\in {\rm{confined}}\,{\rm{region}}\\ {\alpha }_{{\rm{out}}},\qquad & {\rm{if}}\quad {\boldsymbol{r}}\notin {\rm{confined}}\,{\rm{region}}\end{array}\right.\end{eqnarray}$
F indicates the active force field exerted by the force dipole generated by the pusher swimmer, as described in equation ( $\begin{eqnarray}{\boldsymbol{F}}={f}_{0}{\rm{\nabla }}\cdot \hat{{\boldsymbol{u}}}\hat{{\boldsymbol{u}}}.\end{eqnarray}$
The coefficient f0 determines the strength of the force dipole, and $\hat{{\boldsymbol{u}}}$ is the local coarse-grained particle orientation.We employ the evolutionary mechanisms delineated in equations (1 )–(5 ) to simulate our active system. Parameters with minimal impact on the results are kept constant during the simulation. Specifically, we set the values of CV and CS at 0.5 and 1.0 for particles respectively, considering them as slender rods. The particle density $\rho$, which means the number of particles in each 1 × 1 grid, is set to 2.5 to strike a balance between facilitating particle movement and ensuring that particles can spread throughout the entire enclosed space [45, 48].
We establish boundaries for active systems primarily through the modulation of effective friction α(r). Within the confinement, a low-friction region is configured with viscosity μ and friction α(r) set to 400 and 0.5 respectively. This ensures that the hydrodynamic screening length, which is proportional to $\sqrt{\mu /\alpha \left({\boldsymbol{r}}\right)}$ [49], is comparable to the confinement size to facilitate the formation of vortices. Conversely, a high-friction region is defined outside the confinement, with α(r) set to 200 to shield the flow field. In addition, when the particle is about to cross the boundary line, it will exert a force directed towards the center of the confinement. These parameters remain constant throughout the simulation because they have little effect on changes in the overall structure of the system. Besides, there are other adjustable parameters in equations (1 )–(5 ). Active particles and fluid fields are intricately linked, evolving into specific structures under various parameters. This allows us to investigate how changes in the environment or the specific particle properties impact the structure of active systems.
To reflect the characteristics of different structures, we need to identify +1/2 defects within each structure. In order to detect the locations of +1/2 defects more precisely, we first use the interpolation method [50] to divide each grid of the simulation region into 8 × 8 subgrids. We calculate the angular change of the particles around each grid in a clockwise direction. We determine that there is a +1/2 defect at the grid point if the result is π.
3. Results
3.1. Three typical states of circular confined active nematic systems
In this section, we present simulation results of systems featuring active pusher swimmers surrounded by a flow field and confined to a circular area with the radius of r = 12. The particles themselves move at a self-driven speed of v0. The active particles exert a force on the flow field. At the same time, the flow field excited by the active force propels the particles in the active system. We achieve diverse structural configurations after changing the alignment strength coefficient C of particles, as illustrated in figure 1. The resulting structures can be broadly categorized into three typical states. To clearly delineate these states, the particle fields and flow field are depicted in figures 1(a)–(c) and (d)–(f), respectively.
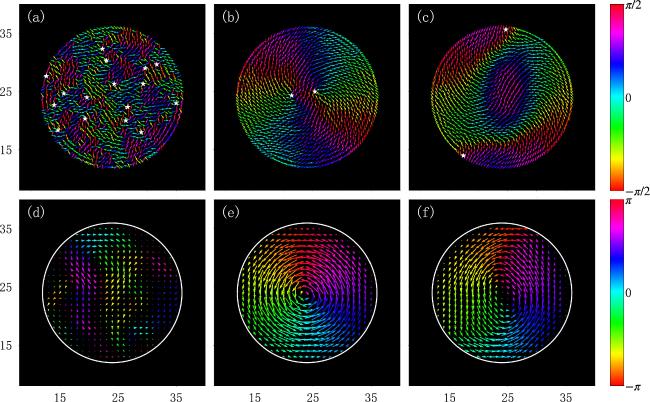
Figure 1. Schematic diagram of three typical states formed in circular confined active nematic systems. (a)–(c) correspond to particle fields of three systems of v0 = 0.01 and r = 12, with C = 0.0005, 0.004 and 0.008 respectively. The simulation domain is 48 × 48. The color of the arrows represents the orientation of the particles. +1/2 defects are marked with white stars. The boundary of each system is marked with solid white lines. (d)–(f) show the corresponding flow fields of (a)–(c). The length of the arrows represents the magnitude of local flow velocity. |
Within these structures, a significant collective motion: a circular rotation state, emerges at appropriate alignment strength coefficients. The particles in the particle field exhibit strong motility. A pair of symmetric +1/2 defects forms at the center of the particle field. These defects induce a substantial flow field, resulting in the formation of a vortex spanning the entire confined region. As shown in figures 1(b) and (e), both the particle field and the flow field exhibit global circulation. The +1/2 defects rotate counterclockwise close to the center of the confinement. In contrast, when the alignment strength coefficient is small, as depicted in figures 1(a) and (d), the orientations of particles become random. This structure exhibits a relatively high number of +1/2 defects, and the flow field displays localized turbulence. We call this a disordered state. When the alignment strength between the particles reaches a sufficiently high value, as illustrated in figures 1(c) and (f), the strong alignment strength causes internal particles to orient almost identically, thus eliminating defects in the interior. Consequently, defects here are compressed to the boundary layer of the confined region. In this case, the movement of the particles is greatly diminished, the global motion is suppressed, and only the local motion remains. Meanwhile, the flow field is also weakened but can still sustain a weak global rotation. This structure is named as a stationary state. In this case, the movement of the particles is very slight.
The prominent feature of these three typical structures is characterized by the number and distribution of +1/2 defects in particle fields. The difference in the number of +1/2 defects among the three states is already shown in figures 1(a)–(c). Figure 2(a) depicts their distribution. In the circular rotation state, the distribution of +1/2 defects is primarily concentrated near the center of confinement. Meanwhile, the particle field of the disordered state has a large number of defects uniformly distributed, and the stationary state has +1/2 defects near the boundary. Consequently, each structure corresponds to a distinct number and distribution of +1/2 defects, allowing us to primarily evaluate the state of the active nematic system by observing defect properties.
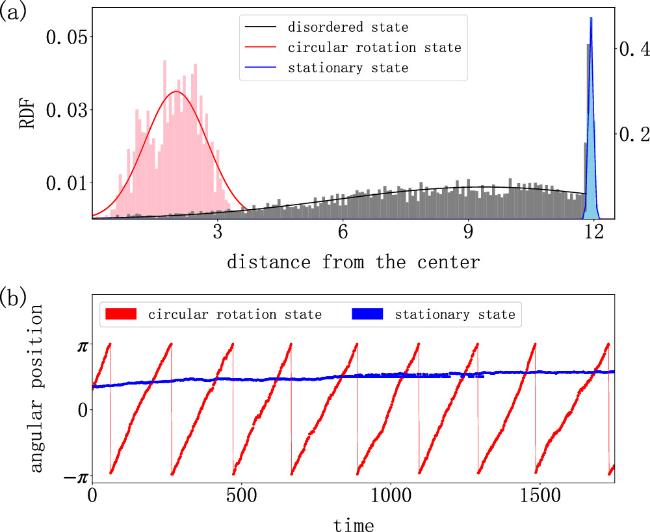
Figure 2. (a) Radial distribution function (RDF) of +1/2 defects in disordered state (black line), circular rotation state (red line) and stationary state (blue line). (b) Angular position of +1/2 defects. The vertical axis represents the angle between the line which connects the defect position and the center of the confinement with the horizontal line. The red and blue lines represent the angular positions of a single defect in circular rotation state and stationary state respectively. |
In active nematic systems, topological defects play a crucial role in the configuration of the entire active system, due to the mutual interactions of the particle and flow fields. Defects in the particle field initiate and regulate the active flow, especially +1/2 defects. Due to the morphology of the +1/2 defect made up with active particles, it has the maximum spatial gradient of the order parameter of particle orientation around +1/2 defects [51]. Referring to equations (3 ) and (5 ), we can find that this is the main source of the driving force F of the flow field, which is therefore particularly emphasized near +1/2 defects. The resulting flow field then rotates and propels active individuals. In disordered states, the presence of a large number of defects keeps the flow field in a turbulent state, which is very close to the state of unconfined active systems. In circular rotation states, the number of +1/2 defects decreases to 2. These two +1/2 defects are close to and symmetric with respect to the center of the confinement. Notably, +1/2 defects inherently possess self-driven capabilities within wet active nematic systems [11, 45, 52], and move in the direction of its ‘head’ along the symmetry axis [53]. In addition to self-propulsion, particles in defects are also driven by the flow field. They exert driving force to excite the active flow and form the vortex in the flow field, which causes defects to move rotationally in fixed orbits and keep generating currents within the confinements. In stationary states, due to the strong alignment strength coefficient between particles, orientations of particles away from the confinement edge are mainly determined by inter-particle interactions and are relatively neatly arranged. When C is strong enough, this region extends to all particles in the system. +1/2 defects will only appear at the boundary in the particle field of the stationary state. The outward self-driven force of +1/2 defects is balanced by the repulsive force which comes from the confined boundary, causing them to be stuck and almost remain stationary. The flow field excited by the defects at the boundary is mostly consumed by the friction present outside the confinement, which is very high. Figure 2(b) illustrates the change in the angular position of the +1/2 defect over time for both the circular rotation and stationary states. In the circular rotation state, the +1/2 defect rotates at a constant, relatively high angular velocity. In contrast, the +1/2 defect in the stationary state remains nearly stationary, indicating a lack of motility of the particles. Whether the particles exhibit strong motility is another important difference between the two states. Additionally, a relatively small flow field is excited by the highly-ordered and nearly stationary particles compared to the flow field of the circular rotation state. Keeping the activity intensity of the particles unchanged during the simulation, the number and distribution of +1/2 defects play a pivotal role in the formation of entire system structures. It is worth mentioning that, with the other parameters held constant, C and r mainly determine the number of +1/2 defects in the particle field. Therefore, key variables of interest include the alignment strength coefficient C and the size of the confinement r.
3.2. The driven force of the circular rotation
As previously discussed, the primary force driving the flow field originates from the spatial gradient of particle orientations, influenced by the interactions between the boundary wall and the particles. Figure 3(a) shows the spatial map of the tangential driving force ${F}_{P}={\hat{{\boldsymbol{e}}}}_{\theta }\cdot {\rm{\nabla }}\cdot {\boldsymbol{Q}}$ of active systems with v0 = 0.01. Here, ${\hat{{\boldsymbol{e}}}}_{\theta }$ represents the tangential unit vector and Q represents the nematic order parameter tensor and is defined by ${\boldsymbol{Q}}=\hat{{\boldsymbol{u}}}\hat{{\boldsymbol{u}}}$. FP generates radial flow and forms a vortex within the confined region. Active particles maintain a constant angle with the tangent line of the boundary wall as they enter the boundary layer [54, 55]. This behavior results in a spatial gradient in a particle orientation, extending from the boundary to the center, as shown in figure 3(a). Additionally, we observe a radial migration of particles toward the confinement boundary, leading to a density gradient of particles with a large v0. This dual spatial gradient, encompassing both particle density and orientation, gives rise to the driving force FP distributed throughout the entire confinement area, as illustrated in figure 3(a).
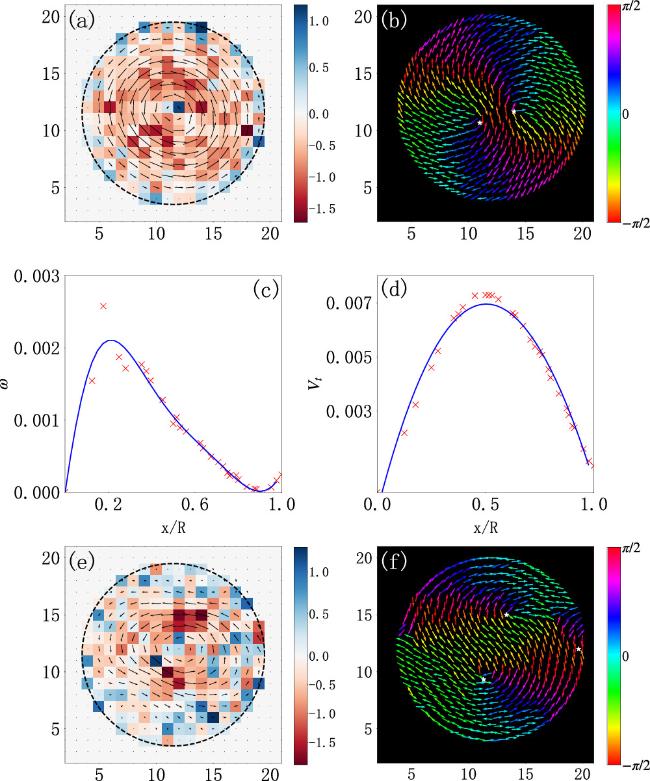
Figure 3. Spatial map of ${F}_{P}={\hat{{\boldsymbol{e}}}}_{\theta }\cdot {\rm{\nabla }}\cdot {\boldsymbol{Q}}$. (a) and (e) show the spatial map of FP. Positive values indicate the clockwise direction, with the shade of color representing the force magnitude and black arrows indicating the flow field. v0 = 0.01, r = 8, C = 0.004 in (a) and v0 = 0, r = 8, C = 0.004 in (e). The defect positions are marked with white stars in the corresponding particle fields of (b) and (f). (c) and (d) are the mean angular velocity of the particles rotating around the circle’s center and the radial distribution of the mean tangential velocity of the fluid field. |
Moreover, the spatial gradient of particle orientations is particularly intense around +1/2 defects, making them crucial in forming and sustaining system structures. Combining figures 3(a) and (b), it is evident that the strongest driving force is in the vicinity of the +1/2 defects. Additionally, figure 3(c) provides the radial distribution of particle angular velocity, indicating that it reaches its maximum around the +1/2 defects due to active backflow which comes from particles’ self-propulsion [53]. This highlights the pivotal role of +1/2 defects in the formation of circular rotation states and establishes defect number as an effective criterion for distinguishing different structural characteristics. Figure 3(d) shows the tangential velocity of the flow field and we can find that under the combined effect of defects and dual spatial gradient, a flow field with a high flow velocity is formed. In this case, the particles interact with the flow field and form a circular rotation state.
3.3. The influence of self-driven speed on structural transition and stability
To illustrate the impact of changes in self-driven speed, we present simulation results of systems under confined conditions composed of active nematic particles with different v0. We demonstrate the evolution of the system from the disordered state to the circular rotation with an increase in v0 in figure 4 for three different active systems. Figure 4(a) shows that, an increase in v0 leads to the transition from the disordered state to the circular rotation state. In order to better reflect the flow field within the circular confinement, we introduce a structural parameter ${F}_{v}=\tfrac{1}{N}\left|{\sum }_{i}\tfrac{{{\boldsymbol{V}}}_{i}\cdot {{\boldsymbol{n}}}_{t}}{\left|{{\boldsymbol{V}}}_{i}\right|}\right|$. Here, Vi denotes the local fluid velocity of each simulation lattice within the confinement, N is the total lattice number, and nt is the unit tangent vector. Fv characterizes the structural transition from the perspective of the flow field. When it equals 1, the system is in the vortex state. When it equals 0, the system is in the completely disordered state. Figure 4(b) illustrates how Fv varies with v0 in three active systems with different C and r. It is evident that an increase in v0 promotes the formation of circular rotational states in active nematic systems with geometric confinements. In systems with large C and small r, increasing v0 has a more pronounced impact.
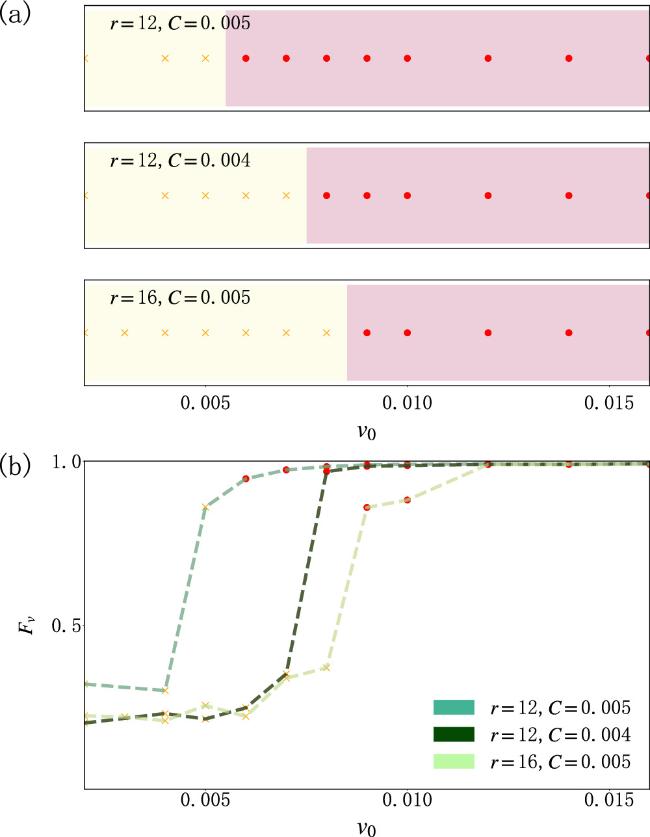
Figure 4. The response of active systems to the increasing particle self-driven speed. (a) Active systems change from the disordered state to the circular rotation state as the particle self-driven speed increases. Yellow areas indicate that no vortex structure has been formed, and red areas represent circular rotation states, with (r, C) from top to bottom: r = 12, C = 0.005; r = 12, C = 0.004; r = 16, C = 0.005. (b) Fv of the three systems in (a) with v0 ranging from 0.002 to 0.016. |
Furthermore, we find that the magnitude of v0 also affects the stability of the circular rotational state. Taking a low self-driven speed ($\left|{{\boldsymbol{v}}}_{0}\right|=0$) and a high self-driven speed ($\left|{{\boldsymbol{v}}}_{0}\right|={v}_{0}$) for example, figure 5 demonstrates the evolution of particle and flow fields of these two active systems. The evolution of number of +1/2 defects in particle fields is shown in figures 5(a) and (b). There is a violent fluctuation around 2 for the defect number in the system containing particles of v0 = 0. It illustrates the formation of a circular rotation state, but with the creation and annihilation of defects at confinement boundaries, this structure is not very stable. In contrast, with a larger v0, the defect number remains stable at 2 with much smaller fluctuation, indicating the formation of a circular rotation state that can be steadily maintained. The flow field exhibits more significant instability than the particle field in figure 5(c). The grey line in figure 5(c) represents Fv of the circular rotation state with v0 = 0, which experiences drastic fluctuations. When compared to those formed in the system with v0 = 0.01, the degree of fluctuation of Fv is associated with the stability of the circular rotation state. The more stable the state, the smaller the fluctuations of Fv.

Figure 5. Evolution of +1/2 defects in both particle and flow fields as a function of time. (a) The evolution of the number of +1/2 defects corresponds to the system of v0 = 0. (b) The evolution of the number of +1/2 defects corresponds to the system of v0 = 0.01. (c) Vortex order parameter Fv of specific examples of circular rotation states as a function of time with different v0 (the blue line and grey line depict v0 = 0.01, C = 0.004, r = 8 and v0 = 0, C = 0.004, r = 8 respectively). |
The reason for such changes as for the structural transition and stability can be seen in figures 3(e) and (f). In contrast to v0 = 0.01 systems, particles lacking self-propulsion or with low self-driven speeds typically align in parallel to the tangent line of the boundary wall, as shown in figure 3(f). In addition, the density distribution of active particles without self-propulsion is uniform, which leads to the driving force primarily coming from the topological defects instead of the combination of defects and dual spatial gradient. Therefore, for an active nematic system, increasing the self-driven speed of the particles will enhance the tangential driving force imposing on the flow field, thereby promoting the generation of circular rotation states. At the same time, a single source of tangential driving force can cause variations in the number and location of defects to directly impact the structure of the entire system, thus reducing stability.
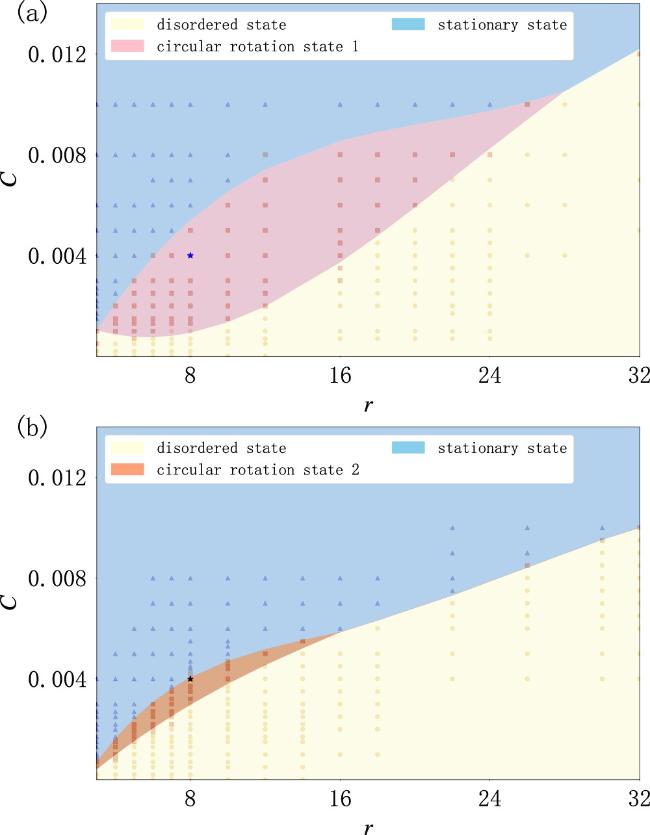
To more comprehensively reflect the impact of self-driven speed, figure 6 presents phase diagrams for two different v0. As illustrated in figure 6(a) with v0 = 0.01, as the confinement size r increases, the required alignment strength coefficient C to facilitate the transition from the disordered state to the circular rotation state also increases. These manipulations can also be practically implemented. Active alignment strength can be adjusted experimentally by modifying the length (shape) or the local density of the active particles [22, 56]. Additionally, it is sometimes influenced by their mode of movement [57]. The circular rotation state 1 in figure 6(a) is a state characterized by high stability, as shown in figure 5(b). Clearly, within the appropriate parameter space of C and r, confined active nematic particles with a self-driven speed of 0.01are sufficient to form collective vortex motion. However, when the self-driven speed decreases to 0, the circular rotation state becomes hard to form. In figure 6(b), the circular rotation state 2 refers to the state with more defects, and the region of global rotation has narrowed. The v0 = 0 system predominantly exhibits itself as either disordered or stationary states in contrast to the v0 = 0.01 system. In essence, an increase in the self-driven speed enhances the formation of circular rotation states in confined active systems and leads to the enlargement of the circular rotation state region on the phase diagram.
Figure 6. Phase diagram of circular confined nematic systems as functions of C and r, with particles of self-driven speed v0 = 0.01 in (a) and 0 in (b). The density of particles $\rho$ = 2.5, μ/α = 800, Cn = 0.05. The two examples in figure 5 are marked with blue and black stars in (a) and (b) respectively. |
4. Discussion
In this model, active particles interact with the flow field and spontaneously form specific structures in confined domains. Applying this model to our simulation, we find that with the presence of boundaries, active nematic systems respond significantly to changes in the self-driven speed of particles.
Throughout the simulation, we find that in confined active nematic systems, the increase of the self-driven speed promotes the formation of a typical collective motion of active particles: the circular rotation state. Furthermore, it has been observed that the circular rotation state consisting of particles with a higher self-driven speed exhibits increased stability. We also focus on two crucial parameters in addition to v0: the interparticle nematic alignment strength coefficient C and the confinement size r, which determines the occurrence of +1/2 defects in the particle field under confined conditions. Specifically, when confined within a circular domain, variations in C and r lead the system to exhibit three distinct structures: the disordered state, circular rotation state, and stationary state. By observing the formation of these structures, particularly the circular rotations, we find that an increase in the self-driven speed v0 expands the formation range of the circular rotation state in the phase diagram as functions of C and r. This response of the active system to the change in self-driven speed of the particles allows us to use this property to roughly determine the relative magnitude of the particle’s self-driven speed, and also provides access to assist active nematic systems in forming circular rotations and achieving greater stability.