


1. Introduction
The phenomenon of electromagnetically induced grating (EIG) can be achieved when the traveling wave used in electromagnetically induced transparency (EIT) [1, 2] is replaced by a standing wave. EIG has been extensively studied both theoretically and experimentally [3–7]. The phenomenon of EIG has become a focal point in optical research due to its wide range of applications, including optical switching [6, 8, 9], bistability [10], light storage [11], imaging [12], and dipole solitons [13]. In EIG, the incident probe light undergoes diffraction into various orders due to a diffraction grating formed by the spatial modulation of the amplitude and phase of the transmission. This phenomenon was initially investigated theoretically [3, 14] and subsequently observed experimentally in a cold atomic medium [15, 16]. Since then, EIG has been extensively studied in various systems [17, 18], including quantum dots, quantum wells [19, 20], and artificial molecules [21]. Diffraction gratings have been widely utilized in advanced optical systems due to their ability to manipulate light propagation and energy distribution effectively. These systems benefit significantly from efficient energy management and optimal control, akin to hybrid microgrids for energy systems, as demonstrated in [22]. Such precise control mechanisms are further explored in load management strategies for photovoltaic-based electric vehicle charging stations [23] and the scheduling of solar-powered energy storage systems for domestic loads [24]. These principles of control and energy distribution parallel the dynamics of coupling strength adjustment in photothermally induced gratin (PTIG), where tunable diffraction enables enhanced energy transfer to higher diffraction orders, providing a robust framework for high-precision applications in sensing and spectroscopy.
The two-dimensional (2D) grating offers several advantages over one-dimensional (1D) gratings. For instance, a 2D grating can diffract light into multiple directions within the plane, resulting in enhanced diffraction orders, which is essential for various applications. Additionally, 2D gratings can achieve higher spatial resolution compared to 1D gratings, making them particularly valuable in imaging, sensing, and spectroscopy. The study of 2D gratings has been conducted in various atomic systems, including two-level atomic configurations [25], three-level systems [26], four-level configurations [27], and four-level N-type systems [28].
Furthermore, in optomechanical systems, a phenomenon analogous to EIT occurs, referred to as Optomechanically Induced Transparency (OMIT) [29, 30]. In OMIT, radiation pressure is generated inside the cavity due to the interaction between control and probe fields. This radiation pressure induces coherent oscillations of the cavity mirror. When the frequency difference between the probe and control fields matches the oscillation frequency of the mirror, transparency is generated through destructive interference. Recent developments have also explored a related phenomenon known as Photothermally Induced Transparency (PTIT). In PTIT, transparency is achieved via the photothermal effect in a cavity [31]. Here, radiation pressure is produced as a result of photon absorption by the cavity mirror, leading to thermal expansion of the mirror's coating. The photothermal effect can either increase or decrease the optical length of the cavity [32, 33]. Recently, the concepts of OMIT and PTIT have been extended to one-dimensional optomechanically induced grating (OMIG) [34, 35] and PTIG [36] and magnomechanical induced grating [37]. The development of advanced optical and sensing technologies has revolutionized scientific and industrial applications, with fiber-based and integrated photonic sensors providing high precision and sensitivity. For example, Chen et al [38] demonstrated simultaneous chemical and temperature detection using an all-fiber Michelson interferometer, while it has been achieved high-sensitivity hydrogen detection with a hybrid plasmonic waveguide [39]. Photonic devices have also excelled in structural monitoring, such as in [40] hybrid FBG-based vibration transducer and their soil settlement study [41]. Advances in optical materials, including PhOLEDs and waveguide devices, highlight innovation in photonics [42, 43]. Emerging technologies, such as nonlinear geometric phase-coded fluids [44] and high-Q silicon microring resonators [45], further expand possibilities, including subwavelength resonance phenomena [46].
In earlier investigation [35], 1D PTIG have been explored extensively, providing significant insights into light diffraction and beam manipulation. Building on this study, we are motivated to extend the phenomenon from 1D PTIG to 2D PTIG. This transition is not just a theoretical extension, but it introduces a host of practical advantages that are critical for advanced optical systems. The 2D grating offers enhanced control over light propagation, allowing diffraction in multiple directions within a plane. This multi-directional control enables more efficient manipulation of light, leading to higher diffraction orders, which is essential for a variety of cutting-edge applications. The ability to harness these enhanced diffraction orders has far-reaching implications in fields such as optical imaging, high-precision sensing, and advanced spectroscopy. Moreover, the spatial resolution provided by 2D gratings is superior to that of 1D gratings, making it an invaluable tool in systems requiring precise spatial light control. Whether in imaging systems, where fine detail is dominant, or in spectroscopy, where distinguishing between closely spaced spectral features is crucial, the advantages of 2D gratings are clear. A key aspect of the 2D PTIG system is the coupling strength, which governs the diffraction pattern. By adjusting the coupling strength in our proposed system, we can tune the diffraction orders and enhance the energy distribution across higher orders within the plane. This tuning ability is particularly beneficial in applications requiring controlled diffraction, as it provides flexibility in manipulating light energy for specific tasks. In conclusion, the shift from 1D to 2D PTIG represents not only a natural progression in research but also a leap forward in technological capabilities. Enhanced diffraction, spatial resolution, and tunable coupling strength make 2D gratings a powerful tool in optical sciences and engineering.
2. Model and formalism
We propose a photothermal cavity of length L, which can be simultaneously driven by both a strong pump field and a weak probe field, as illustrated in figure 1(a). The frequency of the weak probe field is denoted by ωp, while the strong pump field has a frequency ωl. The weak probe field propagates in the x-direction and lacks spatial dependence. In contrast, the strong field is applied symmetrically through the cavity, intersecting to generate a standing wave (SW), as depicted in figure 1(b). The dispersion and absorption of the probe field are now dependent on the strength of the strong field. Our aim is to investigate the periodic changes in these coefficients as the SW shifts from antinodes to nodes along the z-direction. When the probe field propagates perpendicularly through the proposed cavity, it will diffract into various orders. It is important to note that the left mirror's coating is made of fused silica. In this setup, the SW field can be absorbed by the cavity mirror, causing the thermal expansion of the mirror surfaces. To analyze the dynamics of the proposed system, we calculate the equations of motion, as discussed in [31].1 ) and (3 ), gives the steady-state solution as
$\begin{eqnarray}\dot{{x}_{\rm{th}\,}}=-\frac{{\gamma }_{\,\rm{th}}}{m}({x}_{\rm{th}\,}+\hslash \beta {g}_{\,\rm{cp}}{a}^{\dagger }a),\end{eqnarray}$
$\begin{eqnarray}\dot{a}=-[\kappa -\,\rm{i}\,({{\rm{\Delta }}}_{c}+{g}_{\rm{cp}}{x}_{\rm{th}})]a+{{\rm{E}}}_{{l}}+{E}_{p}{{\rm{e}}}^{-\rm{i}\delta t}.\end{eqnarray}$
Here, γth gives us the photothermal relaxation rate, $\beta =\frac{\rm{d}\,{z}_{\rm{th}}}{\,\rm{d}{P}_{c}}$ is known as the photothermal coefficient, where κ is the cavity decay. The power can be represented by Pc = ℏωc∣a∣2/τc, where τc = 2L/c is known as the cavity round trip time. Also, Δc = ωc − ωl is the detuning of the cavity and δ = ωp − ωl. The annihilation (creation) operator is a (and a†), respectively. In the above equations, gcp = ωc/L represents coupling strength whereas xth is the change occur under the photothermal effect. In the above equation, the last terms represents the weak probe field and strong field. Here, the probe field amplitude is $| {\,{\rm{E}}}_{p}| =\sqrt{\tfrac{2\kappa {P}_{p}}{\hslash {\omega }_{p}}}$ whereas the SW field is by El = Emsin[πx/Λx] with an amplitude ∣Em∣ =$\sqrt{\frac{2\kappa {P}_{l}}{\hslash {\omega }_{l}}}$. To explore the effect of photothermal cavity on the output probe field, we must find the steady state solution of the above equations. We use the approximation as ⟨xtha⟩ ≈ ⟨xth⟩⟨a⟩ we can get $\begin{eqnarray}\begin{array}{rcl}\langle \dot{{x}_{\rm{th}}}\rangle & = & -\displaystyle \frac{{\gamma }_{\rm{th}}}{m}(\langle {x}_{\rm{th}}\rangle +\hslash \beta {g}_{\rm{cp}}\langle {a}^{\dagger }\rangle \langle a\rangle ),\\ \langle \dot{a}\rangle & = & -[\kappa -\,\rm{i}\,({{\rm{\Delta }}}_{c}+{g}_{\rm{cp}}\langle {x}_{\rm{th}}\rangle )]\langle a\rangle +{{\rm{E}}}_{l}+{{\rm{E}}}_{p}{{\rm{e}}}^{-\rm{i}\delta t}.\end{array}\end{eqnarray}$
We assume that the probe field is weaker than strong field and then we consider xth = xs + δxth, a = as + δa that leads to linearized equations ( $\begin{eqnarray}{x}_{s}=-\beta {g}_{\mathrm{cp}}| {a}_{s}{| }^{2},\end{eqnarray}$
$\begin{eqnarray}{a}_{s}=\displaystyle \frac{{{\rm{E}}}_{l}}{\kappa -\,\rm{i}({{\rm{\Delta }}}_{c}+{g}_{\rm{cp}}{x}_{s})},\end{eqnarray}$
with the linearized equations $\begin{eqnarray}\delta \dot{{x}_{\rm{th}\,}}=-\frac{{\gamma }_{\,\rm{th}}}{m}\left[\delta {x}_{\rm{th}\,}+\hslash \beta {g}_{\,\rm{cp}}({a}_{s}\delta {a}^{* }+{a}_{s}^{* }\delta a)\right],\end{eqnarray}$
$\begin{eqnarray}\delta \dot{a}=-\kappa \delta a+\,\rm{i}\,({{\rm{\Delta }}}_{c}+{g}_{\rm{cp}}{x}_{s})\delta a+i{g}_{\rm{cp}}{a}_{s}{x}_{\rm{th}}+{{\rm{E}}}_{p}{{\rm{e}}}^{-\rm{i}\delta t}.\end{eqnarray}$
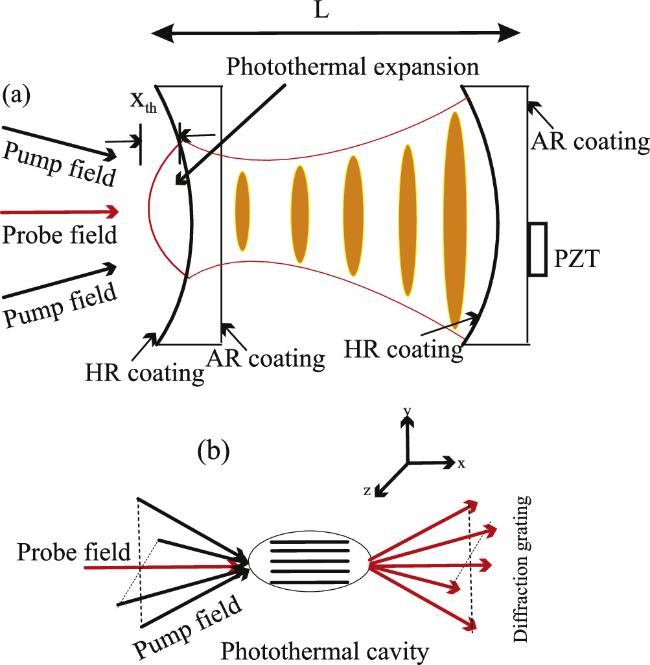
Figure 1. (a) Schematic configuration of the suggested cavity where probe and pump fields are applied. (b) Schematic of the two dimensional grating when a probe field diffracts through a standing wave. |
In equation (7 ), Δ0 = Δc + gcpxs and is known as the effective detuning. To find the dynamical behavior of the proposed system next we consider the ansatz as 8 ) and (9 ) into equations (6 ) and (7 ) such as 11 ) and (12 ) then it leads to
$\begin{eqnarray}\delta a=\delta {a}_{-}{{\rm{e}}}^{-\,\rm{i}\delta t}+\delta {a}_{+}{{\rm{e}}}^{\rm{i}\,\delta t},\end{eqnarray}$
$\begin{eqnarray}\delta {x}_{\,\rm{th}}={x}_{-}{{\rm{e}}}^{-\rm{i}\delta t}+{x}_{+}{{\rm{e}}}^{\rm{i}\,\delta t}.\end{eqnarray}$
The solution can be obtained in the first order when we substitute equations ( $\begin{eqnarray}\delta {a}_{-}=\frac{m{\alpha }_{2}{\alpha }_{3}-\rm{i}\,| {a}_{s}{| }^{2}{g}_{\rm{cp}}^{2}{\gamma }_{\rm{th}}\beta }{m{\alpha }_{1}{\alpha }_{2}{\alpha }_{3}-\rm{i}| {a}_{s}{| }^{2}{g}_{\rm{cp}}^{2}{\alpha }_{1}\beta {\gamma }_{\rm{th}}+\rm{i}| {a}_{s}{| }^{2}{g}_{\rm{cp}}^{2}{\alpha }_{3}\beta {\gamma }_{\,\rm{th}}},\end{eqnarray}$
where $\begin{eqnarray*}\begin{array}{rcl}{\alpha }_{1} & = & \kappa -\rm{i}\,\delta -\,\rm{i}{{\rm{\Delta }}}_{0},\\ {\alpha }_{2} & = & {\gamma }_{\rm{th}}/m-\,\rm{i}\delta ,\\ {\alpha }_{3} & = & \kappa -\rm{i}\,\delta +\,\rm{i}{{\rm{\Delta }}}_{0}.\end{array}\end{eqnarray*}$
For any cavity system one can write the input-output relation as [47] $\begin{eqnarray}{\,{\rm{E}}}_{\rm{out}\,}(t)+{\,{\rm{E}}}_{{\rm{p}}}{{\rm{e}}}^{-\rm{i}\delta t}+{{\rm{E}}}_{{\rm{l}}\,}=\sqrt{2\kappa }\delta a,\end{eqnarray}$
where $\begin{eqnarray}{\,{\rm{E}}}_{\rm{out}\,}(t)={\,{\rm{E}}}_{\rm{out}}^{0}+{{\rm{E}}}_{\rm{out}}^{+}{{\rm{E}}}_{{\rm{p}}}{{\rm{e}}}^{-\rm{i}\delta t}+{{\rm{E}}}_{\rm{out}}^{-}{{\rm{E}}}_{{\rm{p}}}{{\rm{e}}}^{\rm{i}\,\delta t}.\end{eqnarray}$
When we solve the equations ( $\begin{eqnarray}{\,{\rm{E}}}_{\rm{out}}^{+}=\displaystyle \frac{\sqrt{2\kappa }\delta {a}_{-}}{{{\rm{E}}}_{{\rm{p}}\,}}-1.\end{eqnarray}$
For suitability, we must define $\begin{eqnarray}{\,{\rm{E}}}_{\rm{out}}^{+}+1=\displaystyle \frac{\sqrt{2\kappa }\delta {a}_{-}}{{{\rm{E}}}_{p}}={{\rm{E}}}_{T}.\end{eqnarray}$
As we know the quadratures of the field can be defined as ET = Re[ET] + iIm[ET] such as Re[ET] (Im[ET]) is the out of phase (in phase) quadrature of the output field.Now the phase dispersion of the probe field may be written as 16 ) one can find the transmission function of the proposed cavity will be
$\begin{eqnarray}{\phi }_{1}({\omega }_{p})=\,\rm{arg}\,[{t}_{p}({\omega }_{p})].S.\end{eqnarray}$
The response of the proposed medium to a probe field can be described by Maxwell's equations. In the analysis that follows, we ignore the transverse component of the Maxwell equations. By applying the slowly varying envelope approximation and considering the steady-state regime, the expression can be written as follows: $\begin{eqnarray}\displaystyle \frac{\partial {\,{\rm{E}}}_{p}}{\partial x}=[-\alpha +\,\rm{i}\,\eta ]{\,{\rm{E}}}_{p},\end{eqnarray}$
where $\alpha =(\tfrac{2\pi }{\lambda })\,\rm{Re}\,[{\,{\rm{E}}}_{{\rm{T}}\,}]$ and $\eta =\left(\tfrac{2\pi }{\lambda }\right)\,\rm{Im}\,[{\,{\rm{E}}}_{{\rm{T}}\,}]$ gives us the absorption and dispersion properties of the probe field, respectively. In this case, ${{ \mathcal E }}_{l}(z)$ is a function of z and we must say that α and η will be a function of z. By solving equation ( $\begin{eqnarray}T(y,z)={{\rm{e}}}^{-\alpha (y,z)L+\,\rm{i}\,\eta (y,z)L},\end{eqnarray}$
where, ∣T(y, z)∣ = e−α(y,z)L and φ2(y, z) = η(y, z)L represent the amplitude and phase modulation of the cavity, respectively. We now aim to extend the dynamics from a one-dimensional to a two-dimensional problem. In this case, the pump El(z, y) must consist of two orthogonal standing wave fields with similar frequencies along the z- and y-axes. Therefore, the pump field must take the form El(z, y) = E0[sin(πz/Λz) + sin(πy/Λy)]. In this situation, the absorption and dispersion are modulated periodically along both the z- and y-axes. By taking the Fourier transform of T(y, z) and using the Fraunhofer diffraction the intensity distribution may be written as [48, 49] $\begin{eqnarray}\begin{array}{rcl}{I}_{p}({\theta }_{z},{\theta }_{y}) & = & {|{{\rm{E}}}_{p}({\theta }_{z},{\theta }_{y})|}^{2}\displaystyle \frac{{\rm{sin}}^{2}(N\pi {{\rm{\Lambda }}}_{z}\,\rm{sin}\,({\theta }_{z})/\lambda )}{{N}^{2}{\rm{sin}}^{2}(\pi {{\rm{\Lambda }}}_{z}\,\rm{sin}\,({\theta }_{z})/\lambda )}\\ & & \times \,\displaystyle \frac{{\rm{sin}}^{2}(N\pi {{\rm{\Lambda }}}_{y}\,\rm{sin}\,({\theta }_{y})/\lambda )}{{N}^{2}{\rm{sin}}^{2}(\pi {{\rm{\Lambda }}}_{y}\,\rm{sin}\,({\theta }_{y})/\lambda )},\end{array}\end{eqnarray}$
where $\begin{eqnarray*}{{\rm{E}}}_{p}({\theta }_{z},{\theta }_{y})={\int }_{0}^{1}{\int }_{0}^{1}T(z,y)A{{\rm{e}}}^{-2\pi \iota {{\rm{\Lambda }}}_{y}y\rm{sin}({\theta }_{y})/\lambda }{\rm{d}}z{\rm{d}}y,\end{eqnarray*}$
whereas $A={{\rm{e}}}^{-2\pi \,\rm{i}{\Lambda }_{z}z\rm{sin}\,({\theta }_{z})/\lambda }$.3. Results and discussion
To begin, we examine the characteristics of the output probe field, with the real part of this field, Re[ET], indicating the probe field's absorption properties. Figure 2(a) presents the spectrum of Re[ET] as a function of the normalized probe field detuning, δ/κ. In the absence of coupling strength gcp, the spectrum displays a Lorentzian shape, signaling significant absorption of the probe field within the cavity. However, as shown in figure 2(b), when gcp is nonzero, a narrow transparency window appears in the Re[ET] spectrum, characteristic of PTIT [31]. This phenomenon arises because, with the coupling strength gcp activated (i.e. when the control field is switched on), the cavity mirror absorbs intracavity photons, raising its temperature. The resultant temperature change induces thermal expansion of the mirror, altering the cavity length. This effect is sensitive to the incident field's power on the mirror surface. The expansion in cavity length generates Stokes and anti-Stokes scattering within the cavity, leading to PTIT. Notably, PTIT emerges when the probe field frequency closely aligns with that of the pump field, distinguishing it from OMIT, where the beat frequency of the pump and probe matches the mechanical frequency.
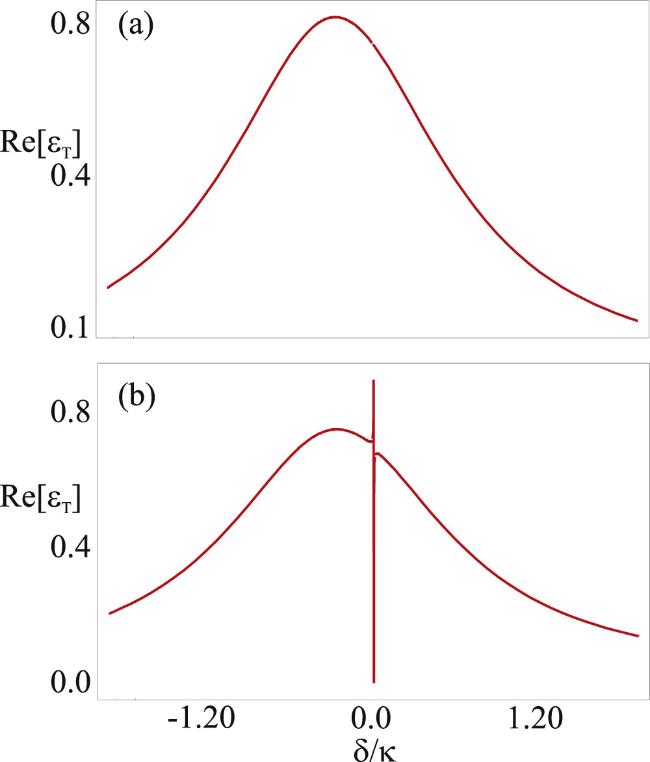
Figure 2. The real part of Eout against δ/κ for (a) gcp = 0 and (b) gcp/2π = 1.8 MHz. The other parameters are Em/2π = 0.5 MHz, κ/2π = 530 kHz, Δc/2π = 10 MHz, Δ0 = 0.28κ, β = −1.8 pm W−1 and γth/2π = 15.9 Hz. |
In figure 3, we present the spectrum of amplitude modulation of the transmission function for various values of the coupling strength gcp. It is evident from figure 3 that the amplitude modulation depends on the coupling strength gcp. Specifically, by setting gcp/2π = 0. MHz, we illustrate the spectrum of ∣T(z, y)∣ as a function of Λz and Λy, as shown in figure 3(a). The plot reveals a minor amplitude modulation at this coupling strength. Furthermore, we increase the coupling strength gcp from 0.6 to 1 MHz and re-plot the amplitude modulation, as depicted in figure 3(b). The results indicate that increasing the coupling strength enhances the amplitude modulation, making it more pronounced. Similarly, we examine the phase modulation for different values of pgcp, as illustrated in figure 4. It is observed that for a high value of gcp/2π = 1 MHz, the phase modulation becomes more pronounced compared to a smaller value of gcp/2π = 0.6 MHz. Comparing figures 3 and 4, it is clear that the amplitude modulation is more significantly affected by higher values of the coupling strength gcp. This suggests that the diffraction system is influenced by both the amplitude and phase modulation of the probe field.
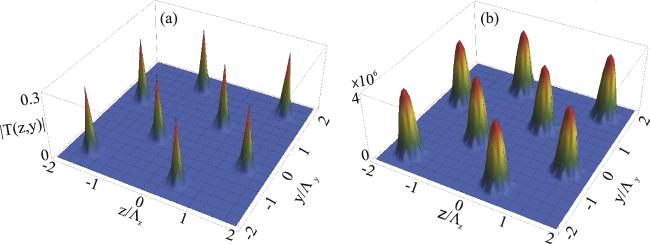
Figure 3. (a) The amplitude ∣T(z, y)∣ of the transmission function when gcp/2π = 0.6 MHz (b) The amplitude ∣T(z, y)∣ of the transmission function when gcp/2π = 1 MHz. The other parameters are Em/2π = 0.5 MHz, κ/2π = 530 kHz, Δc/2π = 10 MHz, Δ0 = 0.28κ, β = −1.8 pm W−1 and γth/2π = 15.9 Hz. |
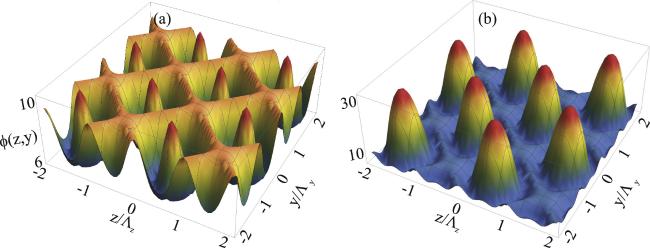
Figure 4. (a) The phase φ(z, y) of the transmission function gcp/2π = 0.6 MHz (b) The phase φ(x, y) of the transmission function gcp/2π = 1 MHz. The other parameters are Em/2π = 0.5 MHz, κ/2π = 530 kHz, Δc/2π = 10 MHz, Δ0 = 0.28κ, β = −1.8 pm W−1 and γth/2π = 15.9 Hz. |
To gain a comprehensive understanding of the phenomenon of PTIG, it is essential to first discuss PTIT. When a strong pump field interacts with the proposed cavity, the mirrors of the cavity absorb photons, leading to thermal expansion. This thermal expansion alters the refractive index of the mirrors, thereby modifying the optical path length of the cavity through the photothermal effect. As a result, the cavity length can be altered due to the coupling between intracavity power and the cavity length. In the presence of the photothermal effect, even a slight difference between the probe and pump fields can generate interference, which subsequently modifies the optical path length. This modification leads to the creation of anti-Stokes and Stokes optical sidebands. The process can give rise to transparency, known as PTIT. Next, we consider a system that interacts with a standing wave field in both the z- and y-directions, as depicted in figure 1(b). When the standing wave field is reproduced within the proposed cavity, the absorption of the cavity changes periodically, resulting in the formation of nodes and anti-nodes, as illustrated in figure 1(b). Consequently, when the probe field propagates through the cavity, it experiences periodic absorption and transmission. This periodic modulation of the cavity's absorption enables the occurrence of PTIG within the suggested cavity structure.
We analyze equation (18 ) and present the diffraction intensity distribution Ip(θz, θy) as a function of both the θz- and θy-directions for two different values of the coupling strength gcp, as illustrated in figure 5. For a coupling strength of gcp/2π = 0.6 MHz, the intensity distribution is shown in figure 5(a). Here, we observe that the maximum energy is transferred to the first diffraction order, with minimal energy transferred to higher orders. Increasing the coupling strength from gcp/2π = 0.6 MHz to gcp/2π = 1 MHz reveals that energy is also transferred to the second and third diffraction orders, indicating enhanced energy distribution across multiple orders as shown in figure 5(b).
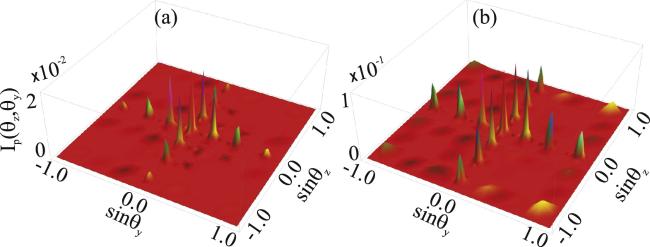
Figure 5. The diffraction intensity distribution Ip(θz, θy) versus θz and θy (a) gcp/2π = 0.6 MHz (b) gcp/2π = 1 MHz where the parameters are N = 5, Λz = 4λ and L = 50 μm The other parameters are Em/2π = 0.5 MHz, κ/2π = 530 kHz, Δc/2π = 10 MHz, Δ0 = 0.28κ, β = −1.8 pm W−1 and γth/2π = 15.9 Hz. |
Further, we set gcp/2π = 1.1 MHz and provide a contour plot of Ip(θz, θy), shown in figure 6(a). The plot reveals a pronounced intensity at the zeroth order, with some energy transferred to the first order, while the second and third orders exhibit lower intensity. As depicted in figure 6(a), energy transfer occurs to the (±m, 0) and (0, ±n) orders, where m and n are integers, with the dominant energy concentrated in the (0,0) order. Additionally, some energy is transferred to the (±1, ±1) order. The coupling strength gcp plays a fundamental role in the behavior of our proposed system. By increasing gcp from 1 to 1.5 MHz, we observe a redistribution of the probe field's energy across various diffraction orders, as depicted in figure 6(b). Specifically, the energy is transferred to the zeroth order (0, 0), the first order (±1, ±1), the second order (±2, ±2), and the third order (±3, ±3). In general, the energy can be transferred to any higher-order mode denoted as (±m, ±n). A particularly noteworthy observation is the dominance of the probe field energy in higher orders compared to the zeroth order (0, 0). As the coupling strength gcp is further increased, the energy transfer becomes increasingly pronounced in higher orders, as shown in figure 6(c). This indicates that the probe field energy in the higher orders becomes more prominent than in the lower orders. Remarkably, as gcp increases further, the probe field energy can be almost entirely transferred to higher orders. This behavior is illustrated in figure 6(d), where for gcp/2π = 5 MHz, the majority of the probe field energy is transferred to the third order (±3, ±3), with only a small amount of energy still present in the second order. However, the energy in the second order is significantly lower compared to that in the third order.
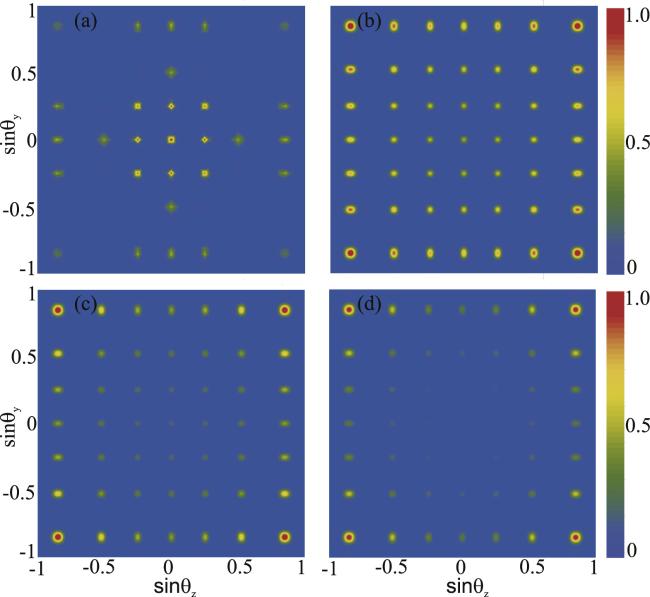
Figure 6. (a) The diffraction intensity distribution Ip(θz, θy) versus θz and θy when (a) gcp/2π = 1.1 MHz (b) gcp/2π = 1.5 MHz (c) gcp/2π = 3 MHz (d) gcp/2π = 5 MHz. The parameters are N = 5, Λz = 4 λand L = 50 μm The other parameters remains the same as shown in figure 5. |
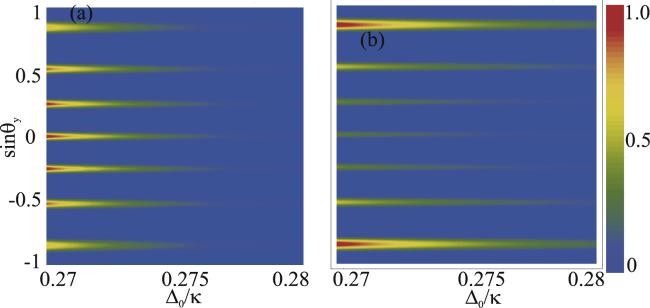
The effective detuning, Δ0, can also influence the group delay of the weak probe field, as discussed in [31], where it was demonstrated that a significant group delay can be achieved for small values of Δ0. In our system, we are also interested in understanding the effect of Δ0 on the diffraction grating. To this end, we fixed θx = 0.52 radian and present a contour plot of the intensity distribution as a function of θy and Δ0/κ for two different values of the coupling strength, gcp, as illustrated in figure 7. In figure 7(a), the spectrum is shown for a coupling strength of gcp/2π = 1.5 MHz. It is observed that for small values of Δ0/κ, the intensity of the probe field is high for the zeroth, first, and second diffraction orders, and gradually decreases as the value of the effective detuning increases. Subsequently, we increased the value of gcp from 1.5 to 5 MHz and plotted the intensity distribution versus θy and Δ0/κ again, as depicted in figure 7(b). Notably, the probe field intensity becomes larger in the third-order, indicating that maximum energy is transferred to higher orders, while the intensity decreases with increasing values of Δ0/κ.
Figure 7. (a) The diffraction intensity distribution Ip(θz, θy) versus θy and Δ0/κ when sinθz = 0.52 radian (a) gcp/2π = 1.5 MHz (b) gcp/2π = 5 MHz. The parameters are N = 5, Λy = Λz = 4λ and L = 50 μm The other parameters are Em/2π = 0.5 MHz, κ/2π = 530 kHz, Δc/2π = 10 MHz, β = −1.8 pm W−1 and γth/2π = 15.9 Hz. |
For a comprehensive theoretical analysis, it is essential to provide experimental validation. Several parameters can be employed in our theoretical investigation, including the cavity length L, Λz = π/kz, Λy = π/ky, the mirror substrate thickness e, and the photon lifetime in the cavity. In our setup, we assume a mirror thickness of 6 mm, while the thickness of fused silica is approximately 130 nm. The pump power and beam waist are 90 mW and 9 mm, respectively. The cavity quality factor is 541 × 106 and the finesse is 5760, as reported earlier [31]. It is important to highlight that the phenomenon of PTIT has been experimentally observed by recording the weak output field [31]. In our theoretical model, anti-nodes and nodes are generated within the cavity when the pump field forms a standing wave. The nodes block the probe field, while the anti-nodes scatter it. The intensity of the scattered field can be measured, allowing one to deduce the presence of a diffraction grating. Therefore, the PTIG can be experimentally observed in our suggested system.
4. Summary
In summary, we have conducted a theoretical investigation of 2D PTIG using a weak probe field to explore the diffraction of probe energy through a photothermal cavity driven by a standing wave pump field. Photothermal effects cause the beating of the probe and standing wave to generate a 2D diffraction grating initiated by PTIT. By varying the cavity's coupling strength, different diffraction orders of the probe energy can be achieved in the plane, with a significant transfer of energy to higher orders, especially the third order. The ability to manipulate the coupling strength effectively allows it to act as a switching mechanism, which is crucial for a wide range of applications.