


1. Introduction
Nonclassical light fields play a crucial role in a wide range of applications. For instance, in gravitational wave detection, squeezed states are used to reduce photon counting noise and radiation pressure fluctuations [1, 2]. Other notable applications include optical waveguide taps [3], where squeezed states in one waveguide are employed to extract information from another; the Jiuzhang quantum computer [4]; continuous-variable quantum key distribution, which ensures the security of transmitted information [5]; and microlasers, where a small number of strontium atoms strongly interact with a high-Q microsphere [6].
Nonclassical light fields can be judged by the second-order correlation function, defined as
$\begin{eqnarray}{G}_{n,m}^{(2)}(\tau )=\frac{\langle {a}_{n}^{\dagger }(t){a}_{m}^{\dagger }(t+\tau ){a}_{n}(t){a}_{m}(t+\tau )\rangle }{\langle {a}_{n}^{\dagger }(t){a}_{n}(t)\rangle \langle {a}_{m}^{\dagger }(t){a}_{m}(t)\rangle },\end{eqnarray}$
which was first introduced in the Hanbury Brown and Twiss (HBT) experiment [7]. In this equation, ${\hat{a}}_{n}$ and ${\hat{a}}_{m}$ (${\hat{a}}_{n}^{\dagger }$ and ${\hat{a}}_{m}^{\dagger }$) represent the photon annihilation (creation) operators. The indices “n, m” belong to the set {1, 2}, corresponding to field n and field m, respectively, and τ denotes the time delay. The autocorrelations are represented by ${G}_{n,n}^{(2)}$ and ${G}_{m,m}^{(2)}$, while ${G}_{n,m}^{(2)}$ represents the cross-correlation between fields n and m.The second-order correlation function provides insight into the nature of light. For a given field n, when ${G}_{n,n}^{(2)}(0)=1$, it indicates that the photon number N follows Poissonian statistics, meaning that the mean photon number $\overline{N}$ is equal to the photon number fluctuation ΔN2. This corresponds to a coherent state, which is characteristic of classical light. If ${G}_{n,n}^{(2)}(0)\gt 1$, the light exhibits super-Poissonian statistics, where photons tend to bunch together. A typical example of this is thermal light, for which ${G}_{n,n}^{(2)}(0)=2$. On the other hand, ${G}_{n,n}^{(2)}(0)\lt 1$ indicates photon anti-bunching (sub-Poissonian statistics), where photons tend to appear one by one, a hallmark of nonclassical light sources. Sub-Poissonian statistics, where $\overline{N}\gt {\rm{\Delta }}{N}^{2}$, may also be referred to as a photon-number squeezed state [8].
Nonclassical light fields can be generated from various sources, such as single-photon scatterers [9–11], one-atom lasers [12], nanomechanical resonators creating nonclassical correlations between single photons and phonons [13], the process of spontaneous four-wave mixing in warm rubidium vapors [14], and single-photon emitters based on lattice-trapped interacting atoms [15].
In addition to single light fields, nonclassical correlations can also arise between two light fields. These correlations can be assessed using the Cauchy–Schwarz (CS) inequality [16], which is expressed as:
$\begin{eqnarray}{G}_{n,m}^{(2)}(0)\leqslant \sqrt{{G}_{n,n}^{(2)}(0){G}_{m,m}^{(2)}(0)}.\end{eqnarray}$
This inequality is important in both mathematics and physics. In mathematics, it is stated that the absolute value of the inner product of two vectors cannot exceed the product of their magnitudes. In physics, it implies that the expectation value of the cross-correlation between two quantities is constrained by the product of their individual autocorrelations.In classical physics, the CS inequality holds, meaning that the root mean square of the intensity autocorrelations of two light fields is always greater than or equal to the absolute value of their cross-correlation. However, in nonclassical conditions, the system violates the CS inequality. In this case, the cross-correlation ${G}_{n,m}^{(2)}(0)$ between two photons can exceed the product of the autocorrelations ${G}_{n,n}^{(2)}(0)$ and ${G}_{m,m}^{(2)}(0)$, i.e.,
$\begin{eqnarray*}{G}_{n,m}^{(2)}(0)\gt \sqrt{{G}_{n,n}^{(2)}(0){G}_{m,m}^{(2)}(0)}.\end{eqnarray*}$
To quantify this violation, we introduce a coefficient $R=\frac{{G}_{n,m}^{(2)}(0)}{\sqrt{{G}_{n,n}^{(2)}(0){G}_{m,m}^{(2)}(0)}}$. This violation serves as a crucial indicator of the nonclassical behavior of light fields [13].Such violations have been demonstrated in various research areas, including matter waves [17] with a violation of R ≥ 1.06, warm atomic ensembles at telecommunication wavelengths [18] with a large violation R ≥ 495, spontaneous four-wave mixing [19] with R = 1.98, and microwave-optical photon pair generation using a chip-scale transducer [20] with R ≈ 1.9. These violations highlight the nonclassical nature of the photon pairs involved.
In this paper, we theoretically investigate the generation of nonclassical light fields through a two-color one-atom laser, where both individual fields and their cross-correlation simultaneously exhibit nonclassical properties. The system consists of a 133Cs atom placed in a cavity, where two cavity modes are respectively coupled to the atomic 7S1/2 → 6P3/2 (1470 nm) and 7S1/2 → 6P1/2 (1359 nm) transitions, which are directly related to the cesium active optical clock [26]. A 459 nm laser is used to pump the atom. Based on this physical system, we analyze the characteristics of these fields and identify their nonclassical behaviors by calculating the first-order correlation functions, the laser spectra, the output powers, and the second-order correlation functions. Additionally, we examine the violation of the CS inequality with R reaching a maximum of 13.9 as a signature of nonclassical behavior.
2. Physical model
The laser scheme is illustrated in figure 1, where a 133Cs atom is placed inside an optical cavity. Two cavity modes are coupled to the 7S1/2–6P3/2 transition (wavelength 1470 nm) and the 7S1/2–6P1/2 transition (wavelength 1359 nm), corresponding to the clock transitions in the Cs active optical clock. A 459 nm light beam is used to pump the atom from the ground state 6S1/2 to the excited 7P1/2 state with a Rabi frequency Ω. The atom then spontaneously decays to the upper state of the laser transitions. After releasing energy into the cavity in the form of photons via stimulated emission, the atom returns to the ground state by spontaneous emission from the 6P1/2, 3/2 states.
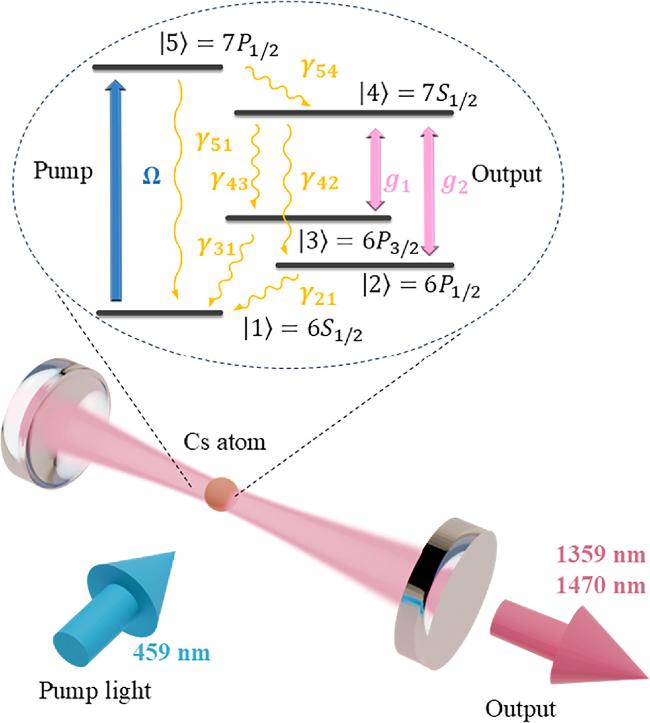
Figure 1. The experimental scheme. A 133Cs atom is placed inside a cavity that couples 1359 nm and 1470 nm output lights (red arrows) with a 459 nm pump light (blue arrow). The upper part of the diagram shows the energy levels corresponding to the clock transitions in the Cs active optical clock. The system consists of five levels, labeled ∣1⟩ to ∣5⟩, with their respective spontaneous emission rates denoted as γij, represented by yellow wavy lines. The Rabi frequency is denoted by Ω, and the coupling strengths are represented by g1,2. |
The system’s dynamics are described by the master equation [27]:
$\begin{eqnarray}\begin{array}{rcl}\frac{{\rm{d}}}{{\rm{d}}t}\rho & = & \frac{1}{{\rm{i}}\hslash }[\hat{H},\rho ]\\ & & +\frac{1}{2}\displaystyle \sum _{i\gt j}{\gamma }_{ij}\left[2{\hat{\sigma }}_{ij}\rho {\hat{\sigma }}_{ij}^{\dagger }-({\hat{\sigma }}_{ij}^{\dagger }{\hat{\sigma }}_{ij}\rho +\rho {\hat{\sigma }}_{ij}^{\dagger }{\hat{\sigma }}_{ij})\right]\\ & & +\frac{1}{2}\displaystyle \sum _{k}{\kappa }_{k}\left[2{\hat{a}}_{k}\rho {\hat{a}}_{k}^{\dagger }-({\hat{a}}_{k}^{\dagger }{\hat{a}}_{k}\rho \dagger \rho {\hat{a}}_{k}^{\dagger }{\hat{a}}_{k})\right].\end{array}\end{eqnarray}$
The first term represents the quantum coherent evolution of the system without dissipation, while the last two terms account for the decay processes. Here, ρ denotes the density matrix of the light-atom system, and $\hat{H}$ is the Hamiltonian describing the interaction between the light and the atom. The parameters γij are the spontaneous emission rates from state ∣i⟩ to ∣j⟩ (i, j ∈ {1, . . . , 5}, i > j), and ${\hat{\sigma }}_{ij}=| i\rangle \langle j| $ (${\hat{\sigma }}_{ij}^{\dagger }=| j\rangle \langle i| $) are the lowering (raising) operators. The parameters κk (k ∈ {1, 2}) correspond to the cavity decay rates for photon 1 (1470 nm) and photon 2 (1359 nm), which are influenced by the reflectivity of the cavity’s mirrors. The operators ${\hat{a}}_{k}$ (${\hat{a}}_{k}^{\dagger }$) are the annihilation (creation) operators for photons, and ℏ is the reduced Planck constant.The values of γij are sourced from [28]. For subsequent simulations, we define γ ≡ γ43 = 2π × 1.81 MHz as the reference frequency, such that coupling strengths and cavity decays are expressed as multiples of this value. The natural linewidths of other atomic transitions are as follows: γ42 = 2π × 0.991 MHz, γ51 = 2π × 2.12 MHz, γ54 = 2π × 0.337 MHz, γ31 = 2π × 5.16 MHz, and γ21 = 2π × 4.55 MHz.
The Hamiltonian $\hat{H}$ is given by:
$\begin{eqnarray}\begin{array}{rcl}\hat{H}/\hslash & = & \displaystyle \sum _{i}{\omega }_{i}| i\rangle \langle i| +\displaystyle \sum _{k}{\omega }_{Lk}{\hat{a}}_{k}^{\dagger }{\hat{a}}_{k}\\ & & +{\rm{\Omega }}| 5\rangle \langle 1| {{\rm{e}}}^{{\rm{i}}{\omega }_{L0}t}+{g}_{1}{\hat{a}}_{1}| 4\rangle \langle 3| \\ & & +{g}_{2}{\hat{a}}_{2}| 4\rangle \langle 2| +\,\rm{c.c.}\,,\end{array}\end{eqnarray}$
where all detunings are assumed to be zero. The pump light field is treated as semiclassical, while all other fields are quantized. The frequencies ωi correspond to the energy levels ∣i⟩, ωL0 represents the pump light’s frequency, and ωLk denotes the frequencies of photon 1 and photon 2. The coupling strengths are denoted by g1,2. The pump light intensity is set to a saturation level corresponding to ten times the maximum spontaneous emission rate, i.e., Ω = 10γ31.The value of gk is influenced by the effective volume Veff [29]:
$\begin{eqnarray}{g}_{k}=-\frac{{d}_{k}}{\hslash }\sqrt{\frac{\hslash {\omega }_{Lk}}{2{\epsilon }_{0}{V}_{\,\rm{eff}\,}}},\end{eqnarray}$
where dk is the electric dipole moment and ε0 is the permittivity of free space. This expression shows that if the coupling strength is set to g = 10γ or 0.1γ, the effective volume Veff must be approximately 6.78 × 10⁻⁵ mm3 or 0.678 mm3, respectively. In an actual experiment, if the beam radius is on the order of 10 μm and the cavity decay rate κ is 0.1γ, the corresponding finesse values would be approximately 6.09 × 10⁵ or 60.9.In this paper, we employ the master equation wave function approach [30, 31], combined with the Runge–Kutta method [32] for numerical simulations, and apply the quantum regression theorem [33] to investigate the time evolution of coherent dynamics. This includes the first- and second-order correlation functions as a function of the time delay τ. The initial state is set to ∣100⟩, where the initial photon number for both modes is zero, and the atom is in its ground state. We explore various conditions, including different coupling strengths (g > γ, g = γ, and g < γ) and cavity decay rates (κ1 > κ2, κ1 = κ2, and κ1 < κ2). Using these parameters, we calculate the output powers, power spectra, lifetimes, and the first-order correlation functions for the two photons, as well as the second-order auto-correlation functions ${G}_{1,1}^{(2)}(0)$, ${G}_{2,2}^{(2)}(0)$, and cross-correlation function ${G}_{1,2}^{(2)}(0)$ in different cavity environments.
3. Results
3.1. Cavity output characteristics
We have calculated the mean photon numbers and further determined the external output power P for the two fields under varying coupling strengths and cavity decay rates. Specifically, the decay rate ratio κ1/κ2 and the coupling strength g1/γ were systematically set to 0.1, 1, and 10, creating nine distinct cavity environments. The variations of P as a function of κ1/γ were then analyzed, as shown in figure 2. In each plot, the black curves represent field 1, and the red curves correspond to field 2.
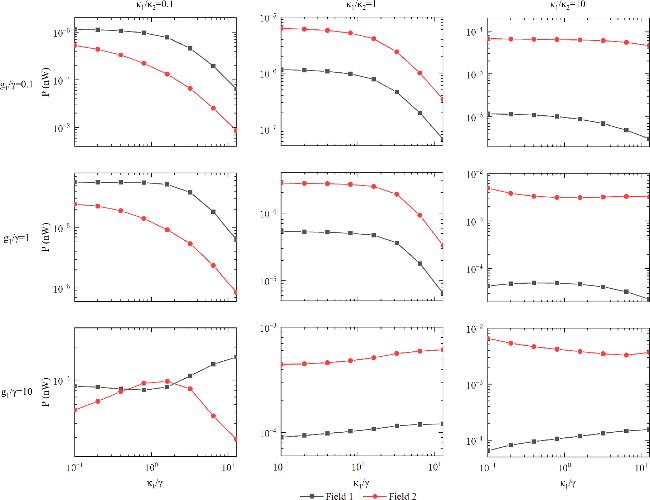
Figure 2. The output powers versus κ1/γ in different environments. The output powers are analyzed as a function of κ1/γ across nine different conditions, where the ratio of the two fields’decay rates κ1/κ2 and the coupling strength g1/γ are set to 0.1, 1, and 10. In the plots, the black line represents field 1, while the red line corresponds to field 2. |
Within all cavity environments, the mean intracavity photon number exhibits a predictable decline with increasing κ1/γ. However, the external output power does not follow a uniform trend. At lower coupling strengths, such as g1/γ = 0.1 and g1/γ = 1, the output power of both fields generally decreases across all three decay rate ratios, with only the κ1/κ2 = 10 case showing an approximately flat trend. When the coupling strength reaches g1/γ = 10, all three decay rate ratios exhibit a region where the output power begins to increase, highlighting that at higher coupling strengths, the increased intracavity photon number initially dominates the output dynamics. This trend continues until the cavity decay rates extract photons faster than the cavity can replenish them, causing the output power to eventually decrease.
A clear demonstration of this transition is observed for g1/γ = 10 and κ1/κ2 = 0.1, where the output power of field 2 first increases and then decreases as κ1/γ increases. This behavior reflects the interplay between the enhanced coupling strength and the cavity decay rates. In contrast, field 1 does not exhibit this trend under the same conditions because the ratio κ1/κ2 is controlled by adjusting κ2. Consequently, the larger decay rate of field 2 (κ2) results in a smaller intracavity photon number for field 2, causing its output power to decrease more rapidly compared to field 1. Furthermore, the output powers of field 1 and field 2 overlap in certain regions. This is because the electric dipole moment of field 1 is approximately 1.5 times larger than that of field 2, allowing field 1 to emit more photons under the same conditions. Despite having a smaller decay rate, field 1 can still achieve the same output power as field 2 in some regions.
For κ1/κ2 = 10, the variation in the output power of field 2 with increasing coupling strength is much less pronounced than in the other two decay rate ratios. This is due to the significantly smaller decay rate of field 2, which limits its impact even under weak-coupling conditions, leading to an almost flat trend for the red curve. Additionally, under this condition, the output power variation of field 1 is also less pronounced than in the other scenarios, indicating that changes in the decay rate of field 2 can indirectly influence field 1 through the system’s intricate interactions.
These findings underscore the complex interplay between cavity environments, atomic transitions, and coupling strengths. This intricate dynamic governs both the internal photon statistics and the external output power, providing critical insights into the system’s behavior under various experimental conditions. Such understanding is crucial for optimizing applications in quantum optics and quantum information science.
3.2. Dynamics of the optical field
The laser fields are characterized by their high temporal coherence, which is quantitatively described by the first-order correlation function G(1)(τ) = ⟨a†(t + τ)a(t)⟩, where τ represents the time delay. This function is commonly used in quantum optics and coherence theory. One of the primary applications of the first-order correlation function is to quantify the coherence time, which indicates the duration over which the phase of the optical wave remains correlated between two different time points.
In our analysis, we calculated the first-order correlation function for field 2 under different values of κ1/κ2, while keeping the coupling strength fixed at g1/γ = 10 and the cavity decay rate κ1/γ = 1. As illustrated in figure 3(a), the results are shown for κ1/κ2 = 10 (black line), κ1/κ2 = 1 (red dashed line), and κ1/κ2 = 0.1 (blue dash-dotted line). Under these conditions, all first-order correlation functions exhibit oscillatory behavior. Notably, the strength of this oscillatory behavior increases as κ1/κ2 decreases. This is because, with the increase in κ2, the number of photons retained in the cavity decreases, making the behavior of the atom absorbing and emitting photons one by one more pronounced.
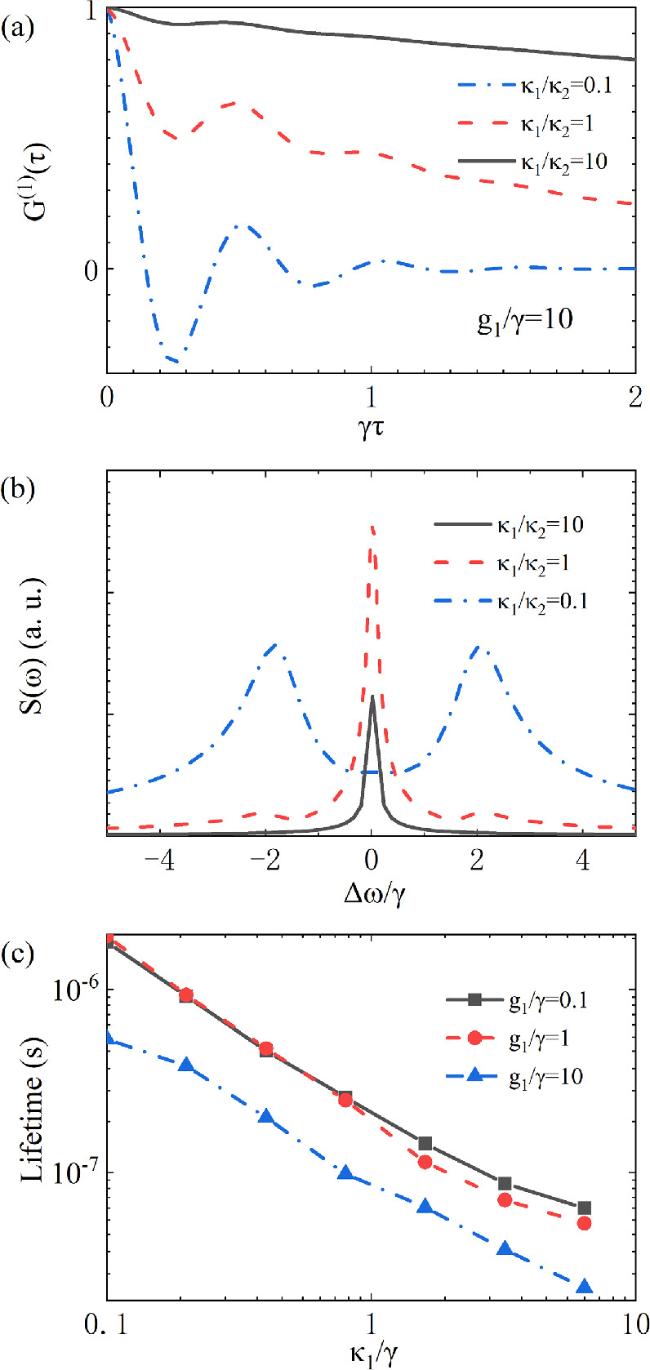
Figure 3. First-order correlations, power spectra, and lifetimes. (a) The first-order correlation function for field 2 under different values of κ1/κ2, with the coupling strength fixed at g1/γ = 10 and the field 1 cavity decay rate κ1/γ = 1. Black line: κ1/κ2 = 10, red dashed line: κ1/κ2 = 1, blue dash-dotted line: κ1/κ2 = 0.1. (b) Normalized spectrum obtained by applying the Fourier transform to the first-order correlation function in (a). (c) Lifetime of field 1 as a function of κ1/γ for different coupling strengths, while keeping κ1/κ2 = 1. Black line: g1/γ = 0.1, red dashed line: g1/γ = 1, blue dash-dotted line: g1/γ = 10. |
By applying the Fourier transform S(ω) = ∫G(1)(τ)e−iωτdτ to the first-order correlation function and normalizing the result, we can obtain the laser spectrum S(ω), as shown in figure 3(b). This transformation reveals that the power spectral characteristics of the light field are intimately connected to its temporal coherence [6]. Specifically, a longer coherence time corresponds to a narrower spectral linewidth, whereas a shorter coherence time results in a broader linewidth.
In classical optics, the spectral density S(ω) typically exhibits a single peak. However, in quantum optics, S(ω) may display more complex structures. For instance, it can show two peaks due to vacuum Rabi splitting [34], or even three peaks as observed in the Mollow triplet phenomenon [35]. Figure 3(b) illustrates the appearance of two spectral peaks under the condition κ1/κ2 = 0.1, whereas only a single peak is observed under the other two conditions. Before normalizing, the area under each curve represents the light intensity, which is directly determined by the photon numbers within the cavity. Since the photon numbers are influenced by the cavity decay rates, variations in these rates impact the relative intensities of the spectral peaks. This behavior underscores the interplay between cavity dynamics and the spectral characteristics of the emitted light.
In figure 3(c), we analyze how the lifetime of field 1 varies with κ1/γ for different coupling strengths, specifically g1/γ = 0.1, g1/γ = 1, and g1/γ = 10, while maintaining κ1/κ2 = 1. At g1/γ = 0.1 and g1/γ = 1, represented by the black and red curves respectively, their lifetimes are almost identical for κ1/γ ≤ 0.8. However, beyond this point, notable differences emerge. This can be attributed to the system operating in the weak-coupling regime when both the coupling strength and cavity decay rate are small. In this regime, the system’s dynamics are primarily governed by the cavity decay rate. Since the coupling strength is relatively small, the photon decay rate from the cavity is not significantly affected by variations in coupling strength, resulting in minimal impact on the system’s lifetime. As the cavity decay rate continues to increase, the decay rate of the cavity field accelerates, shifting the system dynamics toward a regime influenced by both decay and coupling. This transition is particularly evident in the case of g1/γ = 10 (blue dash-dotted line), where the strong coupling strength dominates the system dynamics, causing its lifetime to diverge significantly from the other two cases.
3.3. Nonclassical behaviors of single fields and cross field
The second-order correlation function reveals the intensity-based correlations and provides insights into the probability distribution of time intervals between the detections of two photons. ${G}_{n,n}^{(2)}(0)\lt 1$ indicates that photons tend to arrive one by one at the detectors when the time interval τ = 0, which is a hallmark of nonclassical light. We computed the second-order correlation functions ${G}_{1,1}^{(2)}(0)$ and ${G}_{2,2}^{(2)}(0)$ of the two fields and their cross-correlation ${G}_{1,2}^{(2)}(0)$ under nine distinct scenarios, combining g1/γ > 1, g1/γ = 1, and g1/γ < 1 with κ1/κ2 > 1, κ1/κ2 = 1, and κ1/κ2 < 1. Additionally, we analyzed the violation of the CS inequality through the factor R. When R > 1, the system demonstrates a violation of the inequality, indicating the presence of nonclassical behavior in the cross field.
The blue-shaded region in figure 4 represents the parameter space where both ${G}_{1,1}^{(2)}(0)$ and ${G}_{2,2}^{(2)}(0)$ are less than 1 and R exceeds 1, that is, single-field correlations and their cross field correlation all exhibit nonclassical behaviors (i.e., full nonclassicality). When κ1/κ2 = 0.1, the threshold point for the onset of full nonclassicality does not vary linearly with the coupling strength. Specifically, the threshold points are 0.45, 0.2, and 0.8 for g1/γ = 0.1, g1/γ = 1, and g1/γ = 10, respectively. Notably, the threshold point is smallest for g1/γ = 1, where the violation area is also the largest among all nine cavity configurations. This phenomenon is primarily driven by the behavior of the nonclassical threshold of field 1, ${G}_{1,1}^{(2)}(0)$. Its threshold point decreases initially with increasing coupling strength but then increases, showing a non-monotonic trend. In contrast, ${G}_{2,2}^{(2)}(0)$ and ${G}_{1,2}^{(2)}(0)$ exhibit minimal variations, primarily because the relatively large κ2 reduces the influence of field 2 on the system. This also results in a lower photon number within the cavity, causing field 2 to remain in a nonclassical state throughout. Under these three conditions, the violation factor R reaches values exceeding 13 at κ1/γ = 12.8, and it continues to show an increasing trend.
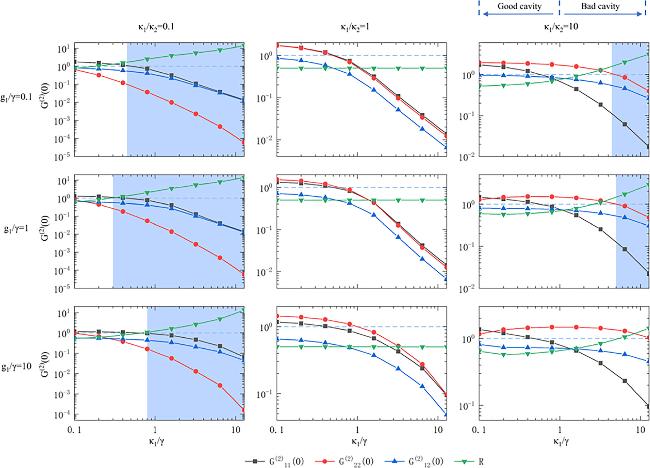
Figure 4. Nonclassical behaviors of the system in nine environments. Second-order correlation functions at τ = 0 of the two fields and their cross field, along with the violation factor R, plotted against κ1/γ under nine cavity environments. These environments include combinations of g1/γ > 1, g1/γ = 1, and g1/γ < 1 with κ1/κ2 > 1, κ1/κ2 = 1, and κ1/κ2 < 1. The black line represents ${G}_{1,1}^{(2)}(0)$, the red line ${G}_{2,2}^{(2)}(0)$, the blue line ${G}_{1,2}^{(2)}(0)$, and the green line represents the violation factor R. |
For κ1/κ2 = 1, in the weak-coupling regime, the system’s properties are more significantly influenced by the decay rates. Therefore, for g1/γ = 0.1 and g1/γ = 1, the values of ${G}_{1,1}^{(2)}(0)$ and ${G}_{2,2}^{(2)}(0)$ show only minor differences as κ1/γ increases. However, when the coupling strength is increased to g1/γ = 10, the difference between them becomes more pronounced, and as the decay rate increases, this difference decreases. Nevertheless, under the three coupling strengths for κ1/κ2 = 1, although both single fields exhibit nonclassical behavior, the cross field does not. This is due to the fact that ${G}_{1,2}^{(2)}(0)$ is much smaller compared to ${G}_{1,1}^{(2)}(0)$ and ${G}_{2,2}^{(2)}(0)$, resulting in the violation coefficient R remaining around 0.5, preventing the realization of nonclassical cross field behavior.
For κ1/κ2 = 10, the influence of field 2 on the system becomes more significant. This is reflected in the fact that the threshold at which ${G}_{2,2}^{(2)}(0)\lt 1$ is much larger than that of ${G}_{1,1}^{(2)}(0)$. Consequently, the threshold for the full nonclassicality is delayed. For g1/γ = 0.1, g1/γ = 1, and g1/γ = 10, these thresholds are 4.5, 5, and 12.8, respectively. Unlike the case of κ1/κ2 = 0.1, where field 1 dominates and the thresholds first decrease and then increase, no such trend is observed here. Additionally, ${G}_{1,2}^{(2)}(0)$ decreases more gradually with increasing κ1/γ compared to the case of κ1/κ2 = 1. This slower decline contributes to an increase in the violation coefficient R, enabling the cross field to exhibit nonclassical behavior. At κ1/γ = 12.8, the violation coefficients reach values of 3.17, 2.9, and 1.42 for g1/γ = 0.1, g1/γ = 1, and g1/γ = 10, respectively.
At a fixed coupling strength, the ratio κ1/κ2 has a more significant impact on ${G}_{2,2}^{(2)}(0)$ compared to ${G}_{1,1}^{(2)}(0)$. Furthermore, at higher coupling strengths, the influence of κ1/κ2 on ${G}_{2,2}^{(2)}(0)$ becomes more pronounced. This behavior reflects the transition of the system’s dominant factors from being governed by the decay rates to being controlled by the coupling strength. Moreover, the enhanced sensitivity of ${G}_{2,2}^{(2)}(0)$ to κ1/κ2 at strong coupling also indicates that field 2’s contribution to the system’s overall dynamics becomes more significant. This effect is particularly evident in the delayed onset of nonclassical behavior in both single and cross-correlation functions, as observed in cases where κ2 is relatively small.
The relationship between γ and κ1 determines whether the field 1 operates in the good- or bad-cavity regime. Traditional lasers are based on the good-cavity regime, where κ1/γ < 1, meaning that the frequency of the output laser is primarily determined by the cavity mode. As a result, it is inevitably affected by thermal noise due to cavity length fluctuations. When environmental noise induces changes in cavity length, the laser frequency correspondingly shifts. In contrast, when κ1/ γ >1 , the laser operates in the bad-cavity regime, where the output frequency becomes less sensitive to the cavity length and can serve directly as an optical frequency reference. Active optical clocks are a typical application of bad-cavity lasers [36–38]. As shown in figure 4, the region that fully satisfies the nonclassical condition predominantly operates in the bad-cavity regime. Notably, under the condition κ1/κ2 = 10, the entire blue region corresponds to bad-cavity operation.
It is worth noting that adding laser fields, such as cooling light (typically at 852 nm for the D2 line of cesium) and repumping light (often near 894 nm for the D1 line), may influence the generation of nonclassical photon pairs. In particular, strong resonant or near-resonant optical fields may induce additional excitations or background fluorescence, which may degrade the purity of the generated photon pairs or even introduce classical noise. Furthermore, these fields might disturb the population distribution and coherence between the relevant atomic levels, thus affecting the effective coupling between the atom and the cavity modes.
In contrast to cold atom systems, thermal atomic ensembles can also serve as platforms for nonclassical photon pair generation under specific conditions. While thermal atoms generally exhibit lower coherence due to Doppler broadening and lack of spatial localization, nonclassical correlations have still been observed in certain configurations, such as spontaneous four-wave mixing (SFWM) or cavity-enhanced Raman processes. However, achieving strong quantum correlations and high coherence in thermal systems typically requires precise phase-matching control and effective suppression of background thermal noise.
Now, let us consider the τ ≠ 0 case. The second-order correlation function quantifies the intensity correlation of a light field between two times t and t + τ. By analyzing its time dependence, we can determine the characteristic duration over which photon intensity correlations remain significant. In cavity QED systems, ${G}_{n,n}^{(2)}(\tau )$ often exhibits oscillatory behaviors with its frequency and amplitude determined by the coupling strength between the cavity and the atom.
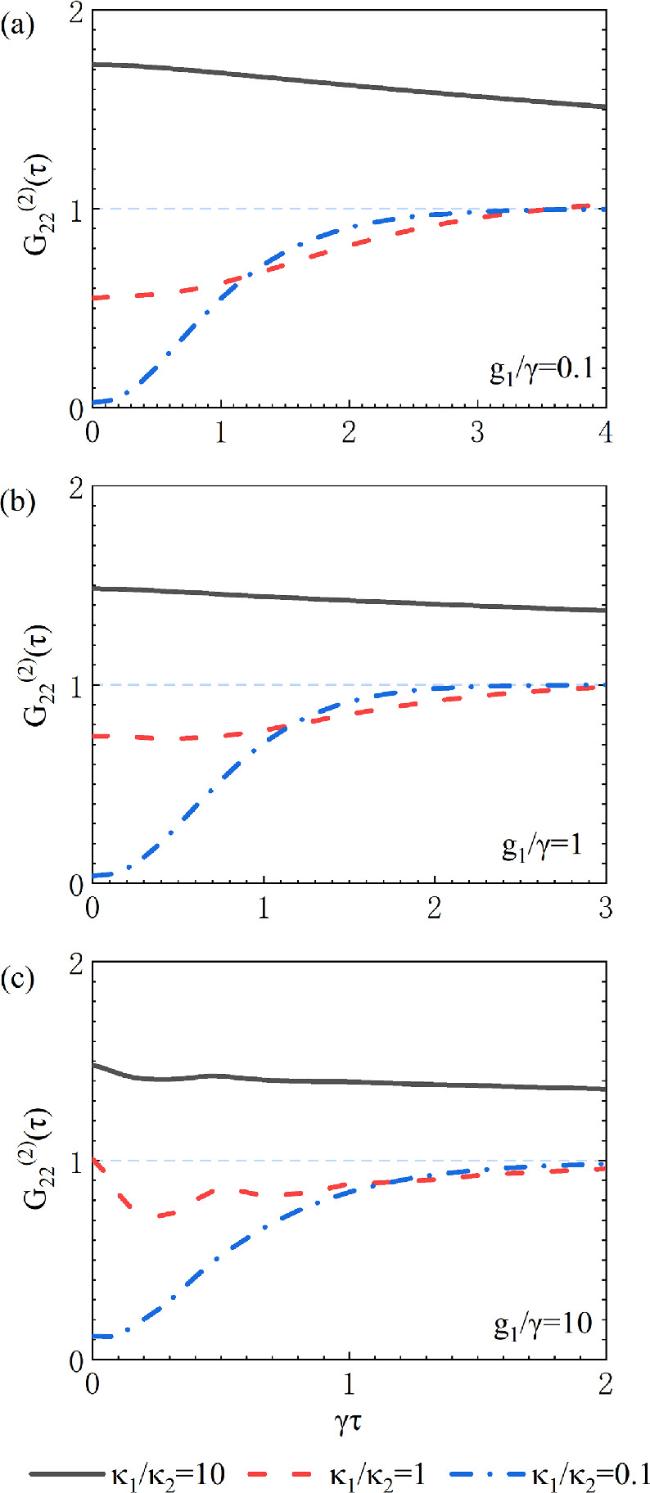
To further investigate this, we calculated ${G}_{2,2}^{(2)}(\tau )$ under three different coupling strengths: g1/γ = 0.1, g1/γ = 1, and g1/γ = 10, for varying cavity decay rate ratios: κ1/κ2 = 0.1, κ1/κ2 = 1, and κ1/κ2 = 10, while keeping κ1/γ = 1 fixed. The focus on field 2, rather than field 1, arises from the fact that in this study, variations in κ1/κ2 are achieved by modifying the decay rate of field 2.
As shown in figure 5, the black solid line represents κ1/κ2 = 10, the red dashed line represents κ1/κ2 = 1, and the blue dash-dotted line represents κ1/κ2 = 0.1. Under the three coupling strengths, field 2 exhibits anti-bunching behavior for κ1/κ2 = 1 and κ1/κ2 = 0.1, characterized by ${G}_{n,n}^{(2)}(0)\lt {G}_{n,n}^{(2)}(\tau \gt 0)$, which indicates a reduced probability of simultaneous photon detection at τ = 0. As τ increases, ${G}_{n,n}^{(2)}(\tau )$ typically approaches a value of 1, signifying the absence of correlations at long time scales. This behavior exemplifies the nonclassical nature of the light field and is crucial for identifying nonclassical effects, distinguishing quantum light from classical sources.
Figure 5. The second-order correlation function of field 2. The second-order correlation function ${G}_{2,2}^{(2)}(\tau )$ of field 2 under g1/γ = 0.1, g1/γ = 1, and g1/γ = 10 with κ1/κ2 = 0.1, κ1/κ2 = 1, and κ1/κ2 = 10, while keeping κ1/γ = 1 fixed. (a) g1/γ = 0.1, (b) g1/γ = 1, (c) g1/γ = 10. The black solid line represents κ1/κ2 = 10, the red dashed line represents κ1/κ2 = 1, and the blue dash-dotted line represents κ1/κ2 = 0.1. |
For κ1/κ2 = 10, ${G}_{2,2}^{(2)}(\tau )$ remains above 1 across all coupling strengths. This is because the relatively small κ2 allows photons to reside in the cavity longer, increasing the photon number within the cavity. Consequently, the field tends toward a quasi-coherence, characterized by photon bunching behavior (${G}_{2,2}^{(2)}(\tau )\gt 1$).
As the coupling strength increases, the oscillatory behavior of ${G}_{2,2}^{(2)}(\tau )$ becomes more pronounced, which signifies enhanced photon absorption and emission by the atom. This effect highlights the strengthening of the atom-field interactions with increasing coupling strength.
4. Conclusion
In summary, we have theoretically investigated the cavity quantum electrodynamics (QED) system of one- 133Cs atom coupled to a resonant cavity. By using 459 nm laser pumping, these transitions, 7S1/2 → 6P3/2 (1470 nm) and 7S1/2 → 6P1/2 (1359 nm), were efficiently driven within the cavity, allowing detailed exploration of the field’s statistical and dynamical properties. The atomic transitions of output lights considered are directly associated with the clock transitions of the cesium active optical clock.
We systematically studied the nonclassical behaviors of fields in this system under nine distinct regimes defined by combinations of coupling strengths (g > γ, g = γ, and g < γ) and cavity decay rate ratios (κ1 > κ2, κ1 = κ2, and κ1 < κ2). Through detailed analyses, we obtained the output powers, first-order correlation functions, power spectral densities, linewidths, and the variation of second-order correlation functions of individual and cross fields as a function of decay rates.
The first-order correlation function exhibited pronounced oscillatory behaviors under specific conditions. For instance, with g1/γ = 10, field 2 demonstrated the strongest oscillations when κ1/κ2 = 0.1, corresponding to the emergence of Rabi splitting in the power spectral density. Additionally, by calculating the second-order correlation functions of individual and cross fields and the CS violation coefficient R, we identified parameter regions where both individual fields and the cross field exhibit nonclassical behavior. Specifically, for κ1/κ2 = 0.1 and g1/γ = 1, the violation coefficient R achieved 13.9 at κ1/γ = 12.8, indicating the strong nonclassicality in the cross field.
This study, focused on one 133Cs atom in a cavity pumped by 459 nm light, investigated fields associated with transitions matching the clock states of an active cesium optical clock. We identified the regions where both individual fields and their cross field achieve nonclassicality. The resulting nonclassical photon pairs have potential applications in photonic quantum memories, quantum computing, and quantum teleportation, advancing the exploration of quantum technologies.