


1. Introduction
Accurate description of nuclear charge radii derived from charge density distributions plays an important role in theoretical studies. It is generally mentioned that the fine structure of nuclear size can encode the information about the shape-phase transition [1–9], halo structure [10, 11], and the emergence of magic numbers [12, 13], etc. Moreover, recent studies suggest that charge radii of mirror partner nuclei can provide an alternative access to probe the equation of state of isospin asymmetric nuclear matter [14–24]. With the advent of radioactive beam facilities, more data about charge radii are accumulated over the past decades [25, 26]. Thus this challenges us to recognize the fine structure of atomic nuclei with high-precision charge radii data in nuclear models.
The global features of nuclear charge radii can be generally described by the A1/3 or Z1/3 law [27, 28], with A and Z the mass and proton numbers. However, these empirical formulae are not valid anymore for nuclei with larger neutron to proton ratios. In addition, it is difficult to inspect the microscopic implications, e.g. the proton and neutron density distributions. The same scenarios can also be encountered in the Bayesian neural networks [29, 30], in which the microscopic aspects cannot be completely captured and the extrapolating ability is restricted due to the limited databases. Along a long isotopic chain, the evolution of nuclear charge radii has performed regularity and irregularity behaviors [31, 32]. Especially in calcium isotopes, the inverted parabolic-like shape and strong odd–even oscillations in charge radii can be apparently observed between 40Ca and 48Ca isotopes [25]. Furthermore, such peculiar feature of the strong odd–even oscillations in charge radii persists toward the neutron-deficient region [33]. It should be also mentioned that the values of charge radii for 40Ca (3.4776 fm) and 48Ca (3.4777 fm) isotopes are almost equivalent, and the shell quenching effect in charge radii has been observed at the neutron number N = 28 but not at N = 20. Across the 48Ca isotope, the rapid increase of charge radii is performed until to 52Ca. The values of charge radii for 44Ca (3.5188 fm) and 50Ca (3.5192 fm) are almost identical [25, 26]. For 52Ca, as a candidate of doubly magic nuclei [34–37], the shell closure effect of the charge radii cannot be expected naturally [38]. These particular features can provide insights into the fundamental interactions in theoretical researches.
Plenty of methods have been undertaken to elucidate the global trend of charge radii tentatively along calcium isotopes. Ab initio calculations with chiral effective field theory interactions, such as NNLOsat [39] with SRG1 and SRG2 interactions [40], cannot reproduce the discontinuous changes of the charge radii along calcium isotopes well [38]. The major classes of covariant energy density functionals (CEDFs) have made greatly success in describing the ground state properties of finite nuclei over the whole periotic table [41–47]. However, the description and explanation for some fine structures, such as the odd–even staggering (OES) of charge radii in calcium isotopes, are still not adequate yet. As shown in [48], the effect of short-range correlations should be considered properly in describing the charge radii and the depletion of the nuclear Fermi surface. Miller, et al further point out that neutron–proton short-range correlations can have an influence on determining the nuclear charge radius [49]. The short-range correlation between neutrons and protons implies the fluctuation of the fractional occupation probabilities for the states around Fermi surface [50]. This suggests that the appropriate isospin-dependence interactions should be taken into account properly in describing the nuclear size [51].
The neutron–proton correlations derived from the Casten factor can reproduce the shell quenching phenomena in nuclear charge radii as well [52–54]. In this method, the isospin-dependence interactions deduced from the valence neutrons and protons can actually improve the predicted validity of nuclear charge radii in the calibrated protocol [29, 30, 55]. A similar approach can also be shown in [56] where the correlation between the neutron and proton pairs around Fermi surface has been added into the root-mean-square (rms) charge radii formula. This modified expression can reproduce the trend of changes of nuclear charge radii and OES well [57, 58]. In the Fayans energy density functional model, the discontinuous behavior of charge radii in calcium isotopes can be described well [33]. These local variations are attributed to the additional gradient terms in its pairing part [59]. Shown in [60] that the abnormal changes of charge radii in the calcium isotopes can be described well in the shell model calculations by considering the proton excitation from the sd shell to the pf shell. A recent study has analyzed the radial and orbital contributions in reproducing the charge radii of calcium isotopes [61]. Meanwhile, it points out that charge radii in the whole region 36−48Ca cannot be reproduced perfectly through energy density functionals (EDFs). In order to inspect the anomalous behaviors in charge radii of calcium isotopes, further research should be performed at the relativistic mean-field level.
In this work, we focus on the underlying mechanisms of such enhancement OES and the inverted parabolic-like shape in charge radii of calcium isotopes through mean-field framework. To facilitate the underlying mechanism of OES in nuclear size, the constraint calculations on the rms charge radii are performed along calcium isotopes. The binding energies and two-neutron separation energies obtained by the radius constraint method are also examined. Moreover, the rather strong isospin dependence of effective potential is also shown. We further review the evolution of the neutron and proton Fermi energies with the increasing neutron numbers. The inverse odd–even oscillations of proton Fermi energies are shown against the OES in the charge radii of calcium isotopes.
The structure of the paper is organized as follows. Section 2 is devoted to presenting the theoretical framework briefly. In section 3 , the numerical results and discussion are provided. Finally, a summary and outlook is given in section 4 .
2. Theoretical framework
The CEDFs have been widely used to investigate various physical phenomena, such as halo structure [62–66], pseudospin symmetry [67–69], hypernuclei [70], resonant states [71, 72], collective excited states [73–76], location of dripline [77–79], nuclear fission [80, 81], low-lying states [82], and neutron drops [83], nuclear weak decay [84, 85], etc. In this work, the nonlinear self-coupling Lagrangian density is employed [86], where the constituent nucleons are described as Dirac particles which interact via the exchange of σ, ω and ρ mesons. The electromagnetic field is ruled by the exchange of photons. The effective Lagrangian density has been recalled as follows,
$\begin{eqnarray}\begin{array}{rcl}{ \mathcal L } & = & \bar{\psi }[i{\gamma }^{\mu }{{\rm{\partial }}}_{\mu }-M-{g}_{\sigma }\sigma -{\gamma }^{\mu }({g}_{\omega }{\omega }_{\mu }+{g}_{\rho }\overrightarrow{\tau }\cdot {\overrightarrow{\rho }}_{\mu }\\ & & +\,{\rm{e}}\frac{1-{\tau }_{3}}{2}{{\boldsymbol{A}}}_{\mu })]\psi \\ & & +\frac{1}{2}{{\rm{\partial }}}^{\mu }\sigma {{\rm{\partial }}}_{\mu }\sigma -\frac{1}{2}{m}_{\sigma }^{2}{\sigma }^{2}-\frac{1}{3}{g}_{2}{\sigma }^{3}-\frac{1}{4}{g}_{3}{\sigma }^{4}\\ & & -\frac{1}{4}{{\boldsymbol{\Omega }}}^{\mu \nu }{{\boldsymbol{\Omega }}}_{\mu \nu }+\frac{1}{2}{m}_{\omega }^{2}{\omega }_{\mu }{\omega }^{\mu }+\frac{1}{4}{c}_{3}{({\omega }^{\mu }{\omega }_{\mu })}^{2}\\ & & -\frac{1}{4}{\vec{{\boldsymbol{R}}}}_{\mu \nu }\cdot {\vec{{\boldsymbol{R}}}}^{\mu \nu }+\frac{1}{2}{m}_{\rho }^{2}{\overrightarrow{\rho }}^{\mu }\cdot {\overrightarrow{\rho }}_{\mu }+\frac{1}{4}{d}_{3}{({\overrightarrow{\rho }}^{\mu }{\overrightarrow{\rho }}_{\mu })}^{2}\\ & & -\frac{1}{4}{{\boldsymbol{F}}}^{\mu \nu }{{\boldsymbol{F}}}_{\mu \nu },\end{array}\end{eqnarray}$
where M is the mass of nucleon and mσ, mω, and mρ, are the masses of the σ, ω and ρ mesons, respectively. Here, gσ, gω, gρ, g2, g3, c3 and d3 are the coupling constants for σ, ω and ρ mesons, respectively, while e2/4π = 1/137 is the fine structure constant. The field tensors for the vector mesons and photon fields are defined as Ωμν = ∂μων − ∂νωμ, ${\overrightarrow{{\boldsymbol{R}}}}_{\mu \nu }={\partial }_{\mu }{\overrightarrow{\rho }}_{\nu }-{\partial }_{\nu }{\overrightarrow{\rho }}_{\mu }-{g}_{\rho }({\overrightarrow{\rho }}_{\mu }\times {\overrightarrow{\rho }}_{\nu })$ and Fμν = ∂μAν − ∂νAμ.The Hamiltonian derived from the variational principle can be expressed as follows,
$\begin{eqnarray}\hat{{ \mathcal H }}={\boldsymbol{\alpha }}\cdot {\boldsymbol{p}}+V({\boldsymbol{r}})+\beta [M+S({\boldsymbol{r}})],\end{eqnarray}$
where S(r) and V(r) represent the effective fields [86]. The bulk properties of finite nuclei are calculated by the effective forces NL3 [87] and PK1 [88].As mentioned above, the discontinuous behavior of charge radii along calcium isotopes cannot be reproduced well by the relativistic mean-field calculations. To further explore the microscopic mechanism in reproducing the abnormal behaviors in the charge radii of calcium isotopes, a radius constraint calculation is performed in this work. Therefore, the Hamiltonian can be rewritten as the following expression,
$\begin{eqnarray}\hat{{{ \mathcal H }}^{{\prime} }}=\hat{{ \mathcal H }}-\lambda \langle {R}_{{\rm{ch}}}\rangle ,\end{eqnarray}$
where λ is the spring constant. The quantity of ⟨Rch⟩ can be calculated through (in units of fm2) $\begin{eqnarray}{R}_{{\rm{ch}}}^{2}=\langle {r}_{{\rm{p}}}^{2}\rangle +0.64\,{{\rm{fm}}}^{2}.\end{eqnarray}$
The first term represents the charge density distributions of point-like protons and the second one is that due to the finite size effect of protons [89]. The accuracy of the convergence is determined by the self-consistent iteration in binding energy, which is lower than 10−6 MeV.3. Results and discussion
At the mean-field level, the bulk properties of finite nuclei can be described well [90, 91]. However, for charge radii of calcium isotopes, the abnormal behaviors cannot be reproduced well, especially in relativistic mean-field model [41–44]. This is attributed to the underlying mechanism which is not clear to comprehend these anomalous behaviors in nuclear charge radii. In this work, the global trend of nuclear charge radii along calcium isotopic chain is discussed by radius constraint calculation. The pairing correlations can be treated by solving the state-dependent Bardeen–Cooper–Schrieffer (BCS) equations which can describe the ground state properties of finite nuclei well [41]. The pairing strength is chosen to be V0 = 350 MeV fm3 for NL3 force, but V0 = 380 MeV fm3 for PK1 parametrization set. The calculated results show that the quadrupole deformation of calcium isotopes cannot be changed with and without considering radius constraint, namely keep almost spherical shape.
As shown in table 1, charge radii and binding energies of calcium isotopes are listed before and after the constrained calculations, respectively. Here, one should be mentioned that binding energies are slightly changed for the results obtained by the NL3 and PK1 effective forces. For the 44Ca isotope, the binding energies obtained by radius constraint method have been reduced less than 0.1% for NL3 set and about 0.2% for PK1 set. After making the constrained calculations, the binding energies for 40−48Ca isotopes are in closer agreement with the experimental data. However, the obvious deviations can be encountered in the charge radii. Such as the case in 44Ca isotope, the charge radius obtained by the NL3 effective force has been increased about 1%, but about 2% for the PK1 force. This difference attributes to the fact that the charge radii obtained by the PK1 set are systematically underestimated with respect to the results obtained by NL3 set if the radius constraint approach cannot be employed [56]. Especially the effective force NL3 can almost reproduce the charge radii of 40Ca (3.4692 fm) and 48Ca (3.4711 fm) isotopes, but apparent discrepancy occurs for PK1 set, namely 3.4445 fm for 40Ca and 3.4542 fm for 48Ca. Furthermore, these results suggest that charge radii are more sensitive quantities in the calibrated protocol. This seems to provide a guideline to the artificial neural networks in learning experimental data. Recent studies suggest that the structure of the input data can also influence the predicted quantities in the artificial neural networks [92, 93]. Meanwhile, it is worthwhile to mention that the nucleon’s intrinsic electromagnetic structure plays an indispensable role in reproducing the charge radii of finite nuclei [94].
Table 1. Charge radii (Rch) and binding energies (BE) of calcium isotopes obtained by the approaches with and without considering the charge radius constraint calculations are listed for NL3 and PK1 effective interactions, respectively. The experimental data for charge radii [25, 26] and binding energy [95] are also shown for comparison. |
| Rch (fm) | BE (MeV) | |||||||||
|---|---|---|---|---|---|---|---|---|---|---|
| N | NL3 | PK1 | NL3 | PK1 | Exp. | NL3 | PK1 | NL3 | PK1 | Exp. |
| Without | With | Without | With | |||||||
| 16 | 3.4596 | 3.4463 | 3.4493 | 3.4493 | 3.4493 | 279.44 | 280.15 | 279.43 | 280.15 | 281.37 |
| 17 | 3.4595 | 3.4428 | 3.4480 | 3.4480 | 3.4480 | 294.72 | 295.05 | 294.71 | 295.04 | 296.13 |
| 18 | 3.4624 | 3.4430 | 3.4661 | 3.4661 | 3.4661 | 311.11 | 312.41 | 311.11 | 312.32 | 313.12 |
| 19 | 3.4650 | 3.4431 | 3.4595 | 3.4595 | 3.4595 | 325.96 | 326.90 | 325.96 | 326.79 | 326.42 |
| 20 | 3.4692 | 3.4445 | 3.4776 | 3.4776 | 3.4776 | 341.91 | 342.79 | 341.90 | 342.62 | 342.05 |
| 21 | 3.4678 | 3.4438 | 3.4780 | 3.4780 | 3.4780 | 350.66 | 351.56 | 350.56 | 351.18 | 350.42 |
| 22 | 3.4663 | 3.4434 | 3.5081 | 3.5081 | 3.5081 | 361.32 | 363.04 | 361.03 | 362.33 | 361.90 |
| 23 | 3.4659 | 3.4438 | 3.4954 | 3.4954 | 3.4954 | 369.66 | 371.12 | 369.83 | 370.67 | 369.83 |
| 24 | 3.4661 | 3.4454 | 3.5179 | 3.5179 | 3.5179 | 379.98 | 381.87 | 380.09 | 380.90 | 380.96 |
| 25 | 3.4667 | 3.4468 | 3.4944 | 3.4944 | 3.4944 | 387.96 | 389.36 | 388.10 | 388.91 | 388.37 |
| 26 | 3.4678 | 3.4494 | 3.4953 | 3.4953 | 3.4953 | 397.88 | 399.40 | 398.18 | 398.97 | 398.77 |
| 27 | 3.4703 | 3.4522 | 3.4783 | 3.4783 | 3.4783 | 405.69 | 406.36 | 405.68 | 406.23 | 406.05 |
| 28 | 3.4711 | 3.4542 | 3.4771 | 3.4771 | 3.4771 | 415.07 | 415.63 | 415.06 | 415.53 | 416.00 |
| 29 | 3.4810 | 3.4640 | 3.4917 | 3.4917 | 3.4917 | 419.78 | 419.91 | 419.76 | 419.76 | 421.15 |
| 30 | 3.4912 | 3.4766 | 3.5186 | 3.5186 | 3.5186 | 425.33 | 425.53 | 425.34 | 425.20 | 427.51 |
| 31 | 3.5023 | 3.4870 | 3.5335 | 3.5335 | 3.5335 | 428.77 | 428.61 | 428.70 | 428.21 | 432.32 |
| 32 | 3.5082 | 3.4998 | 3.5531 | 3.5531 | 3.5531 | 435.18 | 434.66 | 434.94 | 434.16 | 438.33 |
The odd–even staggering behaviors in charge radii and nuclear masses are generally observed throughout the whole nuclide chart [25, 26, 95]. To facilitate the local variations of nuclear charge radii and binding energies, the three-point formula is recalled as follows,
$\begin{eqnarray}{{\rm{\Delta }}}_{{ \mathcal Y }}(N,Z)=\frac{1}{2}[2{ \mathcal Y }(N,Z)-{ \mathcal Y }(N-1,Z)-{ \mathcal Y }(N+1,Z)],\end{eqnarray}$
where ${ \mathcal Y }(N,Z)$ represents the specific physical quantity of a nucleus with neutron number N and proton number Z.The OES of binding energies calculated by equation (5 ) are shown in figures 1(a) and (c) with the effective forces NL3 and PK1, respectively. Here one can find that the OES in the evaluated nuclear mass agrees with the experimental data very well. With and without considering the constraint on rms charge radii, the OES of binding energies obtained by both methods can give almost similar trend. In addition, one can find that the amplitudes of OES in binding energies are enlarged at the neutron numbers N = 20 and N = 28 with respect to the neighboring counterparts. This emerged signature in the empirical mass gap could be generally used to identify the magic numbers [95].
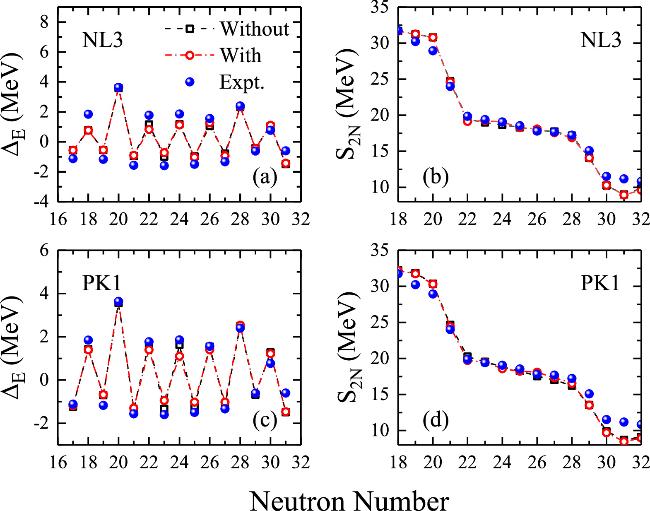
Figure 1. Odd–even staggering of binding energies and two-neutron separation energies of calcium isotopes as a function of neutron numbers are depicted by both NL3 (a), (b) and PK1 (c), (d) effective forces. The corresponding experimental data are taken from [95]. |
In figures 1(b) and (d), two-neutron separation energies of calcium isotopes are plotted as a function of neutron numbers with effective forces NL3 and PK1. The similar trend can be found with both of the effective forces NL3 and PK1, especially the sharp decreases of the two-neutron separation energies can also be reproduced well at the neutron numbers N = 20 and N = 28. As shown in figures 1(a) and (c), the enlarged OES in binding energies results from the strong shell closure. However, the odd–even oscillation amplitudes of charge radii are weakened at the N = 20 and N = 28 shell closure [56, 58]. As demonstrated in [57], this weakening OES behavior in nuclear charge radii can be observed generally at the fully filled shells. This may provide a signature to feature the magicity of a nucleus from the aspect of nuclear size. As a candidate of doubly magic nuclei, the unexpectedly larger charge radius has been observed in 52Ca [38]. Thus the charge radius of 53Ca isotope is urgently required. The latest study suggests that the abrupt increase of nuclear charge radii along Sc isotopic chain can be observed notably across neutron number N = 20 [96], but this phenomenon is absent in the neighboring Ca isotopes.
As demonstrated in [56], the local variations of charge radii along Ca isotopes cannot be reproduced well under the relativistic mean-field model with equation (4 ). Actually, before the constrained calculations, the results obtained by the NL3 and PK1 effective forces give the underestimated OES amplitudes. Based on the radius constraint calculations, the calculated results can cover the experimental charge radii. Thus the OES behavior of charge radii between the neutron numbers N = 20 and N = 28 are naturally predicted.
The range of proton and neutron matter distributions is related to the disparity of the Fermi energies between protons and neutrons in mean-field calculations [97]. In addition, charge radii can be influenced by the nuclear Fermi surface as well [48, 98]. Therefore, it is instructive to present the neutron (ϵFn) and proton (ϵFp) Fermi energies along calcium isotopes in figure 2. It is mentioned that the neutron Fermi energies obtained by effective forces NL3 and PK1 are almost not changed with the radius constraint calculations. For proton Fermi energies, the apparent divergence occurs between the fully filled N = 20 and N = 28 shells. Beyond N = 29, this divergence is also present. Meanwhile, it is notably mentioned that the trend of changes of charge radii is significantly influenced by the isospin-dependence interactions [99, 100]. This seems to suggest that the abnormal change in the charge radii can be reflected from the associated isospin-dependence interactions.
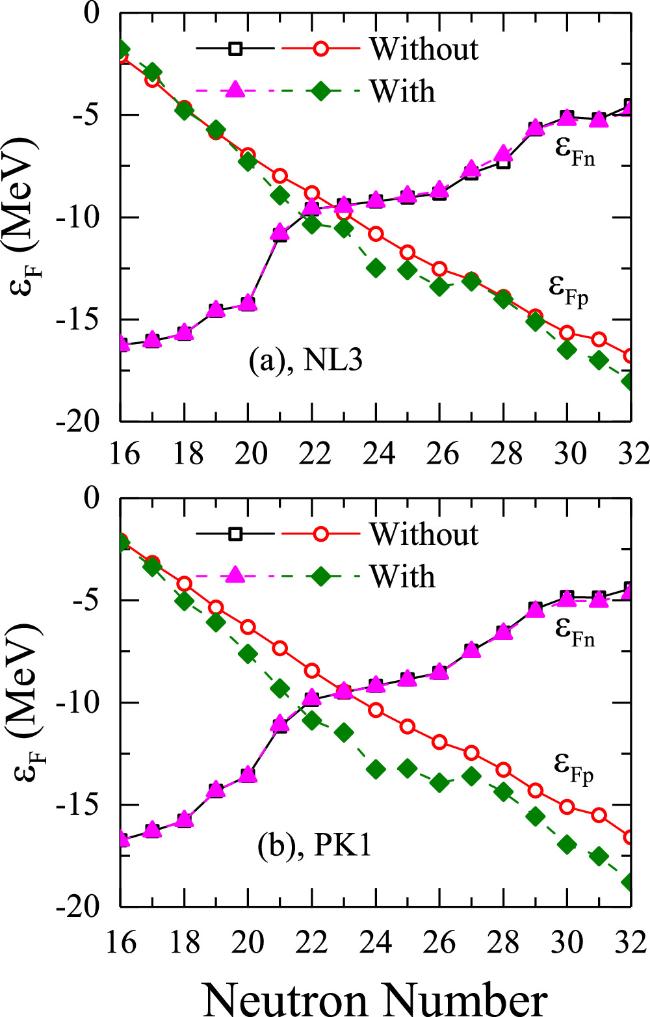
Figure 2. Fermi energies of neutrons (ϵFn) and protons (ϵFp) of calcium isotopes with and without making constraint on the rms charge radius are depicted as a function of neutron numbers through effective forces NL3 (a) and PK1 (b). |
In figures 3(a) and (c), the proton density distributions ρp(r) of 44Ca are shown with effective forces NL3 and PK1. The constrained results give the relatively larger density distributions in the outer edge (r > 6 fm). This suggests that the corresponding central density is reduced. Shown in [49], it points out that the short-range neutron–proton correlation causes the increasing charge radius, namely exists more strong isospin-dependence interactions. Under the relativistic mean-field model, the ρ meson is employed to describe the isospin asymmetry degrees. In figures 3(b) and (d), the equivalent meson field gρρ(r) in 44Ca are also presented. It shows that the constrained calculations give more bound isospin-dependence interactions, namely rather strong isospin couplings. As demonstrated in [99], the entire isospin dependence of the spin–orbit field is rather small in relativistic calculations. Therefore, the isospin-dependence components in effective nuclear potentials should be considered appropriately.
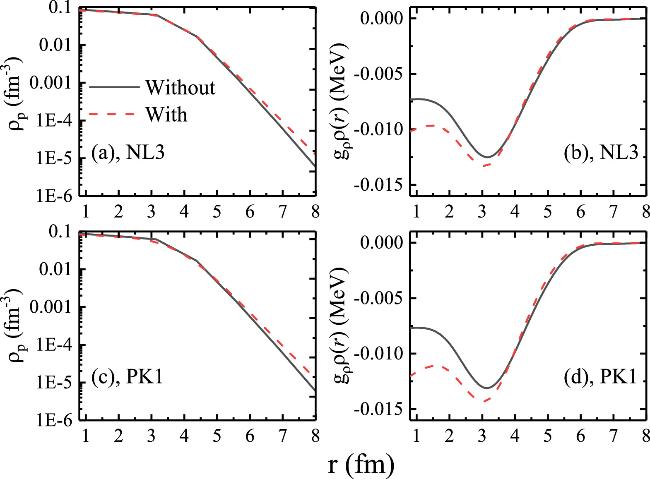
Figure 3. Proton density ρp and equivalent ρ meson field gρρ(r) in 44Ca are depicted by the effective forces NL3 (a), (b) and PK1 (c), (d). |
Actually, a strong coupling between neutron- and proton-pairing correlations leads to the anomalous behaviors in nuclear charge radii [101]. Furthermore, recent studies suggest that α-cluster structure has been performed in light or medium mass nuclei [102–106]. This means the more strong isospin-dependence interactions deriving from the neutron and proton pairs condensation should be taken into account in describing the fine structures of finite nuclei size. Along calcium isotopic chain, the OES behavior in charge radii can be evidently observed [25, 26]. As shown in figure 2, these anomalous behaviors may be reflected from the changes of the proton Fermi surface.
With the increasing neutron numbers, the gradually deep proton single-particle levels are obtained along a long isotopic chain due to the strong isospin-dependence interactions [107, 108]. As encountered in proton Fermi energy, the constraint calculation makes the proton single-particle levels more bound. For 44Ca, the constraining result obtained by NL3 force gives the proton single-particle energy −14.54 MeV for 2s1/2 level and −14.98 MeV for 1d3/2 level. For results without making constraint, the proton single-particle energies are −12.65 MeV and −13.48 MeV for the corresponding 2s1/2 and 1d3/2 levels, respectively. However, the neutron single-particle levels are almost unchanged before and after the constrained calculations. The same scenario can also be encountered in the PK1 parameter set, namely the constrained approach gives deeper proton single-particle levels. Meanwhile, before and after making the charge radius constraint calculations, the proton and neutron occupation probabilities are almost unchanged for these NL3 and PK1 effective forces. As shown in figure 2, the proton Fermi energies are decreased with the increasing isospin asymmetry. The constrained results reproduce the enlarged rms charge radius between 40Ca and 48Ca. Meanwhile, the corresponding proton Fermi energies become lower in comparison to the cases without making constraint. This may suggest that the isospin-dependence interactions in the mean-field model cannot be captured adequately yet.
As shown in table 1, the binding energies of calcium isotopes are also changed by using the charge radius constraint approach. Large deviations of the proton Fermi energies can be observed apparently between the approaches with and without considering the constrained calculations. For 43Ca, the proton Fermi energy obtained by the charge radius constraint approach with PK1 set is −11.47 MeV, but the result obtained without constraining the charge radius is −9.45 MeV. For NL3 set, before and after the constrained calculations, the corresponding proton Fermi energies are −9.80 MeV and −10.53 MeV, respectively. The same scenario can also be encountered in 44Ca where the constrained calculation gives the proton Fermi energy is −13.27 MeV for the PK1 set and −12.48 MeV for the NL3 set. By contrast, the results obtained without constraining the charge radius give the values of −10.37 MeV for the PK1 set and −10.82 MeV for NL3 set.
Before and after the constrained calculations, the apparent differences can be found in the binding energies, charge radii, proton density distributions, and the proton Fermi surface, etc. Furthermore, it is necessary to analyze in detail the changes of the binding energy, neutron and proton Fermi surface, shape deformation, neutron and proton single-particle levels, and the corresponding occupation probabilities with respect to the constrained charge radii. As shown in figure 4, the binding energies, Fermi energies ϵF, neutron single-particle levels, and proton single-particle levels of 44Ca isotope are depicted as a function of the constrained charge radius with effective force PK1. From this figure, one can find that the binding energy of 44Ca is smoothly decreased with the increasing values of the constrained charge radii. Meanwhile, as shown in figures 4(b) and (c), the neutron Fermi energy ϵFn and neutron single-particle levels (SPLs) are almost not changed with the increasing values of the constrained charge radii. By contrast, as shown in figures 4(b) and (d), the proton Fermi energy ϵFp and proton SPLs are almost linearly decreased with respect to the target charge radius of the constrained calculations. With the increasing charge radii, the corresponding occupation probabilities are almost not changed. In addition, the absolute values of the deformation parameters β20 are less than 0.0005. This means the nucleus 44Ca is almost spherical shape with the increasing charge radii. That is why the spherical quantum numbers are used to remark the evolution of the neutron and proton single-particle levels in figure 4, respectively.
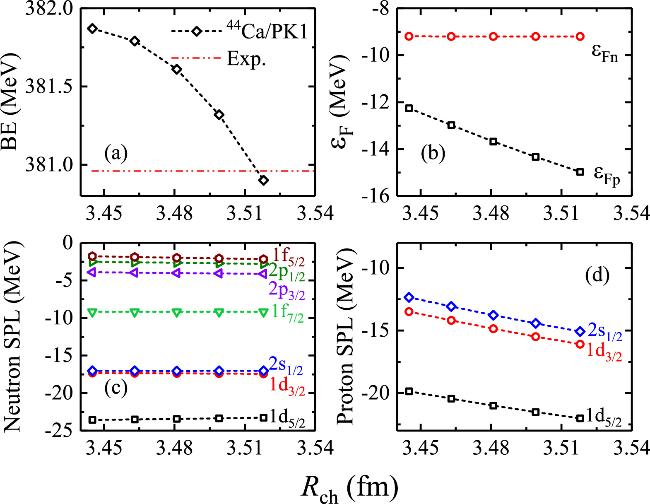
Figure 4. The binding energies (a), Fermi energies ϵF (b), neutron single-particle levels (c), and proton single-particle levels (d) of 44Ca isotope are depicted as a function of the constrained charge radius with effective force PK1. The experimental binding energy of 44Ca isotope is taken from [95]. |
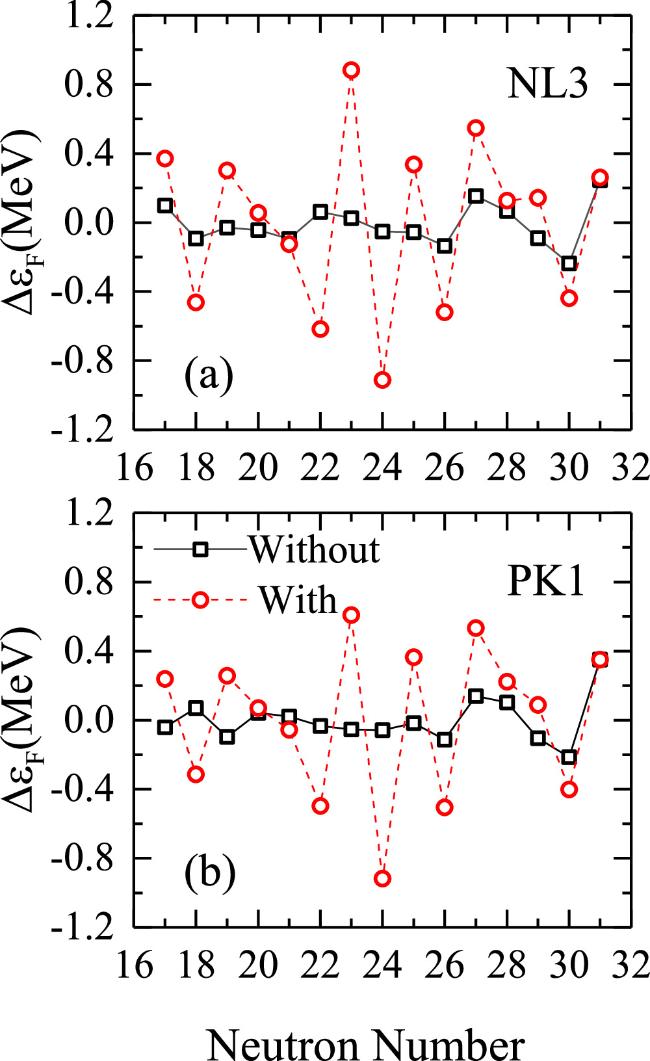
In order to inspect these local variations of the proton Fermi energy, equation (5 ) is still employed to facilitate these discontinuous behaviors. In figure 5, the values of ΔϵF derived from the proton Fermi energies of 36−52Ca isotopes are depicted with NL3 and PK1 forces, respectively. The OES pattern of the proton Fermi energies is significantly observed along the calcium isotopes after the charge radius constraint is imposed. As shown in figure 5, we can find that the proton Fermi energies represent the inverse odd–even oscillations in comparison with the corresponding binding energies and charge radii. It should be mentioned that the OES behaviors of the proton Fermi energies are weakened at the neutron numbers N = 20 and 28 under the NL3 effective force. The same scenario can be encountered in the PK1 set as well. The emergence of neutron magic numbers can be revealed through the systematic evolution of nuclear charge radii along a long isotopic family [56, 58]. As demonstrated in [57], the weakened OES behaviors can be observed in nuclear charge radii due to the strong shell closure effect. This may result from the weakened OES of the proton Fermi energies at the completely filled shells. The OES behaviors of the proton Fermi energies may provide an alternative access to understand the anomalous behaviors in nuclear charge radii. Therefore, further investigation should be performed in the proceeding study.
Figure 5. The values of ΔϵF derived from the proton Fermi energies against calcium isotopes as a function of neutron numbers with effective forces NL3 (a) and PK1 (b). |
4. Summary and outlook
Complementary to the anomalous behavior of the charge radii along calcium isotopes, the constraint calculations on rms charge radii are performed. The calculated results suggest that the amplitudes of odd–even staggering in the binding energies and two-neutron separation energies are almost similar with these two approaches, and agree with the experimental data well. The weakening OES of charge radii can be regarded as local irregularity along calcium isotopic chain at the neutron numbers N = 20 and 28. This provides a signature to identify the shell closure effect [31, 57]. However, the empirical energy gap shows the larger amplitudes in comparison with the adjacent counterparts.
The rather strong isospin-dependence interactions can be deduced from the reproduced charge radii. In order to review the OES behaviors in charge radii, the local variations of the proton Fermi energies for calcium isotopes are delineated by three-point formula equation (5 ). It is obviously mentioned that the OES in the proton Fermi energies show the inverse amplitudes with respect to binding energies and charge radii. Meanwhile, the weakening OES behaviors can also be found in the Fermi energies at N = 20 and 28. As demonstrated in [97, 98], the nuclear size can be affected by the Fermi surface or the single-particle levels near the Fermi surface. Hence this may offer an explanation why the enhanced odd–even oscillations of charge radii can be observed between 40Ca and 48Ca.
The calculated results suggest that the suitable isospin-dependence interactions should be supplied in relativistic mean-field model. Actually, nuclear charge radii are influenced by various mechanisms, such as high order moment [109, 110], isospin symmetry breaking [111, 112], quadrupole deformation [113], etc. Precision determination of charge radii plays a crucial role in nuclear physics. The linear correlations between the charge radii differences of mirror-pair nuclei and the slope parameter of symmetry energy have been built to ascertain the isospin components of asymmetric nuclear matter interactions. As shown in [18, 114–116], the proton radii of mirror-pair nuclei can provide the opportunity to encode the information about neutron skin thickness. This suggests that neutron skin thickness and charge radii are mutually determined. Thus, this challenges us to perform high-precision descriptions in the charge radii of exotic nuclei.