Welcome to visit Communications in Theoretical Physics,
Mathematical Physics

Impact of official and civil information correlation on information-epidemic coupling dynamics in multiplex network

  • Liang’an Huo , 1, 2, * ,
  • Jun Zhang 1
Expand
  • 1Business school, University of Shanghai for Science and Technology, Shanghai 200093, China
  • 2School of Intelligent Emergency Management, University of Shanghai for Science and Technology, Shanghai 200093, China

*Author to whom correspondence should be addressed.

Received date: 2025-02-13

  Revised date: 2025-04-02

  Accepted date: 2025-05-16

  Online published: 2025-07-22

Copyright

© 2025 Institute of Theoretical Physics CAS, Chinese Physical Society and IOP Publishing. All rights, including for text and data mining, AI training, and similar technologies, are reserved.
This article is available under the terms of the IOP-Standard License.

Abstract

Official and civil information, as distinct information sources, significantly influence public behavior and the dynamics of epidemic transmission. In this paper, we propose a three-layer ${U}_{1}{A}_{1}{U}_{1}-{U}_{2}{A}_{2}{U}_{2}-SIS$ coupled model to analyze the co-evolution process of official information dissemination, civil information dissemination and epidemic transmission, considering the interdependencies between the information dissemination channels. The first layer describes the official information dissemination process. The second layer models the civil information dissemination process, considering the effects of perceived risk costs and the role of the correlation between official and civil information. The third layer represents the epidemic transmission process, highlighting the impact of the correlation between official and civil information on epidemic transmission. Then, using the microscopic Markov chain approach, we describe the information-epidemic coupled dynamics and derive the epidemic outbreak threshold. Our research demonstrates that a stronger positive correlation between official and civil information raises the epidemic threshold and suppresses the scale of epidemic transmission. Furthermore, individuals’ adoption of civil information should involve a more thorough assessment of the infection risk based on their personal circumstances, which can contribute to more effective epidemic control. Moreover, enhancing infected individuals’ accurate comprehension of official information can effectively curb the transmission of the epidemic. Our study highlights the importance of both official and civil information dissemination in epidemic management and provides insights for policymakers in developing effective public health and communication strategies.

Cite this article

Liang’an Huo , Jun Zhang . Impact of official and civil information correlation on information-epidemic coupling dynamics in multiplex network[J]. Communications in Theoretical Physics, 2025 , 77(11) : 115005 . DOI: 10.1088/1572-9494/add997

1. Introduction

Epidemic outbreaks, such as smallpox, SARS and Middle East Respiratory Syndrome (MERS), can have a major impact on human health and the global economy [14]. In particular, The COVID-19 pandemic over the past few years has had a profound impact worldwide [5, 6], further drawing attention to this issue. These challenges highlight the pressing need for accurate models to predict and control epidemic transmission, making it a critical focus in public health research.
In the early stages of epidemic transmission research, mathematical modeling and analysis played a crucial role. Kermack et al [7] derived the dynamic threshold of epidemic transmission through mathematical models, laying the foundation for subsequent studies in epidemic dynamics. Subsequently, the Susceptible–Infected–Susceptible (SIS) model and Susceptible–Infected–Recovered (SIR) model [8, 9] were proposed to describe epidemic transmission. Research has shown that complex network-based studies of disease transmission patterns can more accurately reflect the real characteristics of epidemic transmission. The introduction of small-world networks and scale-free networks [10, 11] has established a variety of methods and models for the dynamic propagation of diseases in complex networks.
With continuous research on epidemic transmission dynamics, we have found that information plays a crucial role in this process [12, 13]. Information related to epidemics is widely disseminated through mass media and social networks, influencing those who come into contact with it, thereby affecting preventive behaviors such as vaccination and mask-wearing [14, 15]. The role of information dissemination in reducing the final scale of an epidemic has also been verified [16]. Additionally, as research on multiplex networks has been applied to study the interaction between information dissemination and epidemic transmission dynamics, it has laid a foundation for epidemic transmission studies [1722]. Granell et al [23] and Xia et al [24] investigated how competing information sources impact disease transmission, revealing that regular dissemination of information through mass media significantly enhances disease suppression efforts. Guo et al [25] investigated the impact of local awareness in multiplex networks, finding that it has a two-stage cascading effect on the epidemic threshold and final outbreak size. Xu et al [26] proposed a model considering asthenic awareness and powerful awareness, and the results showed that powerful awareness can effectively delay the outbreak and limit the size of the epidemic. Yuan et al [27] established a novel cyber-physical network model and discussed the impact of information dissemination on epidemic dynamics in cyber-physical networks. By exploring the process of interaction between information coupling and disease transmission, we were prompted to gain a deeper understanding of disease transmission mechanisms.
Social platforms offer transparent channels for sharing policies and scientific findings, allowing individuals to access epidemic-related information and take protective measures. However, the spread of disease is often accompanied by a vast amount of information, making it challenging to verify authenticity, especially when civil information conflicts with official sources [28]. This divergence affects public behavior and ultimately influences disease transmission. Researchers are now investigating the co-evolution of multiple types of information dissemination and epidemic spread. Some scholars have pointed out the influence of both positive and negative preventive information on epidemic transmission within the disease-information coupled network [29, 30]. Mandal et al [31] suggested that positive and negative opinions have different dissemination speeds and hypothesized a competitive relationship with mutual penetration, allowing for a certain probability of conversion between them. Feng et al [32] investigated how individuals with different attributes in the awareness layer will affect epidemic spread and found that individuals with high centrality in the awareness layer significantly suppress the transmission of infectious diseases. Huang et al [33] demonstrated that knowledge dissemination can counteract rumors and epidemics, with the intensity of knowledge penetration playing a crucial role. Fang et al [34] examined how opinion conflict and epidemic transmission interact in multiplex networks, finding that enhanced awareness mechanisms can reduce overall epidemic prevalence. Li et al [35] explored how two types of information influence disease transmission, showing that negative information can help control its spread under certain conditions. Later, Li et al [36] analyzed the interaction between information dissemination and epidemic transmission in a dual-layer network, highlighting the effects of both direct and indirect transmission modes. Hu et al [37] studied a coupled model of two types of information and one disease with high-order structures, introducing simplex structures in information dissemination increases the probability of individuals acquiring information, thereby suppressing epidemic outbreaks. Du and Fan [38] analyzed competitive information dissemination in two-layer networks, finding that information disseminates faster and more widely than in single-layer networks, with interactions between various information types. Zhang et al [39] examined the interaction of multiple information types in multiplex networks, highlighting that their competition and cooperation significantly influence the final outbreak scale. Understanding and predicting the interaction between the dissemination of information across different network channels and the transmission of epidemics remains a significant challenge in network theory, with profound implications for the social sciences.
Currently, numerous scholars investigating the impact of information on epidemic dynamics primarily focus on how widespread disease-related information affects the transmission of epidemics. Most existing studies assume that different types of information, such as positive and negative content, originate from distinct channels, with positive information derived from official sources and negative information circulating through civil channels. This dichotomy overlooks the fact that civil channels can also disseminate positive information that aligns with official sources. In practice, civil information often either supports or contradicts official sources, exhibiting both positive and negative correlations with them. Therefore, considering the correlation between official and civil information provides a more nuanced understanding of the information’s impact on epidemic dynamics. In addition, previous studies have treated positive and negative information as distinct types, assuming that individuals are exposed to only one type at a time, with no interaction between them. In reality, during epidemics, authorities disseminate scientific information to curb disease transmission, while public opinions often spread widely through civil channels. Since individuals are exposed to both sources simultaneously, the interplay between competing or complementary information significantly influences decisions on preventive measures. Thus, studying the coexistence and correlation of these information sources is essential. To address these complexities, we present a three-layer ${U}_{1}{A}_{1}{U}_{1}-{U}_{2}{A}_{2}{U}_{2}-SIS$ coupled model that explores the correlations of information diffusion across different channels and the co-evolution of information flow and epidemic transmission. The main contributions of this study are as follows:

1. Recognizing that civil information includes both positive and negative content, we consider the varying positive and negative correlations between official and civil information.

2. We analyze the mutual coupling effect between epidemic transmission and information from different sources, including both official and civil channels. Specifically, we assess how varying correlations between these sources influence epidemic dynamics, emphasizing that individuals in infected and susceptible states respond differently to official and civil information.

3. Due to the prevalence of online rumors, individuals exhibit caution in adopting civil information. During the dissemination of civil information, individuals assess civil information based on their perceived infection risk and the degree of alignment between the civil information and official narratives before deciding whether to adopt it.

4. Based on the three-layer coupled transmission model we constructed, the state transition process of the model is analyzed using the Micro Markov Chain Approach (MMCA) to derive the epidemic threshold, and finally simulation analysis is conducted to validate the model’s effectiveness.

The structure of this paper is as follows: in section 2, we describe our three-layer coupled transmission model and the related assumptions. In section 3, we apply the microscopic Markov chain approach and derive the threshold for epidemic transmission. In section 4, extensive numerical simulations are conducted to validate our theoretical analysis. Finally, in section 5, a summary of the research work in this paper is provided.

2. The three-layer coupled model

During the COVID-19 pandemic, official information was essential in encouraging individuals to adopt preventive measures. Civil information channels, which were closely correlated with official sources, also disseminated content related to COVID-19 prevention. However, these channels often mixed both accurate and misleading information, further influencing public behavior. A strong positive correlation between official and civil can reinforce individuals’ adherence to disease prevention measures. Conversely, if civil information contradicts official information, it may hinder proper preventive behaviors. For example, regarding COVID-19 vaccination, official information promoting the vaccine as an effective means of preventing the disease encourages the public to actively get vaccinated. If civil discourse spreads positive messages about the vaccine’s effectiveness, such as personal experiences shared among friends and family after vaccination, this typically fosters greater trust in the vaccine, increasing vaccination willingness. However, if civil information circulates negative views, such as rumors about the vaccine’s immaturity or potential side effects, it may raise concerns among some individuals, leading to vaccine hesitancy. In addition, individuals’ decisions to accept civil information are also influenced by the correlation between official and civil information. Individuals who have already encountered official information assess the correlation between this official content and the civil information they consider. A negative correlation with official information decreases the likelihood of adopting civil information, while a positive correlation enhances its adoption. The analysis indicates that during an epidemic outbreak, social platforms disseminate information from diverse sources. The first category consists of official scientific information intended to guide disease prevention and treatment. The second category consists of civil information generated in response to the official releases, which may either support or oppose the official information. Both types of information pertain to the epidemic, creating a coupling effect as they spread across the platform.
To better illustrate this phenomenon, we propose an extended three-layer coupled model ${U}_{1}{A}_{1}{U}_{1}-{U}_{2}{A}_{2}{U}_{2}-SIS$ based on the two-layer network model $UAU-SIS$ established by Granell et al [23], as shown in figure 1. The first layer is an online virtual layer representing the official information layer, which includes two groups of individuals: those who are unaware of the official information $({U}_{1})$ and those who are aware of it $({A}_{1})$. The second layer is another online virtual layer representing the civil information layer, formed by the fermentation of public opinion, and includes two groups of individuals: those who are unaware of the civil information $({U}_{2})$ and those who are aware of it $({A}_{2})$. The third layer is an offline physical layer representing the epidemic transmission layer, which includes two groups of individuals: susceptible $(S)$ and infected $(I)$. It is assumed that the three network layers have the same number of nodes and are all scale-free networks. Considering that online networks allow communication between non-friends, the node connections between the two online virtual information layers differ from those in the offline physical epidemic layer.
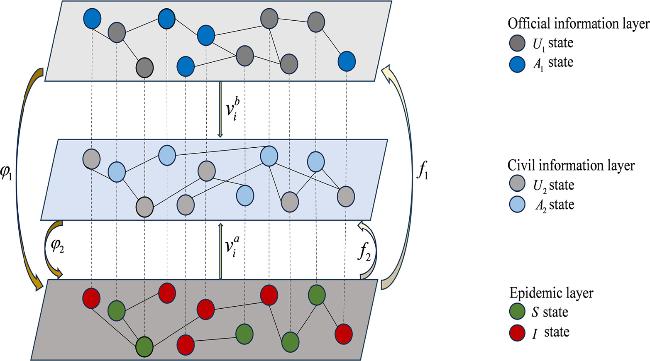
Figure 1. Structure of the three-layer ${U}_{1}{A}_{1}{U}_{1}-{U}_{2}{A}_{2}{U}_{2}-SIS$ propagation network framework.
According to the above definition of the three-layer coupling model, for each time-step individual there may be eight possible states: ${U}_{1}{U}_{2}S$, ${U}_{1}{A}_{2}S$, ${A}_{1}{U}_{2}S$, ${A}_{1}{A}_{2}S$, ${U}_{1}{U}_{2}I$, ${U}_{1}{A}_{2}I$, ${A}_{1}{U}_{2}I$, and ${A}_{1}{A}_{2}I$.
Assumption 1: Official information diffusion process
In the official information layer, official information dissemination with a probability of $\lambda $. Given that this is information promoted by the authorities, which generally have strong credibility and frequently disseminate information, individuals will either accept this information with a probability of $\lambda $ or not at all, without considering the behavioral costs of accepting the message or the risk costs of not accepting it. Additionally, individuals may forget official information with a probability of ${\delta }_{1}$.
The official information dissemination process is depicted in figure 2.
Figure 2. Propagation process of the official information diffusion. The dark blue circle represents individuals who believe in official information, while the dark gray circles represent individuals unaware of official information.
Assumption 2: Civil Information diffusion process
With the widespread dissemination of online rumors, individuals tend to consider several factors when deciding whether to adopt unofficial civil information. Specifically, they balance the behavioral cost of adopting protective measures based on this information against the potential risk of infection if they do not. Additionally, those already aware of official information are more likely to adopt civil information if it closely aligns with the official narrative—the higher the correlation, the greater the likelihood of acceptance. Conversely, low correlation decreases this likelihood. In modeling the spread of civil information, we incorporate both cost-risk trade-offs and the correlation between different information channels. The model assumes that individuals are aware of their neighbors’ adoption of civil information and their infection status.
In the civil information layer, we assume that all individuals in state ${U}_{2}$ make judgments about adopting civil information based on the current infection risk. Rational judgment is primarily based on comparing the potential risk costs an individual might bear by adopting or not adopting civil information. As described by Yin et al [40], the selection cost of an event can be represented by the expected cost of potential losses an individual may incur under different decision scenarios. We set the cost incurred by an individual due to infection as 1. Following this principle, we express the cost associated with accepting or rejecting civil information as ${C}_{i}^{{A}_{2}}(t)$ and ${C}_{i}^{{U}_{2}}(t)$. Individuals will consider the behavioral cost of ${C}_{i}^{{A}_{2}}(t)$ that adopting protective measures after accepting disease-related civil information, while the infection risk cost of not accepting such civil information is denoted as ${C}_{i}^{{U}_{2}}(t)$. According to the Fermi rule widely used in evolutionary game theory [41], we express the probability of individual $i$ accepting civil information due to rational judgment as ${v}_{i}^{a}(t)$. Additionally, individuals may forget civil information with a probability of ${\delta }_{2}$.
$\begin{eqnarray}{C}_{i}^{{A}_{2}}(t)=-[1-{q}_{i}^{{A}_{2}}(t)],\end{eqnarray}$
$\begin{eqnarray}{C}_{i}^{{U}_{2}}(t)=-[1-{q}_{i}^{{U}_{2}}(t)],\end{eqnarray}$
$\begin{eqnarray}{v}_{i}^{a}(t)=\displaystyle \frac{1}{1+\exp \left\{-\left[{C}_{i}^{{A}_{2}}(t)-{C}_{i}^{{U}_{2}}(t)/K\right.\right\}},\end{eqnarray}$
where ${q}_{i}^{{A}_{2}}(t)$ represents the probability that individual $i$, who believes in civil information, remains uninfected at step $t$. ${q}_{i}^{{U}_{2}}(t)$ represents the probability that individual $i$, who does not believe in civil information, remains uninfected at step $t$. $K(K\gt 0)$ indicates the sensitivity to the cost ${C}_{i}^{{A}_{2}}(t)$ and ${C}_{i}^{{U}_{2}}(t)$ associated with accepting or rejecting civil information.
It is known that the civil opinion field generates civil information based on the official information released by the authorities, so there may be a certain degree of correlation between official and civil information. We assume that ${x}_{{A}_{1}{A}_{2}}$ represents the degree of correlation between official and civil information. These channels information exert distinct associative influences due to their varying degrees of correlation. When there is a positive correlation $({x}_{{A}_{1}{A}_{2}}\gt 0)$ between official and civil information, it positively influences the acceptance of civil information and the transmission of diseases. Conversely, a negative correlation $({x}_{{A}_{1}{A}_{2}}\lt 0)$ detrimentally affects these outcomes. In cases where no correlation exists $({x}_{{A}_{1}{A}_{2}}=0)$, the two information channels do not exert mutual influence on one another. To represent the associative influence resulting from changes in the correlation degree relationship ${x}_{{A}_{1}{A}_{2}}$, we define ${\eta }_{{A}_{1}{A}_{2}}$ as the measure of the impact of the correlation degree between official and civil information on information recipients, expressed as follows:
$\begin{eqnarray}{\eta }_{{A}_{1}{A}_{2}}=\displaystyle \frac{{{\rm{e}}}^{{x}_{{A}_{1}{A}_{2}}}-{{\rm{e}}}^{-{x}_{{A}_{1}{A}_{2}}}}{{{\rm{e}}}^{{x}_{{A}_{1}{A}_{2}}}+{{\rm{e}}}^{-{x}_{{A}_{1}{A}_{2}}}}.\end{eqnarray}$
When ${x}_{{A}_{1}{A}_{2}}\gt 0$, there is a positive correlation between official and civil information, and ${\eta }_{{A}_{1}{A}_{2}}\in (0,1)$, individuals are more inclined to adopt civil information and implement more effective preventive measures. When ${x}_{{A}_{1}{A}_{2}}\lt 0$, there is a negative correlation between official and civil information, and ${\eta }_{{A}_{1}{A}_{2}}\in (-1,0)$, official and civil information have a negative impact on each other. When ${x}_{{A}_{1}{A}_{2}}=0$, the official information and the civil information are not correlated.
The relationship between the impact of the information correlation on information recipients and the correlation degree ${x}_{{A}_{1}{A}_{2}}$ of the two types of information is illustrated in figure 3. It can be seen from figure 3 that for any correlation degree ${x}_{{A}_{1}{A}_{2}}\in (-\infty ,+\infty )$, the measure of the corresponding impact of the correlation on information recipients ${\eta }_{{A}_{1}{A}_{2}}\in (-1,1)$, the probability of promoting official and civil information with strong positive correlation approaches its maximum value of 1, while the probability of promoting official and civil information with strong negative correlation tends to reach its minimum value of −1. The value of ${x}_{{A}_{1}{A}_{2}}$ varies according to the specific official and civil information.
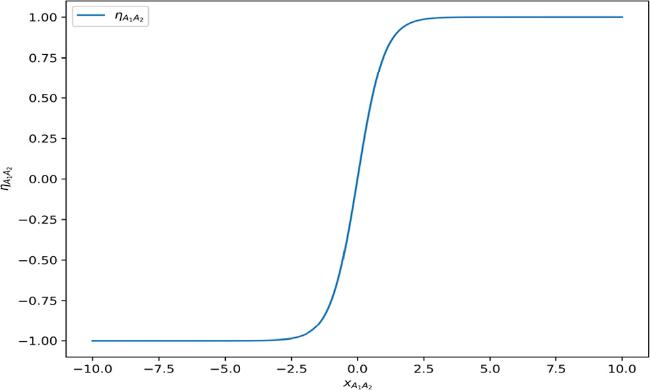
Figure 3. The impact of the correlation between different information on information recipients.
In the process of individuals accepting civil information, in addition to considering an individual’s rational judgment of the risk associated with accepting civil information, we have also introduced the impact mechanism of the correlation between official and civil information on individuals’ acceptance of civil information. If an individual is unaware of official information, their decision to accept civil information is solely based on a rational assessment of risk and cost. However, if an individual is already aware of official scientific information, they will not only consider the risk and cost but also evaluate the correlation between official and civil information before making a decision. We define the probability that individual $i$ chooses to adopt civil information due to the impact of the correlation between the two channels of information as
$\begin{eqnarray}{v}_{i}^{b}(t)=\displaystyle \frac{1}{1+{{\rm{e}}}^{-\varepsilon {\eta }_{{A}_{1}{A}_{2}}}},\end{eqnarray}$
where $\varepsilon $ is the amplification factor that reflects the influence of the correlation between the two channels of information on the decision to accept civil information.
In summary, considering the impact of rational judgment based on risk costs and the correlation between the two channels of information on an individual’s decision to believe in civil information, we define the probability that individual $i$ decides to believe civil information as
$\begin{eqnarray}{\lambda }_{i}^{{A}_{2}}(t)={\omega }_{1}{v}_{i}^{a}(t)+{\omega }_{2}{v}_{i}^{b}(t),\end{eqnarray}$
where ${\omega }_{1}+{\omega }_{2}=1$, ${\omega }_{1}\in [0,1]$, ${\omega }_{2}\in [0,1]$. If an individual has not received the official scientific information ${A}_{1}$, then the correlation factor is not considered when deciding whether to believe in civil information, i.e., ${\omega }_{2}=0$. The function ${v}_{i}^{a}(t)$ represents the probability of accepting civil information based on the risk cost assessed through rational judgment, whereas ${v}_{i}^{b}(t)$ quantifies the impact of the correlation between official and civil information on the acceptance of civil information.
Based on the above discussion, the propagation process of civil information diffusion is depicted in figure 4.
Figure 4. Propagation process of the civil information diffusion. The light blue circle represents individuals who believe in civil information, while the light gray circles represent individuals unaware of civil information.
Assumption 3: Epidemic transmission process
In the epidemic transmission layer, the epidemic transmission process follows the classical SIS model. The probability of infection for individuals who are unaware of any information is denoted by $\beta $, and nodes in state $I$ will be cured with a probability of $\mu $, returning to state $S$.
The epidemic transmission propagation process is depicted in figure 5.
Figure 5. Propagation process of the epidemic transmission. The green and red circles represent the susceptible and infected states in the SIS model, which appear in the epidemic layer.
Considering the impact of the information layer on the epidemic layer, official information is both reliable and accurate, whereas civil information tends to be uncertain. Thus, when individuals accept the official information ${A}_{1}$, they are more likely to adopt protective measures, which consequently reduces the disease transmission rate. This reduction in infection rate for individual ${A}_{1}{U}_{2}S$ is denoted by ${\varphi }_{1}$, where ${\varphi }_{1}\in (0,1)$. When individuals receive civil information ${A}_{2}$ generated from public opinion, it may be uncertain and may either positively or negatively correlate with official information. In other words, civil information may be either positive or negative. The infection rate impact factor is for individual ${U}_{1}{A}_{2}S$ is denoted by ${\varphi }_{2}$, where ${\varphi }_{2}\in \left({\varphi }_{1},\displaystyle \frac{1}{\beta }\right)$. When civil information is positive information, it suppresses disease transmission, with ${\varphi }_{1}\lt {\varphi }_{2}\lt 1$. Conversely, when civil information is negative information, it promotes disease transmission, with $1\lt {\varphi }_{2}\lt \displaystyle \frac{1}{\beta }$.
As ${\eta }_{{A}_{1}{A}_{2}}\gt 0$ and gradually increases, the positive correlation between official and civil information grows stronger, suggesting that the positively correlated impact of information from both channels intensifies. In this scenario, individuals who are exposed to both official and civil information are more likely to adopt proactive and effective protective measures, thereby further reducing the infection rate. Conversely, as ${\eta }_{{A}_{1}{A}_{2}}\lt 0$ and gradually decreases, the negative correlation between the two information channels grows stronger. In real-world situations, while official information states that vaccines effectively prevent epidemics, civil information may suggest that they cause severe side effects in some individuals. As a result, individuals exposed to both official and civil information are at a higher risk of infection compared to those who rely exclusively on official scientific information. In summary, the infection rate impact factor is for individual ${A}_{1}{A}_{2}S$ is denoted by ${\varphi }_{3}=(1-{\eta }_{{A}_{1}{A}_{2}}){\varphi }_{1}$. From this, we can obtain the basic infection rate ${\beta }^{X}$ as follows
$\begin{eqnarray}{\beta }^{X}=\left\{\begin{array}{ll}\beta & {U}_{1}{U}_{2}S\\ {\varphi }_{1}\beta & {A}_{1}{U}_{2}S\\ {\varphi }_{2}\beta & {U}_{1}{A}_{2}S\\ (1-{\eta }_{{A}_{1}{A}_{2}}){\varphi }_{1}\beta & {A}_{1}{A}_{2}S,\end{array}\right.\end{eqnarray}$
where ${\eta }_{{A}_{1}{A}_{2}}$ represents the impact of correlation between official and civil information, $X\in \{{U}_{1}{U}_{2}S,{A}_{1}{U}_{2}S,{U}_{1}{A}_{2}S,{A}_{1}{A}_{2}S\}$. When ${\eta }_{{A}_{1}{A}_{2}}=0$, it means that the official information and the civil information are not correlated, civil information does not impact the preventive measures communicated by official sources. In reality, official information and civil information cannot be completely identical or completely contradictory; therefore, the cases of ${\eta }_{{A}_{1}{A}_{2}}=1$ and ${\eta }_{{A}_{1}{A}_{2}}=-1$ are not considered.
Assumption 4: Coupling effect of epidemic transmission on the information layer
An individual’s health condition significantly shapes their preference for specific information channels. Considering the impact of the disease layer on the information layer, if an individual is uninfected, they are more likely to believe that the relevant authorities can effectively protect them, thus showing a preference for the officially released information ${A}_{1}$. If the individual is infected, they may experience negative emotions and tend to seek out civil remedies for a quick cure, thereby showing a preference for believing in the civil information ${A}_{2}$. The transmission processes of official and civil information respond differently to disease dynamics. Assuming that the probability of adopting information through official or civil channels varies with the infection status in the disease layer, we define the perception attenuation factors of the disease layer’s influence on the ${A}_{1}$ and ${A}_{2}$ layers as ${f}_{1}$ and ${f}_{2}$, respectively. Then, considering the coupling effect of the epidemic layer on the information layers, the awareness perception rate is represented by ${\lambda }_{i}^{1}$ for official information and ${\lambda }_{i}^{2}$ for civil information. Thus, the expression is as follows:
$\begin{eqnarray}\begin{array}{c}{\lambda }_{i}^{1}=\left\{\begin{array}{cc}\lambda & {\rm{the}}\,{\rm{state}}\,{\rm{of}}\,S\\ {f}_{1}\lambda & {\rm{the}}\,{\rm{state}}\,{\rm{of}}\,I,\end{array}\right.\end{array}\end{eqnarray}$
$\begin{eqnarray}{\lambda }_{i}^{2}=\left\{\begin{array}{cc}{f}_{2}{\lambda }_{i}^{{A}_{2}} & \mathrm{the}\,\mathrm{state}\,\mathrm{of}\,S\\ {\lambda }_{i}^{{A}_{2}} & \mathrm{the}\,\mathrm{state}\,\mathrm{of}\,I.\end{array}\right.\end{eqnarray}$

3. The theoretical analysis based on MMCA

According to our three-layer ${U}_{1}{A}_{1}{U}_{1}-{U}_{2}{A}_{2}{U}_{2}-SIS$ model, the $N$ individuals can be in eight states: ${U}_{1}{U}_{2}S$, ${U}_{1}{A}_{2}S$, ${A}_{1}{U}_{2}S$, ${A}_{1}{A}_{2}S$, ${U}_{1}{U}_{2}I$, ${U}_{1}{A}_{2}I$, ${A}_{1}{U}_{2}I$, and ${A}_{1}{A}_{2}I$. The probabilities that individual $i$ being in these eight states at time step $t$ can be represented as ${P}_{i}^{{U}_{1}{U}_{2}S}(t)$, ${P}_{i}^{{U}_{1}{A}_{2}S}(t)$, ${P}_{i}^{{A}_{1}{U}_{2}S}(t)$, ${P}_{i}^{{A}_{1}{A}_{2}S}(t)$, ${P}_{i}^{{U}_{1}{U}_{2}I}(t)$, ${P}_{i}^{{U}_{1}{A}_{2}I}(t)$, ${P}_{i}^{{A}_{1}{U}_{2}I}(t)$, and ${P}_{i}^{{A}_{1}{A}_{2}I}(t)$, respectively, satisfying the normalization condition ${P}_{i}^{{U}_{1}{U}_{2}S}(t)+{P}_{i}^{{U}_{1}{A}_{2}S}(t)\,+$ ${P}_{i}^{{A}_{1}{U}_{2}S}(t)+{P}_{i}^{{A}_{1}{A}_{2}S}(t)\,+$ ${P}_{i}^{{U}_{1}{U}_{2}I}(t)+{P}_{i}^{{U}_{1}{A}_{2}I}(t)+{P}_{i}^{{A}_{1}{U}_{2}I}(t)\,+{P}_{i}^{{A}_{1}{A}_{2}I}(t)=1$.
Let $A={({a}_{ij})}_{N\times N}$, $B={({b}_{ij})}_{N\times N}$ and $C={({c}_{ij})}_{N\times N}$ be the adjacency matrices of the official information diffusion network, the civil information diffusion network and the epidemic transmission network, respectively. Then, we amuse ${r}_{i}^{{A}_{1}}(t)$and ${r}_{i}^{{A}_{2}}(t)$ to represent the probabilities that an unknown individual $i$ at time $t$ has not been informed by any neighbors in the official and civil information diffusion layers, respectively, ${q}_{i}^{{U}_{1}{U}_{2}}(t)$ to represent the probability that ${U}_{1}{U}_{2}$ individual unaware of any information at time $t$ has not been infected by any neighbors, ${q}_{i}^{{A}_{1}{U}_{2}}(t)$ to represent the probability that ${A}_{1}{U}_{2}$ individual aware only of official information at time $t$ has not been infected by any neighbors, ${q}_{i}^{{U}_{1}{A}_{2}}(t)$ to represent the probability that ${U}_{1}{A}_{2}$ individual aware only of civil information at time $t$ has not been infected by any neighbors, ${q}_{i}^{{A}_{1}{A}_{2}}(t)$ to represent the probability that ${A}_{1}{A}_{2}$ individual aware of both official and civil information at time $t$ has not been infected by any neighbors, as shown below:
$\begin{eqnarray}{r}_{i}^{{A}_{1}}(t)=\displaystyle \prod _{j}\left[1-{a}_{ji}{P}_{j}^{{A}_{1}}(t){\lambda }_{i}^{1}\right],\end{eqnarray}$
$\begin{eqnarray}{r}_{i}^{{A}_{2}}(t)=\displaystyle \prod _{j}\left[1-{b}_{ji}{P}_{j}^{{A}_{2}}(t){\lambda }_{i}^{2}\right],\end{eqnarray}$
$\begin{eqnarray}{q}_{i}^{{U}_{1}{U}_{2}}(t)=\displaystyle \prod _{j}\left[1-{c}_{ji}{P}_{j}^{I}(t){\beta }^{{U}_{1}{U}_{2}S}\right],\end{eqnarray}$
$\begin{eqnarray}{q}_{i}^{{A}_{1}{U}_{2}}(t)=\displaystyle \prod _{j}\left[1-{c}_{ji}{P}_{j}^{I}(t){\beta }^{{A}_{1}{U}_{2}S}\right],\end{eqnarray}$
$\begin{eqnarray}{q}_{i}^{{U}_{1}{A}_{2}}(t)=\displaystyle \prod _{j}\left[1-{c}_{ji}{P}_{j}^{I}(t){\beta }^{{U}_{1}{A}_{2}S}\right],\end{eqnarray}$
$\begin{eqnarray}{q}_{i}^{{A}_{1}{A}_{2}}(t)=\displaystyle \prod _{j}\left[1-{c}_{ji}{P}_{j}^{I}(t){\beta }^{{A}_{1}{A}_{2}S}\right],\end{eqnarray}$
where ${P}_{j}^{{A}_{1}}(t)={P}_{j}^{{A}_{1}{U}_{2}S}(t)+{P}_{j}^{{A}_{1}{A}_{2}S}(t)+{P}_{j}^{{A}_{1}{U}_{2}I}(t)+{P}_{j}^{{A}_{1}{A}_{2}I}(t)$, and ${P}_{j}^{{A}_{2}}(t)={P}_{j}^{{U}_{1}{A}_{2}S}(t)+{P}_{j}^{{A}_{1}{A}_{2}S}(t)+{P}_{j}^{{U}_{1}{A}_{2}I}(t)+{P}_{j}^{{A}_{1}{A}_{2}I}(t)$, and ${P}_{j}^{I}(t)={P}_{j}^{{U}_{1}{U}_{2}I}(t)+{P}_{j}^{{U}_{1}{A}_{2}I}(t)+{P}_{j}^{{A}_{1}{U}_{2}I}(t)+{P}_{j}^{{A}_{1}{A}_{2}I}(t)$.
By combining equations (10)–(15), we further derived the state transition probability tree for nodes in the constructed ${U}_{1}{A}_{1}{U}_{1}-{U}_{2}{A}_{2}{U}_{2}-SIS$ model, as shown in figure 6. Since each node can be in one of eight possible states, figure 6 includes eight state transition probability trees. Each tree represents the state transitions of nodes across the three diffusion networks. The root of each tree represents the node’s state at time $t$, with branch weights indicating the probabilities of state transitions. Based on the state transition probability trees in figure 6 and combining them with equations (10)–(15), we can use the microscopic Markov chain approach [42, 43] to establish the transition equations for the eight possible states:
$\begin{eqnarray}\begin{array}{lll}{P}_{i}^{{U}_{1}{U}_{2}S}(t+1) & = & {P}_{i}^{{U}_{1}{U}_{2}S}(t){r}_{i}^{{A}_{1}}(t){r}_{i}^{{A}_{2}}(t){q}_{i}^{{U}_{1}{U}_{2}}(t)+{P}_{i}^{{A}_{1}{U}_{2}S}(t){\delta }_{1}{r}_{i}^{{A}_{2}}(t){q}_{i}^{{U}_{1}{U}_{2}}(t)\\ & & +\,{P}_{i}^{{U}_{1}{A}_{2}S}(t){r}_{i}^{{A}_{1}}(t){\delta }_{2}{q}_{i}^{{U}_{1}{U}_{2}}(t)+{P}_{i}^{{A}_{1}{A}_{2}S}(t){\delta }_{1}{\delta }_{2}{q}_{i}^{{U}_{1}{U}_{2}}(t)\\ & & +\,{P}_{i}^{{U}_{1}{U}_{2}I}(t){r}_{i}^{{A}_{1}}(t){r}_{i}^{{A}_{2}}(t)\mu +{P}_{i}^{{A}_{1}{U}_{2}I}(t){\delta }_{1}{r}_{i}^{{A}_{2}}(t)\mu \\ & & +\,{P}_{i}^{{U}_{1}{A}_{2}I}(t){r}_{i}^{{A}_{1}}(t){\delta }_{2}\mu +{P}_{i}^{{A}_{1}{A}_{2}I}(t){\delta }_{1}{\delta }_{2}\mu ,\end{array}\end{eqnarray}$
$\begin{eqnarray}\begin{array}{lll}{P}_{i}^{{A}_{1}{U}_{2}S}(t+1) & = & {P}_{i}^{{U}_{1}{U}_{2}S}(t)[1-{r}_{i}^{{A}_{1}}(t)]{r}_{i}^{{A}_{2}}(t){q}_{i}^{{A}_{1}{U}_{2}}(t)+{P}_{i}^{{A}_{1}{U}_{2}S}(t)(1-{\delta }_{1}){r}_{i}^{{A}_{2}}(t){q}_{i}^{{A}_{1}{U}_{2}}(t)\\ & & +\,{P}_{i}^{{U}_{1}{A}_{2}S}(t)[1-{r}_{i}^{{A}_{1}}(t)]{\delta }_{2}{q}_{i}^{{A}_{1}{U}_{2}}(t)+{P}_{i}^{{A}_{1}{A}_{2}S}(t)(1-{\delta }_{1}){\delta }_{2}{q}_{i}^{{A}_{1}{U}_{2}}(t)\\ & & +\,{P}_{i}^{{U}_{1}{U}_{2}I}(t)[1-{r}_{i}^{{A}_{1}}(t)]{r}_{i}^{{A}_{2}}(t)\mu +{P}_{i}^{{A}_{1}{U}_{2}I}(t)(1-{\delta }_{1}){r}_{i}^{{A}_{2}}(t)\mu \\ & & +\,{P}_{i}^{{U}_{1}{A}_{2}I}(t)[1-{r}_{i}^{{A}_{1}}(t)]{\delta }_{2}\mu +{P}_{i}^{{A}_{1}{A}_{2}I}(t)(1-{\delta }_{1}){\delta }_{2}\mu ,\end{array}\end{eqnarray}$
$\begin{eqnarray}\begin{array}{lll}{P}_{i}^{{U}_{1}{A}_{2}S}(t+1) & = & {P}_{i}^{{U}_{1}{U}_{2}S}(t){r}_{i}^{{A}_{1}}(t)[1-{r}_{i}^{{A}_{2}}(t)]{q}_{i}^{{U}_{1}{A}_{2}}(t)+{P}_{i}^{{A}_{1}{U}_{2}S}(t){\delta }_{1}[1-{r}_{i}^{{A}_{2}}(t)]{q}_{i}^{{U}_{1}{A}_{2}}(t)\\ & & +\,{P}_{i}^{{U}_{1}{A}_{2}S}(t){r}_{i}^{{A}_{1}}(t)(1-{\delta }_{2}){q}_{i}^{{U}_{1}{A}_{2}}(t)+{P}_{i}^{{A}_{1}{A}_{2}S}(t){\delta }_{1}(1-{\delta }_{2}){q}_{i}^{{U}_{1}{A}_{2}}(t)\\ & & +\,{P}_{i}^{{U}_{1}{U}_{2}I}(t){r}_{i}^{{A}_{1}}(t)[1-{r}_{i}^{{A}_{2}}(t)]\mu +{P}_{i}^{{A}_{1}{U}_{2}I}(t){\delta }_{1}[1-{r}_{i}^{{A}_{2}}(t)]\mu \\ & & +\,{P}_{i}^{{U}_{1}{A}_{2}I}(t){r}_{i}^{{A}_{1}}(t)(1-{\delta }_{2})\mu +{P}_{i}^{{A}_{1}{A}_{2}I}(t){\delta }_{1}(1-{\delta }_{2})\mu ,\end{array}\end{eqnarray}$
$\begin{eqnarray}\begin{array}{lll}{P}_{i}^{{A}_{1}{A}_{2}S}(t+1) & = & {P}_{i}^{{U}_{1}{U}_{2}S}(t)[1-{r}_{i}^{{A}_{1}}(t)][1-{r}_{i}^{{A}_{2}}(t)]{q}_{i}^{{A}_{1}{A}_{2}}(t)+{P}_{i}^{{A}_{1}{U}_{2}S}(t)(1-{\delta }_{1})[1-{r}_{i}^{{A}_{2}}(t)]{q}_{i}^{{A}_{1}{A}_{2}}(t)\\ & & +\,{P}_{i}^{{U}_{1}{A}_{2}S}(t)[1-{r}_{i}^{{A}_{1}}(t)](1-{\delta }_{2}){q}_{i}^{{A}_{1}{A}_{2}}(t)+{P}_{i}^{{A}_{1}{A}_{2}S}(t)(1-{\delta }_{1})(1-{\delta }_{2}){q}_{i}^{{A}_{1}{A}_{2}}(t)\\ & & +\,{P}_{i}^{{U}_{1}{U}_{2}I}(t)[1-{r}_{i}^{{A}_{1}}(t)][1-{r}_{i}^{{A}_{2}}(t)]\mu +{P}_{i}^{{A}_{1}{U}_{2}I}(t)(1-{\delta }_{1})[1-{r}_{i}^{{A}_{2}}(t)]\mu \\ & & +\,{P}_{i}^{{U}_{1}{A}_{2}I}(t)[1-{r}_{i}^{{A}_{1}}(t)](1-{\delta }_{2})\mu +{P}_{i}^{{A}_{1}{A}_{2}I}(t)(1-{\delta }_{1})(1-{\delta }_{2})\mu ,\end{array}\end{eqnarray}$
$\begin{eqnarray}\begin{array}{lll}{P}_{i}^{{U}_{1}{U}_{2}I}(t+1) & = & {P}_{i}^{{U}_{1}{U}_{2}S}(t){r}_{i}^{{A}_{1}}(t){r}_{i}^{{A}_{2}}(t)[1-{q}_{i}^{{U}_{1}{U}_{2}}(t)]+{P}_{i}^{{A}_{1}{U}_{2}S}(t){\delta }_{1}{r}_{i}^{{A}_{2}}(t)[1-{q}_{i}^{{U}_{1}{U}_{2}}(t)]\\ & & +\,{P}_{i}^{{U}_{1}{A}_{2}S}(t){r}_{i}^{{A}_{1}}(t){\delta }_{2}[1-{q}_{i}^{{U}_{1}{U}_{2}}(t)]+{P}_{i}^{{A}_{1}{A}_{2}S}(t){\delta }_{1}{\delta }_{2}[1-{q}_{i}^{{U}_{1}{U}_{2}}(t)]\\ & & +\,{P}_{i}^{{U}_{1}{U}_{2}I}(t){r}_{i}^{{A}_{1}}(t){r}_{i}^{{A}_{2}}(t)(1-\mu )+{P}_{i}^{{A}_{1}{U}_{2}I}(t){\delta }_{1}{r}_{i}^{{A}_{2}}(t)(1-\mu )\\ & & +\,{P}_{i}^{{U}_{1}{A}_{2}I}(t){r}_{i}^{{A}_{1}}(t){\delta }_{2}(1-\mu )+{P}_{i}^{{A}_{1}{A}_{2}I}(t){\delta }_{1}{\delta }_{2}(1-\mu ),\end{array}\end{eqnarray}$
$\begin{eqnarray}\begin{array}{lll}{P}_{i}^{{A}_{1}{U}_{2}I}(t+1) & = & {P}_{i}^{{U}_{1}{U}_{2}S}(t)[1-{r}_{i}^{{A}_{1}}(t)]{r}_{i}^{{A}_{2}}(t)[1-{q}_{i}^{{A}_{1}{U}_{2}}(t)]+{P}_{i}^{{A}_{1}{U}_{2}S}(t)(1-{\delta }_{1}){r}_{i}^{{A}_{2}}(t)[1-{q}_{i}^{{A}_{1}{U}_{2}}(t)]\\ & & +\,{P}_{i}^{{U}_{1}{A}_{2}S}(t)[1-{r}_{i}^{{A}_{1}}(t)]{\delta }_{2}[1-{q}_{i}^{{A}_{1}{U}_{2}}(t)]+{P}_{i}^{{A}_{1}{A}_{2}S}(t)(1-{\delta }_{1}){\delta }_{2}[1-{q}_{i}^{{A}_{1}{U}_{2}}(t)]\\ & & +\,{P}_{i}^{{U}_{1}{U}_{2}I}(t)[1-{r}_{i}^{{A}_{1}}(t)]{r}_{i}^{{A}_{2}}(t)(1-\mu )+{P}_{i}^{{A}_{1}{U}_{2}I}(t)(1-{\delta }_{1}){r}_{i}^{{A}_{2}}(t)(1-\mu )\\ & & +\,{P}_{i}^{{U}_{1}{A}_{2}I}(t)[1-{r}_{i}^{{A}_{1}}(t)]{\delta }_{2}(1-\mu )+{P}_{i}^{{A}_{1}{A}_{2}I}(t)(1-{\delta }_{1}){\delta }_{2}(1-\mu ),\end{array}\end{eqnarray}$
$\begin{eqnarray}\begin{array}{lll}{P}_{i}^{{U}_{1}{A}_{2}I}(t+1) & = & {P}_{i}^{{U}_{1}{U}_{2}S}(t){r}_{i}^{{A}_{1}}(t)[1-{r}_{i}^{{A}_{2}}(t)][1-{q}_{i}^{{U}_{1}{A}_{2}}(t)]\\ & & +\,{P}_{i}^{{A}_{1}{U}_{2}S}(t){\delta }_{1}[1-{r}_{i}^{{A}_{2}}(t)][1-{q}_{i}^{{U}_{1}{A}_{2}}(t)]\\ & & +\,{P}_{i}^{{U}_{1}{A}_{2}S}(t){r}_{i}^{{A}_{1}}(t)(1-{\delta }_{2})[1-{q}_{i}^{{U}_{1}{A}_{2}}(t)]\\ & & +\,{P}_{i}^{{A}_{1}{A}_{2}S}(t){\delta }_{1}(1-{\delta }_{2})[1-{q}_{i}^{{U}_{1}{A}_{2}}(t)]\\ & & +\,{P}_{i}^{{U}_{1}{U}_{2}I}(t){r}_{i}^{{A}_{1}}(t)[1-{r}_{i}^{{A}_{2}}(t)](1-\mu )+{P}_{i}^{{A}_{1}{U}_{2}I}(t){\delta }_{1}[1-{r}_{i}^{{A}_{2}}(t)](1-\mu )\\ & & +\,{P}_{i}^{{U}_{1}{A}_{2}I}(t){r}_{i}^{{A}_{1}}(t)(1-{\delta }_{2})(1-\mu )+{P}_{i}^{{A}_{1}{A}_{2}I}(t){\delta }_{1}(1-{\delta }_{2})(1-\mu ),\end{array}\end{eqnarray}$
$\begin{eqnarray}\begin{array}{lll}{P}_{i}^{{A}_{1}{A}_{2}I}(t+1) & = & {P}_{i}^{{U}_{1}{U}_{2}S}(t)[1-{r}_{i}^{{A}_{1}}(t)][1-{r}_{i}^{{A}_{2}}(t)][1-{q}_{i}^{{A}_{1}{A}_{2}}(t)]\\ & & +{P}_{i}^{{A}_{1}{U}_{2}S}(t)(1-{\delta }_{1})[1-{r}_{i}^{{A}_{2}}(t)][1-{q}_{i}^{{A}_{1}{A}_{2}}(t)]\\ & & +\rm{}{P}_{i}^{{U}_{1}{A}_{2}S}(t)[1-{r}_{i}^{{A}_{1}}(t)](1-{\delta }_{2})[1-{q}_{i}^{{A}_{1}{A}_{2}}(t)]\\ & & +{P}_{i}^{{A}_{1}{A}_{2}S}(t)(1-{\delta }_{1})(1-{\delta }_{2})[1-{q}_{i}^{{A}_{1}{A}_{2}}(t)]+\rm{}{P}_{i}^{{U}_{1}{U}_{2}I}(t)[1-{r}_{i}^{{A}_{1}}(t)][1-{r}_{i}^{{A}_{2}}(t)](1-\mu )\\ & & +{P}_{i}^{{A}_{1}{U}_{2}I}(t)(1-{\delta }_{1})[1-{r}_{i}^{{A}_{2}}(t)](1-\mu )\\ & & +\rm{}{P}_{i}^{{U}_{1}{A}_{2}I}(t)[1-{r}_{i}^{{A}_{1}}(t)](1-{\delta }_{2})(1-\mu )\\ & & +{P}_{i}^{{A}_{1}{A}_{2}I}(t)(1-{\delta }_{1})(1-{\delta }_{2})(1-\mu ).\end{array}\end{eqnarray}$
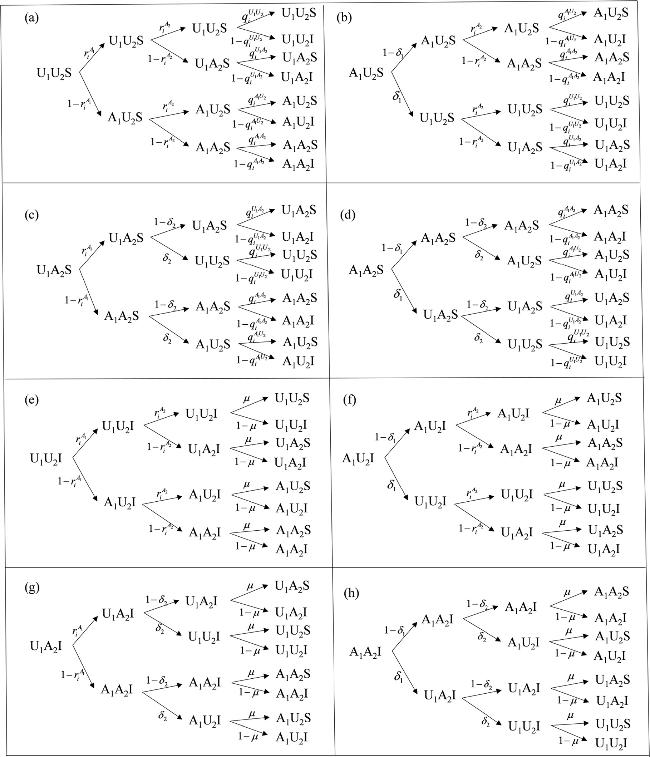
Figure 6. Probability tree of the eight possible node states in the model.
When the system tends to a steady state, we can obtain that ${P}_{i}(t+1)={P}_{i}(t)={P}_{i}$ holds for any node $i$ and all possible states. We can then further calculate the epidemic threshold. Near the prevalence threshold, the number of infected individuals in the system tends to zero, and we can assume that ${P}_{i}^{I}={P}_{i}^{{U}_{1}{U}_{2}I}+{P}_{i}^{{U}_{1}{A}_{2}I}+{P}_{i}^{{A}_{1}{U}_{2}I}+{P}_{i}^{{A}_{1}{A}_{2}I}={\sigma }_{i}\ll 1$, Accordingly, equations (12)–(15) can be approximated as
$\begin{eqnarray}{q}_{i}^{{U}_{1}{U}_{2}}(t)=\displaystyle \prod _{j}\left[1-{c}_{ji}{P}_{j}^{I}(t){\beta }^{{U}_{1}{U}_{2}S}\right]\approx 1-{\beta }^{{U}_{1}{U}_{2}S}\displaystyle \displaystyle \sum _{j}{c}_{ji}{\sigma }_{j,}\end{eqnarray}$
$\begin{eqnarray}{q}_{i}^{{A}_{1}{U}_{2}}(t)=\displaystyle \prod _{j}\left[1-{c}_{ji}{P}_{j}^{I}(t){\beta }^{{A}_{1}{U}_{2}S}\right]\approx 1-{\beta }^{{A}_{1}{U}_{2}S}\displaystyle \displaystyle \sum _{j}{c}_{ji}{\sigma }_{j,}\end{eqnarray}$
$\begin{eqnarray}{q}_{i}^{{U}_{1}{A}_{2}}(t)=\displaystyle \prod _{j}\left[1-{c}_{ji}{P}_{j}^{I}(t){\beta }^{{U}_{1}{A}_{2}S}\right]\approx 1-{\beta }^{{U}_{1}{A}_{2}S}\displaystyle \displaystyle \sum _{j}{c}_{ji}{\sigma }_{j,}\end{eqnarray}$
$\begin{eqnarray}{q}_{i}^{{A}_{1}{A}_{2}}(t)=\displaystyle \prod _{j}\left[1-{c}_{ji}{P}_{j}^{I}(t){\beta }^{{A}_{1}{A}_{2}S}\right]\approx 1-{\beta }^{{A}_{1}{A}_{2}S}\displaystyle \displaystyle \sum _{j}{c}_{ji}{\sigma }_{j}.\end{eqnarray}$
Substituting equations (24)–(27) into equations (16)–(23), we get the following equations:
$\begin{eqnarray}{P}_{i}^{{U}_{1}{U}_{2}S}=\left({P}_{i}^{{U}_{1}{U}_{2}S}{r}_{i}^{{A}_{1}}+{P}_{i}^{{A}_{1}{U}_{2}S}{\delta }_{1}\right){r}_{i}^{{A}_{2}}\rm{}+\rm{}\left({P}_{i}^{{U}_{1}{A}_{2}S}{r}_{i}^{{A}_{1}}+{P}_{i}^{{A}_{1}{A}_{2}S}{\delta }_{1}\right){\delta }_{2,}\end{eqnarray}$
$\begin{eqnarray}{P}_{i}^{{A}_{1}{U}_{2}S}=\left({P}_{i}^{{U}_{1}{U}_{2}S}{r}_{i}^{{A}_{2}}+{P}_{i}^{{U}_{1}{A}_{2}S}{\delta }_{2}\right)\left(1-{r}_{i}^{{A}_{1}}\right)+\left({P}_{i}^{{A}_{1}{U}_{2}S}{r}_{i}^{{A}_{2}}+{P}_{i}^{{A}_{1}{A}_{2}S}{\delta }_{2}\right)\left(1-{\delta }_{1},\right)\end{eqnarray}$
$\begin{eqnarray}{P}_{i}^{{U}_{1}{A}_{2}S}=\left({P}_{i}^{{U}_{1}{U}_{2}S}{r}_{i}^{{A}_{1}}+{P}_{i}^{{A}_{1}{U}_{2}S}{\delta }_{1}\right)\left(1-{r}_{i}^{{A}_{2}}\right)+\left({P}_{i}^{{U}_{1}{A}_{2}S}{r}_{i}^{{A}_{1}}+{P}_{i}^{{A}_{1}{A}_{2}S}{\delta }_{1}\right)\left(1-{\delta }_{2}\right),\end{eqnarray}$
$\begin{eqnarray}\begin{array}{lll}{P}_{i}^{{A}_{1}{A}_{2}S} & = & {P}_{i}^{{U}_{1}{U}_{2}S}\left(1-{r}_{i}^{{A}_{1}}\right)\left(1-{r}_{i}^{{A}_{2}}\right)+{P}_{i}^{{A}_{1}{U}_{2}S}\left(1-{\delta }_{1}\right)\left(1-{r}_{i}^{{A}_{2}}\right)\\ & & +\,{P}_{i}^{{U}_{1}{A}_{2}S}\left(1-{r}_{i}^{{A}_{1}}\right)\left(1-{\delta }_{2}\right)+{P}_{i}^{{A}_{1}{A}_{2}S}\left(1-{\delta }_{1}\right)\left(1-{\delta }_{2}\right),\end{array}\end{eqnarray}$
$\begin{eqnarray*}\begin{array}{lll}\mu {\sigma }_{i} & = & \left[\left({P}_{i}^{{U}_{1}{U}_{2}S}{r}_{i}^{{A}_{1}}+{P}_{i}^{{A}_{1}{U}_{2}S}{\delta }_{1}\right){r}_{i}^{{A}_{2}}+\left({P}_{i}^{{U}_{1}{A}_{2}S}{r}_{i}^{{A}_{1}}+{P}_{i}^{{A}_{1}{A}_{2}S}{\delta }_{1}\right){\delta }_{2}\right]{\beta }^{{U}_{1}{U}_{2}S}\displaystyle \displaystyle \sum _{j}{c}_{ji}{\sigma }_{j}\\ & & +\,\left[\left({P}_{i}^{{U}_{1}{U}_{2}S}{r}_{i}^{{A}_{2}}+{P}_{i}^{{U}_{1}{A}_{2}S}{\delta }_{2}\right)\left(1-{r}_{i}^{{A}_{1}}\right)+\left({P}_{i}^{{A}_{1}{U}_{2}S}{r}_{i}^{{A}_{2}}+{P}_{i}^{{A}_{1}{A}_{2}S}{\delta }_{2}\right)\left(1-{\delta }_{1}\right)\right]{\beta }^{{A}_{1}{U}_{2}S}\displaystyle \displaystyle \sum _{j}{c}_{ji}{\sigma }_{j}\\ & & +\,\left[\left({P}_{i}^{{U}_{1}{U}_{2}S}{r}_{i}^{{A}_{1}}+{P}_{i}^{{A}_{1}{U}_{2}S}{\delta }_{1}\right)\left(1-{r}_{i}^{{A}_{2}}\right)+\left({P}_{i}^{{U}_{1}{A}_{2}S}{r}_{i}^{{A}_{1}}+{P}_{i}^{{A}_{1}{A}_{2}S}{\delta }_{1}\right)\left(1-{\delta }_{2}\right)\right]{\beta }^{{U}_{1}{A}_{2}S}\displaystyle \displaystyle \sum _{j}{c}_{ji}{\sigma }_{j}\end{array}\end{eqnarray*}$
$\begin{eqnarray}\begin{array}{c}+\,\left[{P}_{i}^{{U}_{1}{U}_{2}S}\left(1-{r}_{i}^{{A}_{1}}\right)\left(1-{r}_{i}^{{A}_{2}}\right)+{P}_{i}^{{A}_{1}{U}_{2}S}\left(1-{\delta }_{1}\right)\left(1-{r}_{i}^{{A}_{2}}\right)\right]{\beta }^{{A}_{1}{A}_{2}S}\displaystyle \displaystyle \sum _{j}{c}_{ji}{\sigma }_{j}\\ +\,\left[{P}_{i}^{{U}_{1}{A}_{2}S}\left(1-{r}_{i}^{{A}_{1}}\right)\left(1-{\delta }_{2}\right)+{P}_{i}^{{A}_{1}{A}_{2}S}\left(1-{\delta }_{1}\right)\left(1-{\delta }_{2}\right)\right]{\beta }^{{A}_{1}{A}_{2}S}\displaystyle \displaystyle \sum _{j}{c}_{ji}{\sigma }_{j}.\end{array}\end{eqnarray}$
Then, according to equations (28)–(31), equation (32) can be simplified as
$\begin{eqnarray}\mu {\sigma }_{i}=[{P}_{i}^{{U}_{1}{U}_{2}S}+{P}_{i}^{{A}_{1}{U}_{2}S}{\varphi }_{1}+{P}_{i}^{{U}_{1}{U}_{2}S}{\varphi }_{2}+{P}_{i}^{{A}_{1}{A}_{2}S}(1-{\eta }_{{A}_{1}{A}_{2}}){\varphi }_{1}]\beta \displaystyle \displaystyle \sum _{j}{c}_{ji}{\sigma }_{j}.\end{eqnarray}$
Next, we can rewrite equation (33) in the following form
$\begin{eqnarray}\displaystyle \displaystyle \sum _{j}\left\{[{P}_{i}^{{U}_{1}{U}_{2}S}+{P}_{i}^{{A}_{1}{U}_{2}S}{\varphi }_{1}+{P}_{i}^{{U}_{1}{U}_{2}S}{\varphi }_{2}+{P}_{i}^{{A}_{1}{A}_{2}S}(1-{\eta }_{{A}_{1}{A}_{2}}){\varphi }_{1}]{c}_{ji}-\displaystyle \frac{\mu }{\beta }{\zeta }_{ji}\right\}{\sigma }_{j}=0,\end{eqnarray}$
where ${\zeta }_{ji}$ represents the element of the identity matrix.
Let ${h}_{ji}=[{P}_{i}^{{U}_{1}{U}_{2}S}+{P}_{i}^{{A}_{1}{U}_{2}S}{\varphi }_{1}+{P}_{i}^{{U}_{1}{U}_{2}S}{\varphi }_{2}+{P}_{i}^{{A}_{1}{A}_{2}S}(1-{\eta }_{{A}_{1}{A}_{2}}){\varphi }_{1}]{c}_{ji}$ be the element of matrix $H$. According to equation (32), the epidemic threshold of the proposed model can be described as follows
$\begin{eqnarray}{\beta }_{c}=\displaystyle \frac{\mu }{{{\rm{\Lambda }}}_{\max }(H)},\end{eqnarray}$
where ${{\rm{\Lambda }}}_{\max }(H)$ denotes the maximum eigenvalue of the matrix $H$. It is clear from equation (35) that ${\beta }_{c}$ explicitly depends on the information diffusion process, recovery probability $\mu $, the impact of correlation between official and civil information ${\eta }_{{A}_{1}{A}_{2}}$, and the infection rate impact factors ${\varphi }_{1}$ and ${\varphi }_{2}$.

4. The numerical simulations

In this section, we validate the applicability of our proposed model by performing Monte Carlo (MC) simulations. We investigated the impact of different parameters on the epidemic outbreak threshold and the proportion of infected individuals. The network used in this study is the BA (Barabási–Albert) scale-free networks [44]. For the three-layer BA scale-free network, considering that individuals in the virtual layers may have more connections, the average network degree of the virtual layers is set to $\lt k\gt =6$, while the average network degree of the real disease layer is set to $\lt k\gt =3$. In all experiments, the network size is fixed at $N=3000$ nodes [45]. Each data point in the figures is obtained by averaging 50 iterations. Additionally, the initial proportions of nodes in states ${A}_{1}$, ${A}_{2}$, and $I$ were assumed to be 0.1, respectively and the amplification factor $\varepsilon $ of the influence of information association on the acceptance of civil information is set to 1. To simplify the model, enabling us to conduct an effective preliminary analysis, we assume ${f}_{1}={f}_{2}=f$.

4.1. The impact of information correlation on epidemic transmission

First, we investigate the impact of the correlation ${\eta }_{{A}_{1}{A}_{2}}$ between official and civil information on the disease scale and disease threshold. When civil information is positively correlated with official information, it also plays a suppressive role in disease transmission, with ${\varphi }_{1}\lt {\varphi }_{2}\lt 1$. When civil information is negatively correlated with official information, it promotes disease transmission, with $1\lt {\varphi }_{2}\lt \displaystyle \frac{1}{\beta }$. Therefore, we will separately discuss the impact when civil information is positively or negatively correlated with official information.
From figure 7, it can be observed that when civil information is positively correlated with official information, as the impact of the positive correlation ${\eta }_{{A}_{1}{A}_{2}}$ increases, ${\rho }^{I}$ decreases, and ${\beta }_{c}$ increases. This trend reflects the reality that individuals are more likely to adopt prompt and effective preventive measures when the civil discourse aligns more closely with the official discourse. Consequently, civil information that is highly correlated with official data plays a significant role in epidemic prevention, particularly once the public has accepted the official information. Furthermore, comparing figures 7(b), (d), and (f) reveals that a higher basic recovery rate, combined with a stronger positive correlation between official and civil information, leads to a larger epidemic threshold ${\beta }_{c}$ and a smaller proportion of infected individuals ${\rho }^{I}$. This conclusion is consistent with the epidemic threshold formula derived in section 3, thereby validating the feasibility of the model-based epidemic threshold. In summary, policymakers and health communicators should consider these findings and manage civil information appropriately. When civil information is positively correlated with official information, its accuracy should be promptly confirmed to the public to facilitate more effective preventive measures. Additionally, enhancing patient treatment and increasing the disease recovery rate can significantly curb the spread of the epidemic.
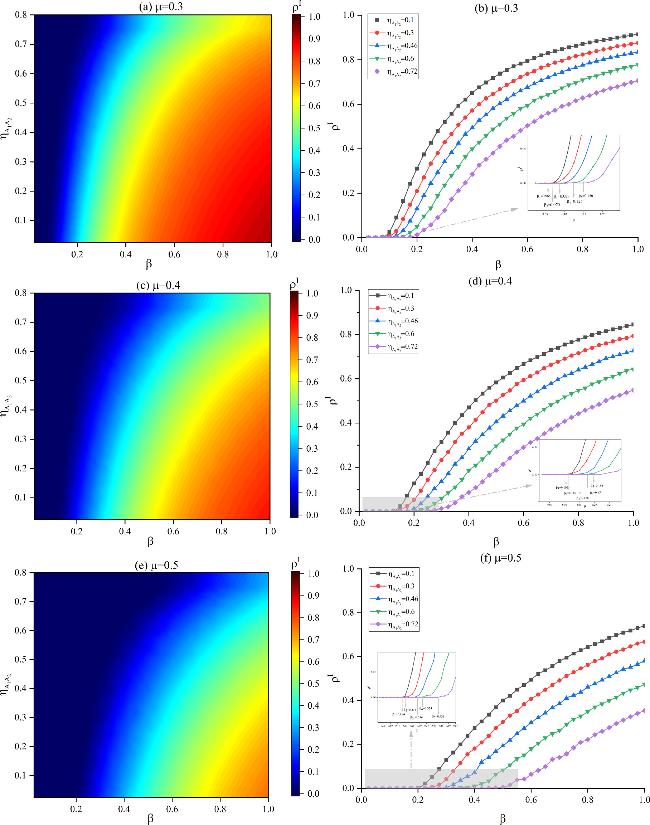
Figure 7. Epidemic scale as a function of the basic infection rate and the impact of different positive correlation ${\eta }_{{A}_{1}{A}_{2}}$. The basic recovery rate in different subplots is set as follows: (a) and (b) $\mu =0.3$, (c) and (d) $\mu =0.4$, (e) and (f) $\mu =0.5$. Other parameters are set as follows: $\lambda =0.2$, $f=0.6$, $K=0.3$, ${\omega }_{2}=0.5$, ${\delta }_{1}=0.4$, ${\delta }_{2}=0.5$, ${\varphi }_{1}=0.4$, ${\varphi }_{2}=0.8$.
Then, in figure 8, we analyze the impact of positive correlation and disease transmission rate on the final number of infected individuals ${\rho }^{I}$ under different official information dissemination rates. As the transmission rate of official information increases, the disease threshold ${\beta }_{c}$ increases, and the final infection scale ${\rho }^{I}$ decreases. Additionally, the stronger the positive correlation between official and civil information, the larger the disease threshold becomes, which is consistent with the conclusions drawn from figure 7. When the positive correlation is low, the impact of varying official information dissemination rates on the disease threshold is minimal. However, when the positive correlation is high, the influence of the official information dissemination rate on the disease threshold increases. This phenomenon occurs because, with a low positive correlation, the dissemination of official information has little effect on the spread of civil information. In this case, an individual’s probability of receiving civil information is minimally affected by its correlation with official information, and the number of individuals receiving both official and positively correlated civil information remains low. Consequently, there is little impact on both disease thresholds and disease sizes when the positive correlation is low. In contrast, when the positive correlation is high, enhancing the transmission of official information not only boosts its own spread but also promotes the dissemination of related positive civil information, enabling individuals to more accurately receive and interpret this information. Therefore, to ensure a high positive correlation between public and official information, authorities can further enhance epidemic control efforts by intensifying the dissemination of scientific information.
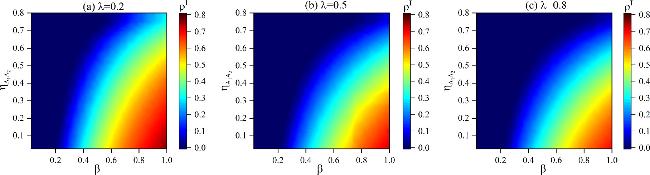
Figure 8. The influence of $\beta $ and the impact of positive correlation ${\eta }_{{A}_{1}{A}_{2}}$ on ${\rho }^{I}$. The transmission rate of official information in different subplots is set as follows: (a) $\lambda =0.2$, (b) $\lambda =0.5$, (c) $\lambda =0.8$. Other parameters are set to be $f=0.6$, $K=0.3$, ${\omega }_{2}=0.5$, ${\delta }_{1}=0.4$, ${\delta }_{2}=0.5$, $\mu =0.5$, ${\varphi }_{1}=0.4$, ${\varphi }_{2}=0.8$.
In addition, figure 9 shows that when civil information is negatively correlated with official information, as the impact of negative correlation ${\eta }_{{A}_{1}{A}_{2}}$ decreases, ${\rho }^{I}$ increases, and ${\beta }_{c}$ decreases. As the value of ${\eta }_{{A}_{1}{A}_{2}}$ further decreases, meaning the shift from relative to absolute contradiction between official and civil information, the negative impact of the civil information on the official information gradually increases. Individuals who are aware of official information but are also exposed to rumors in the civil discourse may have their decisions to take correct preventive measures affected, ultimately increasing the likelihood of infection and expanding the disease scale. Comparing figures 9(b), (d), and (f), when official and civil information are negatively correlated, a higher disease recovery rate $\mu $ can also increase the epidemic threshold ${\beta }_{c}$ and reduce the disease size ${\rho }^{I}$. Furthermore, this finding confirms that the threshold formula derived in section 3 remains valid, regardless of whether official and civil information are positively or negatively correlated.
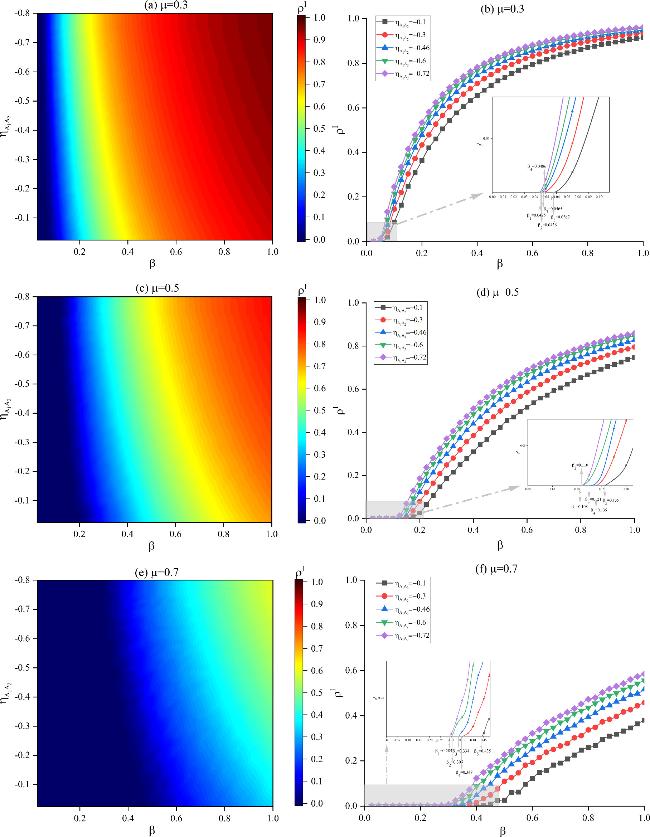
Figure 9. Epidemic scale as a function of the basic infection rate and the impact of different negative correlation ${\eta }_{{A}_{1}{A}_{2}}$. The basic recovery rate in different subplots is set as follows: (a) and (b) $\mu =0.3$, (c) and (d) $\mu =0.5$, (e) and (f) $\mu =0.7$. Other parameters are set as follows: $\lambda =0.5$, $f=0.6$, $K=0.3$, ${\omega }_{2}=0.5$, ${\delta }_{1}=0.4$, ${\delta }_{2}=0.5$, ${\varphi }_{1}=0.4$.
Comparing figures 7 and 9, the impact of the degree of negative correlation between official and civil information on the epidemic threshold and epidemic scale is smaller compared to that of positive correlation. This phenomenon occurs because a higher degree of negative correlation between the two channels of information not only creates contradictions in individual decision-making and affects the individual’s adoption of the preventive measures conveyed by official information, but also reduces the likelihood that the individual will accept negative civil information. In other words, individuals who already trust official information are less likely to trust negative civil information. Therefore, the dissemination of civil information will decrease, and the number of individuals with access to both channels of information will also decline. Conversely, positive correlation can both promote the acceptance of beneficial civil information and help individuals adopt more effective protective measures in a timely manner. As a result, a negative correlation between the two channels of information, compared to a positive correlation, would reduce the effect on disease threshold and severity. In summary, a stronger negative correlation between official and civil information can increase the scale of the disease. Therefore, relevant authorities should intensify efforts to combat the spread of rumors in the civil discourse, preventing the negative impact of these rumors on the public’s adoption of preventive measures, in order to effectively control the transmission and outbreak of diseases.
Next, in figure 10, we analyze the impact of the negative correlation between the two information channels and the disease transmission rate on the final number of infections in the system’s steady state under different official information dissemination rates. The smaller the negative correlation between official and civil information, the higher the proportion of infected individuals ${\rho }^{I}$, consistent with the findings shown in figure 9.
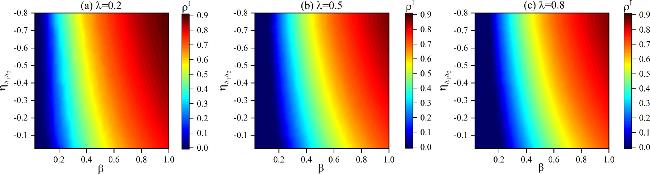
Figure 10. The influence of $\beta $ and the impact of negative correlation ${\eta }_{{A}_{1}{A}_{2}}$ on ${\rho }^{I}$. The transmission rates of official information in different subplots are set as follows: (a) $\lambda =0.2$, (b) $\lambda =0.5$, (c) $\lambda =0.8$. Other parameters are set to be $f=0.6$, $K=0.3$, ${\omega }_{2}=0.5$, ${\delta }_{1}=0.4$, ${\delta }_{2}=0.5$, $\mu =0.5$, ${\varphi }_{1}=0.4$.
Comparing and analyzing figures 8 and 10, we observe that, regardless of whether official and civil information are positively or negatively correlated, increasing the dissemination of official information effectively suppresses epidemic transmission. When official and civil information is positively correlated, amplifying the dissemination of official information bolsters the dissemination of civil information, accelerating the public’s adoption of effective preventive measures and providing stronger protection against the disease. Conversely, when official and civil information is negatively correlated, increasing the transmission of official information reduces the likelihood of individuals adopting contradictory civil information, thereby mitigating its negative influence and contributing positively to disease prevention. Controlling civil information—whether by actively promoting positive civil information or managing the spread of harmful rumors—can significantly aid in disease prevention. Given the correlation between official and civil information, reducing information management costs by prioritizing the promotion and dissemination of official information can also be an effective strategy. As a result, regulatory authorities should focus on enhancing the reach and credibility of official information. For particularly harmful or misleading civil information, timely intervention is necessary to mitigate its negative effects. Additionally, the authenticity of positive civil information should be promptly validated and communicated to the public, ensuring individuals are not hesitant to trust both official and positive civil sources. This comprehensive approach will enhance public adherence to preventive measures and contribute to more effective epidemic control.

4.2. The impact of civil information adoption preference on epidemic transmission

In figure 11, we examine the impact of the preference for adopting civil information on the final infection scale. As ${\omega }_{2}$ increases, individuals who have already received official information are more inclined to consider the correlation between official and civil information when deciding whether to adopt civil information. As can be seen from figure 11, the epidemic threshold ${\beta }_{c}$ decreases and the final number of infected individuals ${\rho }^{I}$ increases as ${\omega }_{2}$ increases. This phenomenon can be attributed to the fact that, when ${\omega }_{2}$ is high, individuals overly rely on the correlation between official and civil information to decide whether to adopt civil information. However, due to the misleading nature of civil information, they may fail to correctly perceive its correlation with official information, making it difficult to distinguish false negative civil information. At the same time, they ignore the actual infection risks in their surrounding environment and adopt negative civil information. Conversely, when ${\omega }_{2}$ is low, individuals tend to consider their personal and local conditions, assessing the infection risk contextually before choosing to adopt civil information. This suggests that when confronted with potentially misleading civil information, individuals should avoid over-reliance on its similarity to official information and instead make a rational evaluation of infection risks. Therefore, relevant managers should promptly communicate the distinctions between official and civil information to enhance individuals’ capacity for rational infection risk assessment based on their specific situations during an epidemic.
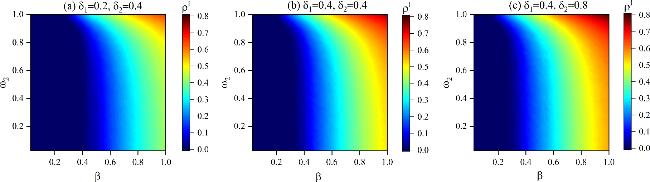
Figure 11. The influence of $\beta $ and ${\omega }_{2}$ on ${\rho }^{I}$. The information forgetting rates in different subplots are set as follows: (a) ${\delta }_{1}=0.2,\,{\delta }_{2}=0.4$, (b) ${\delta }_{1}=0.4,\,{\delta }_{2}=0.4$, (c) ${\delta }_{1}=0.4,\,{\delta }_{2}=0.8$. Other parameters are set as follows: ${\eta }_{{A}_{1}{A}_{2}}=0.46$, $\lambda =0.3$, $K=0.1$, $f=0.9$, $\mu =0.5$, ${\varphi }_{1}=0.4$, ${\varphi }_{2}=0.6$.
Comparing figures 11(a) and (b), as the forgetting rate of official information ${\delta }_{1}$ increases, the disease threshold ${\beta }_{c}$ decreases, leading to an expansion in the scale of the disease. Similarly, comparing figures 11(b) and (c), when the forgetting rate of civil information positively correlated with official information ${\delta }_{2}$ increases, the disease threshold ${\beta }_{c}$ also decreases, resulting in an expanded disease scale. These findings suggest that the faster the forgetting rate of both official and positively correlated civil information, the quicker the disease outbreak occurs. In conclusion, enhancing the dissemination of official and positive civil information, while controlling the rate at which it is forgotten, is critical for effectively managing disease transmission.

4.3. The effect of interlayer mutual coupling on epidemic transmission

In figure 12, we examine the coupling effect of the disease layer on the information layer, individuals in infected and susceptible states perceive information from various channels differently. Figure 12 clearly shows that as the information attenuation coefficient $f$ increases, ${\rho }^{I}$ decreases, and ${\beta }_{c}$ increases. This evolutionary trend suggests that as $f$ increases, the influence of an individual’s health condition on the choice between accepting official or civil information diminishes. This will reduce the disease scale and raise the disease threshold, underscoring the pivotal role of individual health perceptions in shaping information-seeking behavior and influencing epidemic dynamics. As a result, the epidemic scale may expand due to a decline in public trust, which undermines the effectiveness of critical public health measures, such as social distancing, vaccination campaigns, and quarantine protocols—measures that depend heavily on widespread public compliance. Furthermore, comparing figures 12(a)–(c), as the forgetting rate of official information and positively correlated civil information increases, the disease scale expands. This is consistent with the conclusions drawn from figure 11. Thus, during an outbreak, it is imperative for authorities to swiftly reassure the affected population and enhance the dissemination of scientifically validated information to prevent public distrust of official sources and reliance on unverified civil information. Maintaining infected individuals’ trust in official communications is crucial for the successful implementation of epidemic control strategies.
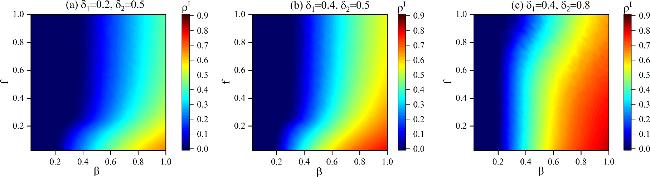
Figure 12. The function of epidemic scale ${\rho }^{I}$ with basic infection rate $\beta $ and different information decay coefficients $f$. The information forgetting rates in different subplots are set as follows: (a) ${\delta }_{1}=0.2,\,{\delta }_{2}=0.5$, (b) ${\delta }_{1}=0.4,\,{\delta }_{2}=0.5$, (c) ${\delta }_{1}=0.4,\,{\delta }_{2}=0.8$. Other parameters are set as follows: ${\eta }_{{A}_{1}{A}_{2}}=0.46$, $\lambda =0.2$, $K=0.3$, ${\omega }_{2}=0.5$, $\mu =0.5$, ${\varphi }_{1}=0.4$, ${\varphi }_{2}=0.8$.
In figure 13, we investigate the impact of the attenuation factor ${\varphi }_{1}$ on the epidemic dynamics, ${\varphi }_{1}$ can be considered as the intensity of self-protective measures adopted by individuals in response to official information under different states. A smaller ${\varphi }_{1}$ value indicates higher effectiveness of the preventive measures communicated by public health authorities. As shown in figure 13, when ${\varphi }_{1}$ decreases, the disease transmission threshold ${\beta }_{c}$ increases and the proportion of infected individuals ${\rho }^{I}$ decreases. This phenomenon occurs because individuals, upon receiving official information, promptly recognize the threat of the epidemic and, as a result, take timely and effective protective actions. Therefore, it is imperative that public health authorities ensure that the information they release is not only scientifically robust but also efficiently communicated and easily comprehensible to the general population. Individuals take prompt preventive actions such as early vaccination, adherence to social distancing protocols, and compliance with quarantine measures. This swift and widespread public engagement is crucial for reducing transmission rates and effectively controlling the transmission of the epidemic.
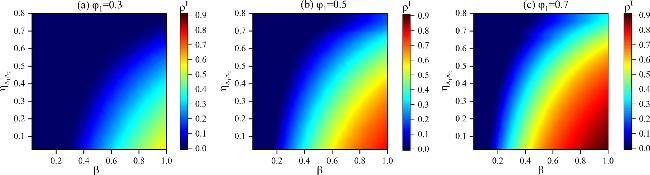
Figure 13. The function of epidemic scale ${\rho }^{I}$ with basic infection rate $\beta $ and different positive correlation ${\eta }_{{A}_{1}{A}_{2}}$. The decay factors in different subplots are set as follows: (a) ${\varphi }_{1}=0.3$, (b) ${\varphi }_{1}=0.5$, (c) ${\varphi }_{1}=0.7$. Other parameters are set as follows: $\lambda =0.5$, $f=0.6$, $K=0.3$, ${\omega }_{2}=0.5$, ${\delta }_{1}=0.4$, ${\delta }_{2}=0.5$, $\mu =0.5$, ${\varphi }_{2}=0.8$.
In figure 14, we analyze the varying degrees of negative correlation between official and civil information, as well as the impact of the official information attenuation factor on the final number of infections. Consistent with figure 9, the weaker the negative correlation between official and civil information, the smaller the disease scale. When the two information channels are negatively correlated, an increase in ${\varphi }_{1}$ facilitates the spread of the epidemic, especially when ${\eta }_{{A}_{1}{A}_{2}}$ is smaller. This is primarily due to the strong negative correlation between official and civil information, as well as the failure to implement robust preventive measures, which together contribute to the expansion of the disease scale. Moreover, regardless of the degree of negative correlation between the two channels of information, reducing ${\varphi }_{1}$ can effectively suppress the disease scale. Thus, during an epidemic, it is essential for individuals to enhance their ability to critically assess civil information and maintain trust in official preventive measures. Relevant authorities can control the epidemic by encouraging the public to adopt proper protective measures through official media and, when necessary, by implementing mandatory measures to promote appropriate preventive behaviors.
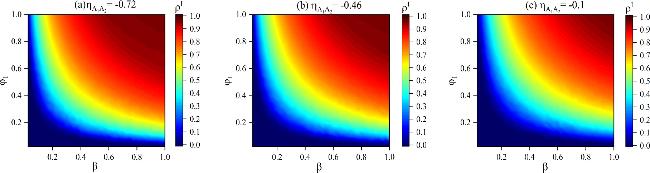
Figure 14. The function of epidemic scale ${\rho }^{I}$ with infection probability $\beta $ and attenuation factor ${\varphi }_{1}$. The negative correlation in different subplots is set as follows: (a) ${\eta }_{{A}_{1}{A}_{2}}=-0.72$, (b) ${\eta }_{{A}_{1}{A}_{2}}=-0.46$, (c) ${\eta }_{{A}_{1}{A}_{2}}=-0.1$. Other parameters are set as follows: $\lambda =0.2$, $f=0.3$$K=0.3$, ${\omega }_{2}=0.5$, ${\delta }_{1}=0.4$, ${\delta }_{2}=0.5$, $\mu =0.5$.

5. Conclusion

In this paper, we establish a three-layer ${U}_{1}{A}_{1}{U}_{1}-{U}_{2}{A}_{2}{U}_{2}\,-SIS$ coupled model that accounts for the impact of both official and civil information channels and their correlation on epidemic transmission. Specifically, the first layer represents the official information layer and the second layer represents the civil information layer. There is a correlation between the official information layer and the civil information layer, which influences the dynamic progression of the epidemic. For the reception of civil information, we constructed an acceptance strategy that includes rational judgment of infection risks and consideration of its correlation with official information. The third layer represents the epidemic transmission layer, which considers the impact of epidemic transmission on the information layers. A mutual coupling effect exists between the two information layers and the epidemic transmission layer. Subsequently, we formalized the model using a microscopic Markov chain method and derived the epidemic prevalence threshold. Then, we conducted extensive simulations to validate the feasibility and accuracy of the model. The main contributions of this study are:

1. Strengthening the positive correlation between official and civil information can increase the epidemic threshold and reduce the scale of the epidemic, whereas a stronger negative correlation amplifies the scale of epidemic transmission. However, the impact of the negative correlation between official and civil information on the epidemic threshold and transmission scale is weaker than that of the positive correlation. Therefore, strengthening the dissemination of official information and actively adopting positive civil information closely aligned with official guidance is essential for epidemic control.

2. When adopting civil information, individuals should more thoroughly assess infection risks based on their personal circumstances and the surrounding environment to determine whether to adopt the information, thereby contributing to more effective disease control.

3. Enhancing the ability of infected individuals to accurately understand official information is crucial for effective epidemic management and ensuring adherence to public health guidelines.

In summary, the correlation between official information and civil information plays a crucial role in disease prevention and control. This study provides important insights into how the co-evolution of associated information from official and civil discourses affects epidemic transmission and offers a basis for relevant authorities in managing both epidemic and control civil information.

Declarations

The authors declare that they have no conflict of interest.

This work was partially supported by the Project for the National Natural Science Foundation of China (72174121), and the Project Soft Science Research of Shanghai (24692116300), and the Program for Professor of Special Appointment (Eastern Scholar) at Shanghai Institutions of Higher Learning.

1
Morens D M, Folkers G K, Fauci A S 2004 The challenge of emerging and re-emerging infectious diseases Nature 430 242 249

DOI

2
Morens D M, Fauci A S 2013 Emerging infectious diseases: threats to human health and global stability PLoS Pathog. 9 e1003467

DOI

3
Zhang F W 2024 Monkeypox: can we count on the current smallpox immunization Virology 592 109994

DOI

4
Tai D Y H, Lew S J W, Puah S H 2025 Severe acute respiratory syndrome (SARS) and Middle Eastern respiratory syndrome (MERS) International Encyclopedia of Public Health(Third Edition) 3 138 152

DOI

5
Mattiuzzi C, Lippi G 2025 The impact of the COVID-19 pandemic on diabetes-related mortality Diabet. Epidemiol. Manag 17 100236

DOI

6
Li G 2023 Therapeutic strategies for COVID-19: progress and lessons learned Nat. Rev. Drug Discovery 22 449 475

DOI

7
Kermack W O, McKendrick A G 1927 Contributions to the mathematical theory of epidemics Proc. R. Soc. A 115 700

DOI

8
Gray A 2011 A stochastic differential equation SIS epidemic model SIAM J. Appl. Math. 71 876 902

DOI

9
McCluskey C C 2010 Complete global stability for an SIR epidemic model with delay—distributed or discrete Nonlinear Anal. Real World Appl. 11 55 59

DOI

10
Watts D J, Strogatz S H 1998 Collective dynamics of ‘small-world’ networks Nature 393 440 442

DOI

11
Pastor-S R, Vespignani A 2000 Epidemic spreading in scale-free networks Phys. Rev. Lett. 86 3200 3203

DOI

12
Govindankutty S, Gopalan S P 2024 Epidemic modeling for misinformation spread in digital networks through a social intelligence approach Sci. Rep. 14 19100

DOI

13
Sun H, Feng Y, Meng Q C 2024 Information dissemination behavior of self-media in emergency: considering the impact of information synergistic-hedging effect on public utility Expert Syst. Appl. 252 124110

DOI

14
Wang Z 2016 Statistical physics of vaccination Phys. Rep. 664 1 113

DOI

15
Sharma M 2024 Cost-effectiveness analysis of surgical masks, N95 masks compared to wearing no mask for the prevention of COVID-19 among health care workers: Evidence from the public health care setting in India PLoS One 19 e0299309

DOI

16
Kiss I Z 2010 The impact of information transmission on epidemic outbreaks Math. Biosci. 225 1 10

DOI

17
De Domenico M 2016 The physics of spreading processes in multilayer networks Nat. Phys. 14 523 523

DOI

18
Wang W 2016 Suppressing disease spreading by using information diffusion on multiplex networks Sci. Rep. 6 29259

DOI

19
Scatà M 2016 The impact of heterogeneity and awareness in modeling epidemic spreading on multiplex networks Sci. Rep. 6 37105

DOI

20
Pan Y H, Yan Z J 2018 The impact of multiple information on coupled awareness-epidemic dynamics in multiplex networks Physica A 491 45 54

DOI

21
Zhang L B, Guo C, Feng M Y 2022 Effect of local and global information on the dynamical interplay between awareness and epidemic transmission in multiplex networks. Chaos 32 083138

DOI

22
Zhang K B 2024 Interplay of simplicial information propagation and epidemic spreading on multiplex metapopulation networks Chaos, Solitons Fractals 180 114490

DOI

23
Granell C, Gómez S, Arenas A 2013 Dynamical interplay between awareness and epidemic spreading in multiplex networks Phys. Rev. Lett. 111 128701

DOI

24
Xia C Y 2019 A new coupled disease-awareness spreading model with mass media on multiplex networks Inf. Sci. 471 185 200

DOI

25
Guo Q T 2015 Two-stage effects of awareness cascade on epidemic spreading in multiplex networks Phys. Rev. E 91 012822

DOI

26
Xu J W 2024 Coupled epidemic dynamics with awareness heterogeneity in multiplex networks Chaos, Solitons Fractals 187 115335

DOI

27
Yuan X L 2025 Impacts of physical-layer information on epidemic spreading in cyber-physical networked systems arXiv:2503.06591

28
Zhang J, Wang N 2024 A multiple risk coupled propagation model for emergency information considering government information and government mandatory measures Expert Syst. Appl. 249 123725

DOI

29
Wang Z S 2021 Epidemic propagation with positive and negative preventive information in multiplex networks IEEE Trans. Cybernetics 51 1454 1462

DOI

30
Chen P Y 2022 Effects of individual heterogeneity and multi-type information on the coupled awareness-epidemic dynamics in multiplex networks Front. Phys. 10 964883

DOI

31
Mandal S 2021 Understanding the spread of prevention and cessation messages on social media for substance use in youth Aslib J. Inf. Manage. 73 240 253

DOI

32
Feng M Y 2023 The impact of nodes of information dissemination on epidemic spreading in dynamic multiplex networks Chaos 33 043112

DOI

33
Huang H, Chen Y, Ma Y F 2021 Modeling the competitive diffusions of rumor and knowledge and the impacts on epidemic spreading Appl. Math. Comp. 388 125536

DOI

34
Fang F S, Ma J, Li Y L 2023 The coevolution of the spread of a disease and competing opinions in multiplex networks Chaos, Solitons Fractals 170 113376

DOI

35
Li D D 2023 A multi-information epidemic spreading model on a two-layer network Inf. Sci. 651 119723

DOI

36
Li D D, Xie W J ,, Han D 2024 Multi-information and epidemic coupling propagation considering indirect contact on two-layer networks Appl. Math. Comput. 474 128700

DOI

37
Hu X 2024 Coupled propagation between one communicable disease and related two types of information on multiplex networks with simplicial complexes Physica A 645 129832

DOI

38
Du K, Fan R G 2024 SHI1I2R competitive information spreading model in online and offline two-layer networks in emergencies Expert Syst. Appl. 235 121225

DOI

39
Zhang H G 2022 The interaction of multiple information on multiplex social networks Inf. Sci. 605 366 380

DOI

40
Yin Q 2022 Impact of co-evolution of negative vaccine-related information, vaccination behavior and epidemic spreading in multilayer networks Commun. Nonlinear Sci. Numer. Simul. 109 106312

DOI

41
Roca C P, Cuesta J A, Sánchez A 2009 Evolutionary game theory: temporal and spatial effects beyond replicator dynamics Phys. Life Rev. 6 208 249

DOI

42
Gómez S 2010 Discrete-time Markov chain approach to contact-based disease spreading in complex networks Europhys. Lett. 89 38009

DOI

43
Vats D, Flegal J M, Jones G L 2019 Multivariate output analysis for Markov chain Monte Carlo Biometrika 106 321 337

DOI

44
Barabási A L, Albert R 1999 Emergence of scaling in random networks Science 286 509 5012

DOI

45
Backstrom L 2012 Four degrees of separation ACM: Proc. 4th Annual ACM Web Science Conf. 33 42

DOI

Outlines

/