


1. Introduction
The phenomenon where a small displacement occurs when an optical beam deviates from its geometrical path is known as the Goos–Hänchen shift (G–HS). This effect was first observed during an experiment involving total internal reflection by the scientists Goos and Hänchen [1]. Following this experimental observation of the small lateral shift, various structures were proposed and studied to explore the G–HS [2–9]. Due to its potential applications, the G–HS has garnered attention across different scientific disciplines. Applications of the G–HS span various fields, including nano- and micro-structures [10], plasma and quantum physics [11], graphene structures [12, 13], sensor development [14, 15], and phase conjugate mirrors [16]. Moreover, the G–HS has practical applications in optical sensing, enabling the measurement of parameters such as refractive index, surface roughness, beam angle, and dispersive medium irregularities [7, 17]. Utilizing the G–HS phenomenon, optical sensing techniques can provide important insights into the properties of various surfaces and materials. In recent years, the investigation of the G–HS has also focused on fixed cavities with different atomic media [18–24]. Nonetheless, studying the G–HS in the optical regime presents many challenges due to its small magnitude. Several techniques have been employed to enhance the G–HS, such as Kerr non-linearity [22] and the concept of parity-time symmetry [25]. The magnitude of the G–HS is very small, typically on the sub-wavelength scale in a single dielectric interface that can interrupt its applications. Therefore, researchers have employed various techniques to enhance its magnitude [26–28]. The magnitude of negative and positive G–HS can be enhanced using the phenomenon known as surface plasmon resonance. The large G–HS in the reflected light has been observed experimentally using the surface plasmon resonance (SPR) system [29]. Similarly, the enhanced magnitude of the G–HS has been investigated in other SPR structures [30].
Surface plasmon polaritons (SPPs) are a type of evanescent electromagnetic wave that can be generated at the metal–dielectric interface [31]. It can be excited in total internal reflection structures, where the wave vector mismatch can be compensated by the refractive index of a prism placed between the vacuum and the SPPs. When SPPs are generated at the metal interface, there is a reflection angle at the reflectivity of surface plasmon resonance. The wave number of the SPP can be expressed as ${k}_{\mathrm{spp}}={k}_{0}\sqrt{\tfrac{{\epsilon }_{{\rm{m}}}}{1+{\epsilon }_{{\rm{m}}}}}$, where k0 is the wave number of free space and εm is the permittivity of the metal. It should be noted that SPPs cannot be excited directly due to the mismatch of their wave numbers such that k0 < kspp; for any incident angle, the SPPs cannot be excited as k0sinθ < kspp. However, if a coupler such as a glass prism with a refractive index n > 1 is used, the incident wave number can be increased from k0 to nk0. This leads to the resonance condition k0nsinθ = kspp for a proper incident angle. This is the basic principle of surface plasmon resonance [32, 33]. The surface plasmon resonance can also be studied in different materials and schemes such as [34–36]. The electromagnetic field near the interface of the metal and dielectric is so strong that it can lead to the enhancement of the G–HS. When a silver layer is used, it can easily adjust the minimum reflectivity and enhance the G–HS [37]. Similarly, the measurement of the G–HS has been investigated using the Kretschmann–Raether configuration with a layer of gold [38].
In addition, previous investigations of surface plasmon resonance systems using couplers like prisms are not highly compatible with nano-optical devices. Some researchers have developed structured interfaces for the excitation of SPPs [39]. However, this approach can introduce complexity in the field of physics. This raises the question: is there a way to excite SPPs without using a coupler? The answer to this question was provided in a previous study where SPPs were excited without the use of a coupler [40]. In [40], SPPs were excited using a simple system consisting of a metal film and a bottom medium. Without considering a coupler, light was incident directly from the vacuum onto the metal, thereby exciting the SPPs. The critical point of this work was the condition that the permittivity of the bottom medium must be less than 1 such as εd < 1. Under this condition, the wave number of the SPP takes the form ${k}_{{\rm{s}}{\rm{p}}{\rm{p}}}={k}_{0}\sqrt{\frac{{\epsilon }_{{\rm{m}}}{\epsilon }_{{\rm{d}}}}{{\epsilon }_{{\rm{m}}}+{\epsilon }_{{\rm{d}}}}}$ where kspp < k0. Therefore, the resonance condition k0sinθ = kspp can be achieved for a certain incident angle θ.
The G–HS has attracted substantial attention due to its implications in photonics and plasmonic devices [41, 42]. The G–HS is particularly relevant in SPR systems where the evanescent wave interaction with metallic surfaces can lead to enhanced sensing capabilities [43, 44]. Understanding the GH shift in a coupler-free SPR system is essential for improving sensor performance and optical signal processing [45, 46]. Earlier studies have demonstrated that the GH shift can be manipulated by varying the angle of incidence, polarization state, and material properties of the interacting media [47, 48]. Theoretical and experimental investigations have been conducted to explore these dependencies, leading to innovative applications in precision metrology and quantum optics [49, 50]. Recent advancements in meta-surface engineering and hybrid plasmonic waveguides further open new possibilities for controlling light–matter interactions in these systems [51, 52]. In this work, we systematically analyze the G–HS in a coupler-free SPR system, highlighting its dependence on key physical parameters. We employ numerical simulations and experimental validation to offer insights into optimizing this shift for enhanced sensor applications [53–55]. Our findings provide a deeper understanding of light propagation at the nanoscale, contributing to the development of next-generation optical and plasmonic devices [56, 57].
The motivation for our recent study is inspired by previous research [40], where SPPs were excited without using any coupler. Our goal is to explore the characteristics of the G–HS using an SPR system that operates without a coupler. The G–HS has been extensively studied in various SPR systems that include a coupler [37, 38]. However, the inclusion of a coupler in SPR systems can sometimes be incompatible with optical devices. Motivated by the SPR structure proposed in [40], we aim to thoroughly investigate the phenomenon of the G–HS in a coupler-free SPR system. In this system, we have achieved enhanced negative and positive G–HS, reaching magnitudes of −4000λ and 6000λ, respectively. This remarkable enhancement of the G–HS demonstrates the potential of our proposed system to significantly advance the field of optical sensing and nano-optical devices.
2. Model
2.1. Coupler-free surface plasmon resonance system
A schematic diagram is presented in figure 1. The proposed system is based on a coupler-free SPR system utilizing all solid states. The system comprises three layers: top, middle and bottom. The top layer may consist of a vacuum, air or another transparent material. The middle layer is a metal film, while the bottom layer is a dielectric. The permittivities of the top, middle and bottom layers are denoted as ε1, ε2 and ε3, respectively. The relationship between the refractive indices and permittivities is given by ${\epsilon }_{i}={n}_{i}^{2}$ where i = 1, 2, 3. The reflection coefficient for the three layers can be easily calculated using the Fresnel formula [32]
$\begin{eqnarray}\displaystyle \begin{array}{r}r=\frac{{r}_{12}+{r}_{23}{\rm{e}\,}^{2\rm{i}{k}_{2x}d}}{1+{r}_{12}{r}_{23}{\rm{e}}^{2\,\rm{i}{k}_{2x}d}},\end{array}\end{eqnarray}$
where r12 is the reflection coefficient of the top and middle layers whereas r23 is the reflection coefficient of the middle and bottom layers. Here, d is the thickness of the metal film. The expressions of r12 and r23 for the transverse magnetic (TM) mode can be represented as $\begin{eqnarray}\displaystyle \begin{array}{r}{r}_{12}=\frac{{\epsilon }_{2}{k}_{1x}-{\epsilon }_{1}{k}_{2x}}{{\epsilon }_{2}{k}_{1x}+{\epsilon }_{1}{k}_{2x}},\end{array}\end{eqnarray}$
$\begin{eqnarray}\displaystyle \begin{array}{r}{r}_{23}=\frac{{\epsilon }_{3}{k}_{2x}-{\epsilon }_{2}{k}_{3x}}{{\epsilon }_{3}{k}_{2x}+{\epsilon }_{2}{k}_{3x}}.\end{array}\end{eqnarray}$
Here, the normal wave vectors can be represented by kix and expressed as $\begin{eqnarray}\begin{array}{r}{k}_{ix}=\sqrt{{k}_{0}^{2}{\epsilon }_{i}-{k}_{z}^{2}},\end{array}\end{eqnarray}$
where kz is known as a parallel wave vector that can be represented as kz = k0n1sinθ. In a similar fashion, the transmission coefficient can also be calculated as $\begin{eqnarray}\displaystyle \begin{array}{r}t=\frac{{t}_{12}{t}_{23}{\rm{e}\,}^{\rm{i}{k}_{2x}d}}{1+{r}_{12}{r}_{23}{\rm{e}}^{2\,\rm{i}{k}_{2x}d}},\end{array}\end{eqnarray}$
where tij = 1 + rij whereas i, j = 1, 2, 3 that can be derived using boundary conditions. The reflectivity (R) and transmission (T) can be achieved by R = ∣r∣2 and R = ∣t∣2.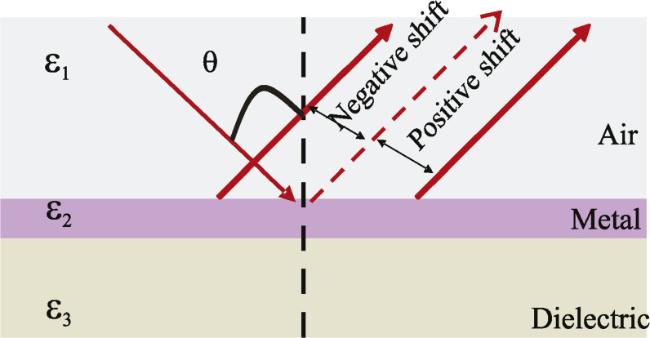
Figure 1. The schematics of surface plasmon resonance system where a beam is incident and interacts with the structure. |
2.2. Theoretical formalism of the G–HS
We consider a coupler-free SPR system where a TM-mode is incident from a vacuum, as shown in figure 1. The incident wave makes an angle θ with respect to the SPR system. The incident light can be reflected through the system with a G–HS. The mathematical expression for the G–HS in the reflected shift can be calculated using the stationary phase theory [58–61] as
$\begin{eqnarray}{S}_{{\rm{r}}}=-\frac{\lambda }{2\pi }\frac{\rm{d}\,{\phi }_{{\rm{r}}}}{\,\rm{d}\theta },\end{eqnarray}$
where φr is the phase associated with the reflection coefficient. The expression for the G–HS in the reflected beam can be expressed in a more simple form as [18, 19] $\begin{eqnarray}\begin{array}{l}{S}_{{\rm{r}}}=-\displaystyle \frac{\lambda }{2\pi | r{| }^{2}}\left\{\,\rm{Re}\,[r]\displaystyle \frac{\,\rm{d}\rm{Im}\,[r]}{\,\rm{d}\,\theta }\right.\left.-\,\rm{Im}\,[r]\displaystyle \frac{\,\rm{d}\rm{Re}\,[r]}{\,\rm{d}\,\theta }\right\}.\end{array}\end{eqnarray}$
3. Results and discussion
It has been established earlier that coupler-free SPR can be achieved by considering a simpler system [40]. This system comprises a metal film, such as titanium, and a substrate like silicon oxide (glass) or aluminum oxide, as depicted in figure 1. In this configuration, we have three layers: air, metal and a substrate. The thickness of the air and substrate are considered semi-infinite media, while the thickness of the metal film is d. The permittivity of the substrate must satisfy the condition 0 < Re(ε3) < 1 and Im(ε3) << 1. It is also emphasized that the incident light is infrared and makes an angle θ with the normal. We present a 3D spectrum of reflectivity R and transmissivity T versus the incident angle θ and the wavelength of light λ, as depicted in figure 2. It is observed that the reflectivity is high for shorter wavelengths of light and decreases as the wavelength increases for specific incident angles (see figure 2(a)). Additionally, the transmission spectrum (field enhancement) versus the incident angle θ and the wavelength of light is shown in figure 2(b). Interestingly, the field enhancement increases as the wavelength of the incident light increases for specific angles. The decrease in reflectivity and the increase in field enhancement for specific angles indicate the excitation of SPPs, resulting in SPR.
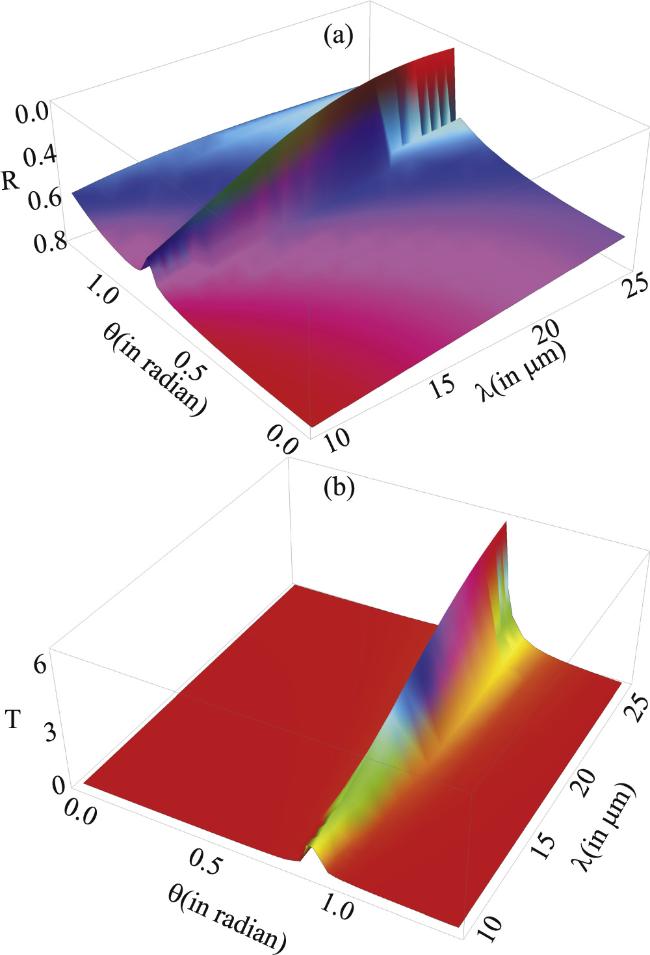
Figure 2. The reflectivity (R) and transmission (T) curve is plotted versus incident angle θ and wavelength of light λ. The parameters are n1 = ε1 = 1, d = 40 nm, ε2 = −382.76 + 115.49i, ε3 = 0.5929 + 0.0043i. |
We are investigating the G–HS in the reflected beam when SPPs are excited. We connect the excitation of SPPs with the magnitude of the G–HS in the reflected light. The wavelength of infrared light plays a key role in the excitation of SPPs, which can be linked to the enhancement of the G–HS. Here, the reflectivity curve is known as the SPR curve. When a reflection dip occurs, the SPPs are excited, leading to a change in the phase of the reflected light. It should be noted that the sharper the phase jump, the greater the magnitude of the G–HS, and vice versa. We present the spectrum of phase, reflectivity and G–HS for different wavelengths of light versus incident angle θ as depicted in figure 3. Initially, we consider the wavelength of light λ = 10 μm and show the phase, reflectivity, and G–HS in the reflected light, indicated by the blue curves in figure 3. The SPR curve shows a reflection dip around θ = 0.884 radian with a corresponding phase change. This indicates that SPR, based on a coupler-free system, is excited. At the same incident angle θ, we observe a negative G–HS in the reflected light, as shown by the blue curve in figure 3(c). The G–HS for this wavelength of light attains −7λ. For further increments of the wavelength of light from 10 μm to 13 μm, we again present the spectra of phase, reflectivity and G–HS versus θ, as depicted by the red curves in figure 3. The dip in the SPR curve increases and slightly shifts to θ = 0.887 radian with the corresponding phase change. This indicates that the excitation of SPPs increases with the increasing wavelength of light. Here, the phase shown by the red curve is slightly sharper than that of the blue curve, indicating that the G–HS must be greater than the previous one. The magnitude of the G–HS slightly increases, attaining a value of value −11λ. We gradually increase the wavelength of light and show the spectra of phase, reflectivity and G–HS versus θ for different values of λ, such as 16 μm, 19 μm, 21 μm and 22 μm, indicated by the black, green, yellow and gray curves in figure 3. This clearly indicates that the dips of the SPR curves increase with increasing wavelengths of light. When the dips of the SPR curves approach zero, one can achieve strong excitations of the SPPs in the proposed structure. We also note that the phase, dips in reflectivity, and the G–HS slightly vary with the incident angle θ as the wavelength of light increases. In figure 3, the maximum negative shift of −60λ is achieved λ = 22 μm at θ = 0.898 radians. For θ = 0.898 radians, the phase change is sharp, and the SPR curve approaches zero, which is the cause of the enhanced G–HS. Remarkably, the SPPs can be greatly excited for certain wavelengths of light in our proposed system. This means that the dip of the SPR curve must approximately equal zero. To explore this achievement, we consider the λ are λ = 24.3 μm, λ = 24.4 μm, λ = 24.42 μm and λ = 24.45 μm. We present the spectra of phase, reflectivity and G–HS versus θ as depicted in figure 4. In figure 4(a), the red curve is flatter compared to the green curve, while the blue and black curves fall in between the red and green curves. The corresponding dips of the SPR curves are shown in figure 4(b). The sharp change in phase (green curve in figure 4(a)) and the deep dip in the SPR curve (green curve in figure 4(b)) indicate a very strong excitation of the SPPs in our system at λ = 24.45 μm. This leads to a very large negative G–HS of approximately −4000λ at θ = 0.9019 radians, as shown by the green curve in figure 4(c).
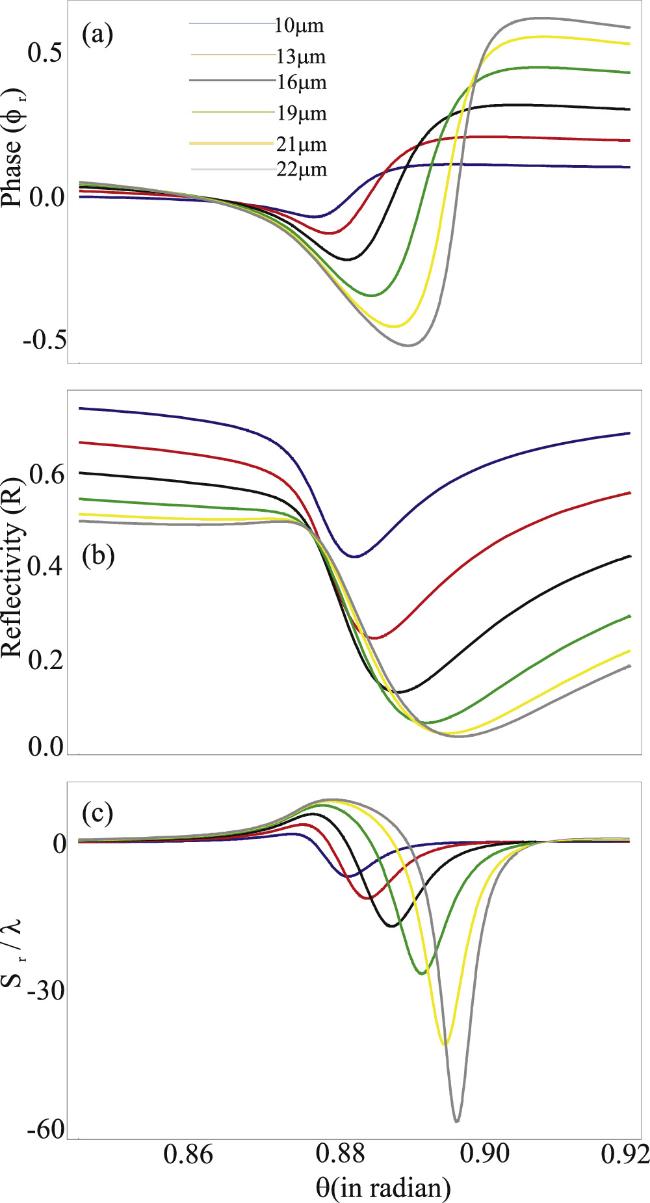
Figure 3. (a) The phase of the reflected light versus θ where for blue curve (λ = 10 μm), red curve (λ = 13 μm), black curve (λ = 16 μm), green curve (λ = 19 μm), yellow curve (λ = 21 μm) and gray curve (λ = 22 μm). (b) The reflectivity (R) versus θθ where the wavelengths remain the same as shown in (a). (c) The G–HS in reflected light versus θ where the wavelengths remain the same as shown in (a). The remaining parameters are the same as shown in figure 2. |
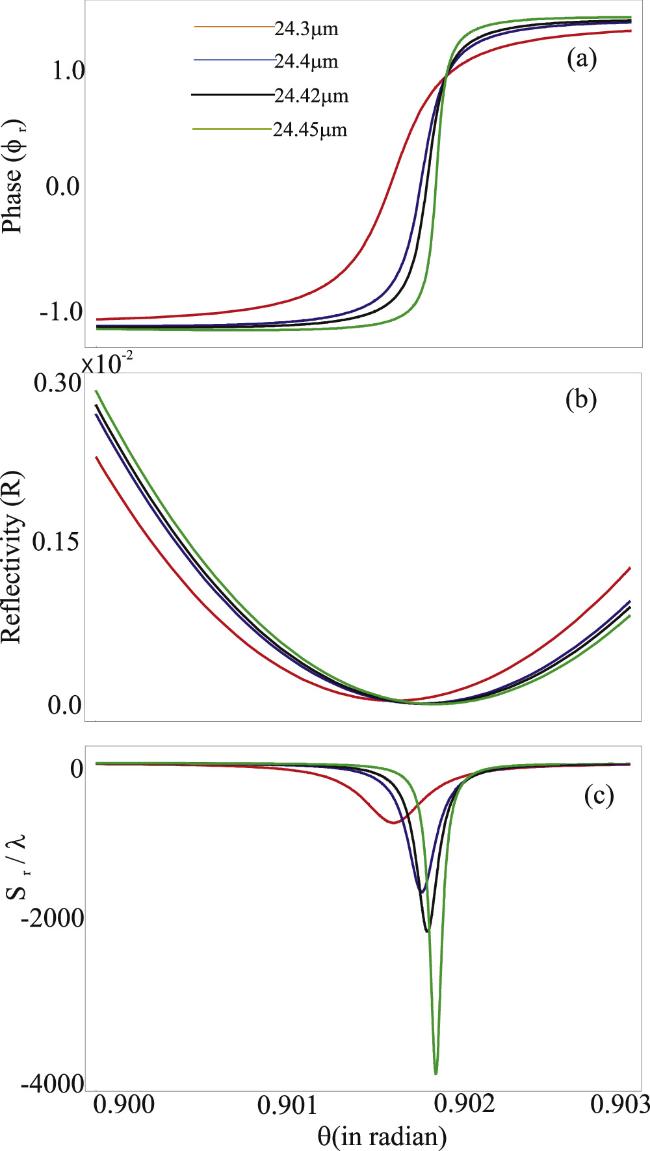
Figure 4. (a) The phase of the reflected light versus θ where for red curve (λ = 24.3 μm), blue curve (λ = 24.4 μm), black curve (λ = 24.42 μm) and green curve (λ = 24.45 μm). (b) The reflectivity (R) versus θθ where the wavelengths remain the same as shown in (a). (c) The G–HS in reflected light versus θ where the wavelengths remain the same as shown in (a). The remaining parameters are the same as shown in figure 2. |
It should be noted that the G–HS can be either positive or negative, depending on various factors. A positive G–HS is typically observed when light undergoes total internal reflection, wherein the evanescent wave propagates along the interface. Additionally, the polarization of light influences the sign of the shift, with distinct variations observed between TM and TE modes. The G–HS associated with TM-polarized light can differ significantly from that of TE-polarized light. For TM-polarized light, the interaction between its electric field components and the interface affects the phase shift, potentially resulting in either a negative or positive displacement. In contrast, for TE-polarized light, the G–HS is generally less pronounced, though its sign may still vary depending on the material properties. Furthermore, negative refractive media significantly impacts the sign of the G–HS, often resulting in a negative shift. The SPR system also plays a crucial role in determining the sign of the G–HS. When light couples with SPPs at a metal interface, an enhanced G–HS can be observed. This interaction with SPPs may lead to either a positive or negative shift, depending on the resonance conditions. A positive G–HS occurs when the surface plasmon waves propagate in the same direction as the incident light, whereas a negative G–HS arises when the surface plasmon waves travel in the opposite direction to the incident light. In summary, the occurrence of positive and negative G–HS is governed by a complex interplay of factors, including the angle of incidence, polarization, refractive index contrast, dispersion, surface interactions, material properties, and beam characteristics. The G–HS can be controlled from negative to positive and vice versa by external parameters [18–24]. In our proposed system, we find that the sign of G–HS can be changed from negative to positive or vice versa by varying the wavelength of incident light. We plot the reflectivity and G–HS in the reflected light versus θ for different values of the wavelength of light, such as λ = 24.51 μm, λ = 24.54 μm, λ = 24.57 μm, and λ = 24.59 μm, as shown in figure 5. We find positive G–HS in the reflected light for all the above wavelengths. Remarkably, enhanced positive G–HS is achieved for λ = 24.51 μm at an incident angle of around θ = 0.902 radian. At this incident angle, the magnitude of the G–HS reaches approximately 5000λ. Additionally, at this incident angle, the reflectivity tends to zero, leading to maximum excitation of the SPPs. This maximum excitation of the SPPs then enhances the G–HS in the reflected light. For further increases in the wavelength of light, the magnitude of the G–HS decreases gradually, as seen in figure 5(b). Furthermore, it is necessary to highlight the importance of the incident angle θ and the wavelength of light λ in our proposed system. The excitation of SPPs and the existence of the G–HS mainly depend upon θ and λ. Initially, we consider the incident angle θ = 0.9019 radian and plot the G–HS versus wavelength ranging from 23 μm to 25 μm, as shown by the red curve in figure 6. The spectrum shows that for small wavelengths of light, the magnitude of the negative G–HS is small and increases with the increase in the wavelength of light. The negative G–HS reaches its maximum value around λ = 24.45 μm and then suddenly switches to positive G–HS with further increases in the wavelength of light. Conversely, we consider the incident angle θ = 0.902 radian and plot the G–HS versus wavelength of light, as depicted by the black curve in figure 6. This time, we obtain negative G–HS for small wavelengths of light, and at a certain wavelength of light, the sign of the G–HS switches from negative to positive, reaching its maximum value of around 6000 λ for a wavelength of λ = 25.51 μm. With further increments, the magnitude of the G–HS decreases, as shown by the black curve in figure 6. The inset in figure 5 shows that the magnitude of the G–HS is not zero when the wavelength varies from 23 μm to 24.2 μm.
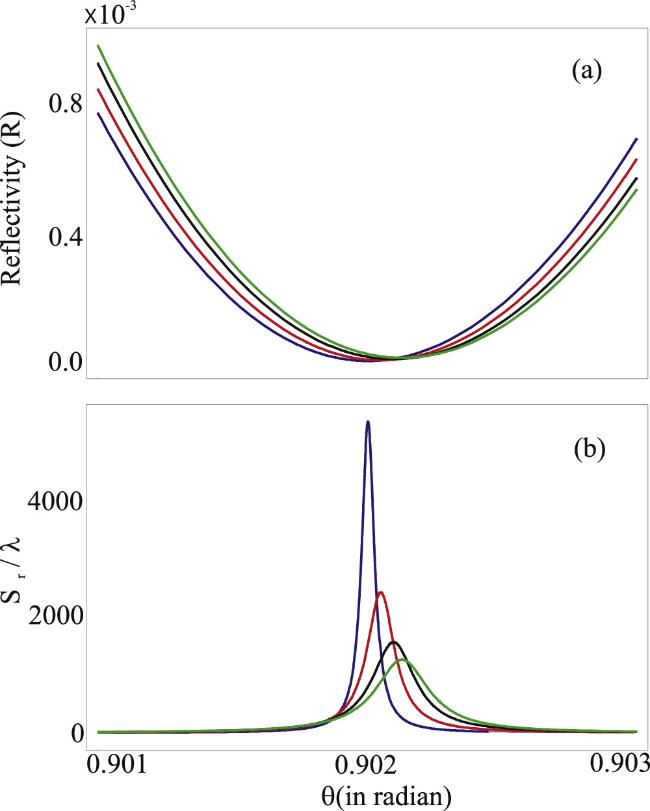
Figure 5. (a) The reflectivity (R) versus θ for the blue curve (λ = 24.51 μm), red curve (λ = 24.54 μm), black curve (λ = 24.57 μm) and green curve (λ = 24.59 μm) (b) The G–HS in reflected light versus θ where the wavelengths remain the same as shown in (a). The remaining parameters are the same as shown in figure 2. |
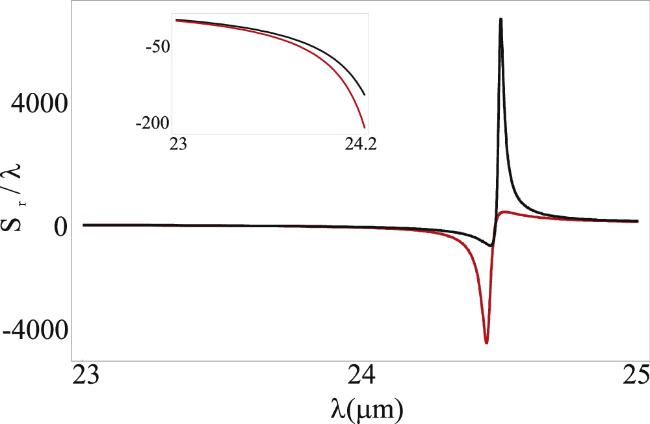
Figure 6. The G–HS in reflected light versus λ for θ = 0.9019 radian (red curve) and θ = 0.902 radian (black curve). The remaining parameters are the same as shown in figure 2. |
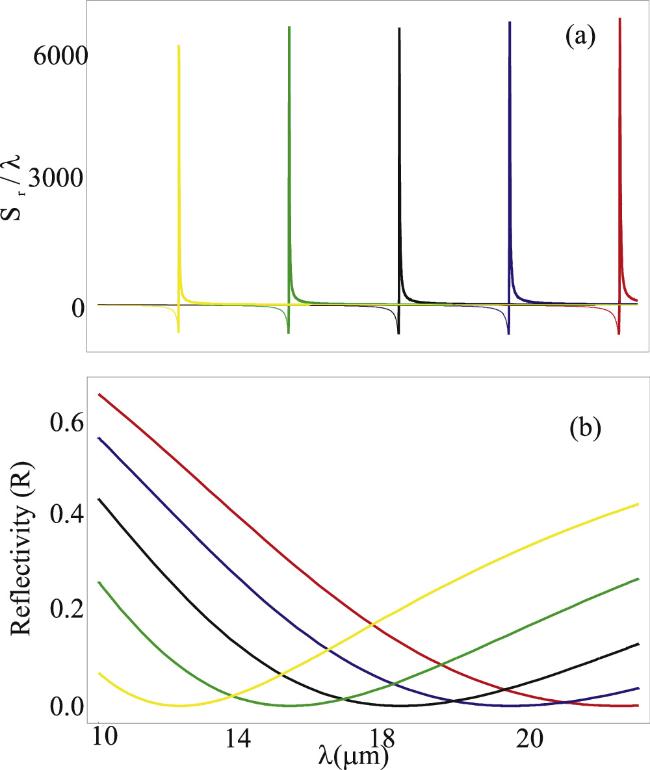
We found a strong connection between the wavelength of light and metal thickness in the observation of SPR and the G–HS. For a specific incident angle, the dip in the reflectivity and G–HS varies with the wavelength of light under the variation of metal film thickness. This behavior is shown in figure 7, where the reflectivity and G–HS in the reflected light are plotted versus the wavelength of light for different values of the metal film thickness. In figure 6, we consider the incident angle θ = 0.902 radian and show a spectrum of G–HS and R versus λ. When the thickness of the metal film is d = 40 nm, we observe an enhanced G–HS in the reflected light and a dip in the reflectivity at a wavelength λ ≈ 24.5 μm (see the red curves). When the value of d is reduced from 40 nm to 35 nm, the enhanced G–HS and the dip in the reflectivity shift to λ ≈ 21.4 μm (see the blue curves). Similarly, by further reducing the value of d, the enhanced G–HS and the dip in the reflectivity shift to shorter wavelengths of light, as shown by the black, green and yellow curves. From this analysis, we claim that the excitation of SPPs and G–HS depends upon the wavelength of light and metal thickness. For smaller thicknesses, shorter wavelengths of light are required and vice versa.
Figure 7. (a) The G–HS in reflected light versus λ by considering θ = 0.902 radian whereas d = 40 nm (red curve), d = 35 nm (blue curve), d = 30 nm (black curve), d = 25 nm (green curve) and d = 20 nm (yellow curve). (b) The reflectivity versus λ by considering θ = 0.902 radian, the thickness of metal film d and the color of the curves remains the same as considered in (a). The remaining parameters are the same as shown in figure 2. |
4. Conclusion
In conclusion, we explored the G–HS of reflected light in a coupler-free SPR system. Both negative and positive G–HS are attained under the variation of incident light. The magnitude of the G–HS strongly depends on the excitation of the SPPs in the proposed system. We also investigated a strong connection between the wavelength of light and metal thickness in the observation of SPR and the G–HS. The maximum excitation of the SPPs and enhanced G–HS can be shifted to different wavelengths of light by varying the film thickness. Fascinatingly, giant negative and positive G–HS of reflected light are attained in the proposed system.