


1. Introduction
The detection of gravitational waves (GWs) by LIGO [1] and Virgo [2] collaborations heralds a new era in both astrophysics and fundamental physics [3–8]. During the third observing run (O3), Advanced LIGO, Advanced Virgo and KAGRA added 79 GW events, as detailed in GWTC-2.1 [7] and GWTC-3 [8]. These discoveries deepen our understanding of the Universe and provide powerful tools to check the rules of gravitational theories such as general relativity (GR), and help us better understand the basic structure of spacetime.
According to GR, GWs are theorized to propagate at the speed of light in a vacuum, and their velocity vg is predicted to be invariant across all frequencies. This characteristic suggests that the propagation speed of GWs is unaffected by frequency, ensuring uniformity in the velocity across different wavelengths. The GWs detected by Advanced LIGO and Advanced Virgo can be used to make statistical inferences about vg [9–11, 13], and the speed of GWs can be constrained within the range of $0.9{9}_{-0.02}^{+0.01}c$ at a 90% credible interval [11]. It is also possible to use the arrival times and time delays of GWs and their electromagnetic (EM) counterparts based on the strong lensing effect to constrain the speed of GWs [12]. In the framework of the quantum gravity theory, gravitons are postulated to be carriers for transmitting gravitational interactions. GWs travel at the speed of light across all frequencies which supports the idea that gravitons are massless.
However, certain modified gravitational theories typically anticipate violations of Lorentz invariance (LI) [14–21], indicating that the speed of GWs might not always align with the speed of light and could vary based on their frequencies during propagation [16, 18, 20, 22]. These theories imply that gravitons may possess a rest mass that is not equal to zero. We use modified dispersion relations to depict these theories [24], and we focus our discussion on a specific scenario, which is the massive gravity [23]. It is hypothesized that low-frequency GWs propagate slower than high-frequency GWs. Consequently, during the inspiral phase of compact binary stars, gravitons emitted earlier have a lower propagation speed than those emitted later. This phenomenon induces phase alterations in GWs during propagation, resulting in received waveforms that differ from those predicted by GR. It should be emphasized that we do not consider potential amplitude corrections or higher-mode distortions. If such dephasing of waveforms comparing with GR's templates is not detected, this could imply a constraint on the graviton mass, thereby limiting the potentially extent of LI violation. The graviton mass has been measured through various experimental datasets [25–30].
Similarly to the impact of the massive gravity, if the weak equivalence principle (WEP) is violated, the speed of GWs will no longer be the speed of light but will depend on the frequencies. This frequency dependence allows us to limit the extent of WEP violation. The violation of WEP results in different Shapiro delays [31] for different massless particles traversing an identical gravitational field. The Shapiro delay is proportional to γ + 1, where γ is the parametrized post-Newtonian parameter (γ = 1 in general relativity) [32, 33], and different massless particles will have different values of γ during free fall in a gravitational field if WEP is violated. It is often considered that two different massless particles are emitted from the same astrophysical source, with respective values of γ1 and γ2, then ∣Δγ∣ (∣γ1 − γ2∣) can be used to quantitatively represent the violation of the WEP. If we know the intrinsic time delay of these two particles, we can limit the difference in the Shapiro time delay between the two particles Δtgra [34] which is proportional to ∣Δγ∣, by measuring the observed time-delays Δtobs. Therefore, we can establish an upper limit for ∣Δγ∣ by observing the Δtobs of various signals emitted from the same source. Several constraints on ∣Δγ∣ have been derived from various astrophysical events, including the emissions from the supernova event SN 1987A [34, 35], gamma-ray bursts [36–41] and fast radio bursts (FRBs) [42–45]. In this study, we use GWs to test WEP, which had previously been employed [46–49]. The utilization of GW signals can eliminate the intrinsic time delay when signals are emitted, which will enable us to estimate the up-limit of ∣Δγ∣ more accurately.
Building on the previously discussed framework, we further explore the phenomena of massive gravity and WEP violation, both of them modify the speed of GWs resulting in frequency dependence. Specifically, if gravitons possess mass, the speed of gravitons emitted during the early inspiral phase of GW emission is expected to be lower than that emitted later. Consequently, the impact of this effect on the GW waveform is expected to become more pronounced as the luminosity distance of GW events from Earth increases. This is consistent with the behavior under WEP violation, where the influence of gravitational fields leads to cumulative effects as the luminosity distance of the GW increases. However, it is essential to note that WEP violation manifests through changes in the speed of GWs due to the influence of gravitational fields.
In this study, our analysis focuses on the gravitational potential generated by the Milky Way, under the assumption that its entire mass is concentrated at the center. Owing to the unclear details of the host galaxies and galaxies along the propagation paths of these events, we neglect the time delays caused by these galaxies. This approach renders the constraints in our study very conservative, as the impacts from the host galaxy and other galaxies may possess similar or even greater magnitude compared to those from the Milky way. Therefore, the actual values of ∣Δγ∣ might be several times smaller than our results.
The remainder of this paper is organized as follows. Section 2 introduces our methodology for analyzing the specific dispersion of GWs. In section 3 , we present our results for 22 GW events. Conclusions and discussions are presented in section 4 .
2. Method
We use the common phenomenological modification to GR introduced in [24], which was previously applied to LIGO and Virgo data in [26–28, 50]: 1 ) to denote different modified dispersion relations in different alternative gravitational theories. In this study, we only consider the scenarios where α = 0 and A0 > 0, for which the graviton mass is given by ${m}_{g}={A}_{0}^{1/2}/{c}^{2}$, following the framework of massive gravity [23].
$\begin{eqnarray}{E}^{2}={p}^{2}{c}^{2}+{A}_{\alpha }{p}^{\alpha }{c}^{\alpha },\end{eqnarray}$
where c is the speed of light, E and p are the energy and momentum of the GWs, respectively, Aα and α are phenomenological parameters. With different Aα and α, we can use equation (The modified gravitational theory will lead to a difference in the dispersion relation of GWs, which will lead to the propagation of GWs at a speed different from that of light. Therefore, a modified waveform template that includes such effects is generally used to describe the waveform of GWs, which is expressed in the frequency domain as follows
$\begin{eqnarray}\tilde{h}(f)=\tilde{A}(f){{\rm{e}}}^{{\rm{i}}[{{\rm{\Psi }}}_{{\rm{GR}}}(f)+\delta {\rm{\Psi }}(f)]},\end{eqnarray}$
where $\tilde{A}(f)$ denotes the complex amplitude, $\Psi$GR(f) denotes the complex phase predicted by GR, and δ$\Psi$(f) is the modification term. In the scenarios where α = 0 and A0 > 0, it is given by [24] $\begin{eqnarray}\delta {{\rm{\Psi }}}_{\alpha =0}(f)=-\frac{\pi {D}_{0}{A}_{0}}{{h}^{2}c(1+z)f},\end{eqnarray}$
where z is the cosmological redshift, h is the Planck constant, f is the frequency of the GWs, and D0 is the distance parameter given by $\begin{eqnarray}{D}_{0}=\frac{c(1+z)}{{H}_{0}}{\int }_{0}^{z}\frac{{(1+\tilde{z})}^{-2}{\rm{d}}\tilde{z}}{\sqrt{{{\rm{\Omega }}}_{M}{(1+\tilde{z})}^{3}+{{\rm{\Omega }}}_{{\rm{\Lambda }}}}},\end{eqnarray}$
where H0 = 67.90km s−1 Mpc−1 is the Hubble constant, Ωm = 0.3065 and ΩΛ = 0.6935 are the matter and dark energy density parameters, respectively. These are the TT+lowP+lensing+ext values from [54].The Shapiro time delays generated during the propagation of GWs will also induce frequency-dependent variations in their speed owing to the violation of WEP. Here, we assume that δ$\Psi$(f) is caused by WEP deviation. Considering a GW event, GWs emitted at te and ${t}_{{\rm{e}}}^{{\prime} }$ with different frequencies are received by the detectors at the corresponding arrival times ta and ${t}_{{\rm{a}}}^{{\prime} }$. We can ignore the cosmological inflation effect if the difference in emitting time (${\rm{\Delta }}{t}_{{\rm{e}}}={t}_{{\rm{e}}}-{t}_{{\rm{e}}}^{{\prime} }$) is so small that the difference in the arrival times of the corresponding GWs (${\rm{\Delta }}{t}_{{\rm{a}}}={t}_{{\rm{a}}}-{t}_{{\rm{a}}}^{{\prime} }$) is
$\begin{eqnarray}{\rm{\Delta }}{t}_{{\rm{a}}}=\left(1+z\right)[{\rm{\Delta }}{t}_{{\rm{e}}}+{\rm{\Delta }}{t}_{{\rm{gra}}}].\end{eqnarray}$
In this study, we only consider the violation of the WEP caused by the Milky Way, and Δtgra would be [47]6 ) for calculating Shapiro delay on cosmological scales [56], as these concerns extend beyond the current study's scope, we exclude them from our analysis. Then, we obtain δ$\Psi$(f) [49]
$\begin{eqnarray}\begin{array}{rcl}{\rm{\Delta }}{t}_{{\rm{gra}}} & = & {\rm{\Delta }}\gamma \left[\frac{G{M}_{{\rm{MW}}}}{{c}^{3}}\right.\\ & & \left.\times {\rm{ln}}\,\left(\frac{\left[d+{({d}^{2}-{b}^{2})}^{1/2}\right]\left[{r}_{G}+{s}_{n}{\left({r}_{G}^{2}-{b}^{2}\right)}^{1/2}\right]}{{b}^{2}}\right)\right],\end{array}\end{eqnarray}$
where the Milky Way mass MMW ≈ 6 × 10¹¹M⊙ and the distance from the Sun to the center of the Milky Way rG ≈ 8 kpc, d denotes the distance from the GW event to the Milky Way center, b represents the impact parameter of the GW paths relative to the center of the Milky Way. We use a transform formula [55] to convert the celestial coordinates to b. sn = +1 denotes the GW event positioned in the direction of the Milky Way center, and sn = − 1 denotes the GW event positioned away from the Milky Way center. However, Minazzoli et al have raised concerns about the application of equation ( $\begin{eqnarray}\begin{array}{l}\delta {\rm{\Psi }}(f)=\frac{\pi {\rm{\Delta }}\gamma (1+z){f}^{2}}{{\rm{\Delta }}f}\left[\frac{G{M}_{{\rm{MW}}}}{{c}^{3}}\right.\\ \times {\rm{ln}}\,\left.\left(\frac{\left[d+{({d}^{2}-{b}^{2})}^{1/2}\right]\left[{r}_{G}+{s}_{n}{\left({r}_{G}^{2}-{b}^{2}\right)}^{1/2}\right]}{{b}^{2}}\right)\right],\end{array}\end{eqnarray}$
where ${\rm{\Delta }}f=f-{f}^{{\prime} }$ and $f,\,{f}^{{\prime} }$ are two different frequencies of GWs in a single event. It is intuitive to assume that γ is proportional to the particle energy. Considering E = hf, we assume that Δγ ∝ Δf.In this study, we employ the BILBY Bayesian parameter estimation software [52] and the DYNESTY nested sampling package [53] to perform parameter estimation. We use the parametrized waveform model described in equation (2 ), which incorporates modification terms into the IMRPhenomXP waveforms [51]. These modifications are designed to estimate parameters mg and Δγ using the selected GW events in GWTC-2.1 and GWTC-3. The GW strain data are obtained from the Gravitational Wave Open Science Center (GWOSC), which is publicly accessible at [https://gwosc.org/]. For the parameter priors, we adopt BILBY's default settings for binary black holes (BBHs) [52] except for mg and Δγ. For Δγ, we select a modified logarithmic prior that encompasses both negative and non-negative values (refer to equation (6) in [49]). Furthermore, inspired by this approach, we similarly define the prior distribution for mg as
$\begin{eqnarray}{m}_{g}(\alpha )=\left\{\begin{array}{ll}1{0}^{-\frac{1}{\alpha }}, & \,\rm{for}\,\alpha \gt 0,\\ 0, & \,\rm{for}\,\alpha =0,\end{array}\right.\end{eqnarray}$
where α is a uniform distribution parameter. Based on previous studies, we set the prior range for mg as [0, 10−20eV c−2] and for Δγ as [−10−7, 10−7].If deviations are present, indicating non-zero values for mg or Δγ. Specifically, in the context of massive gravity, we hypothesize that an increase in the luminosity distance of the GW event correlates with a more pronounced impact on the GW signal. For WEP violation, we hypothesize that the impact on the GW signal intensifies as the propagation path of the GWs approaches closer to the center of the Milky Way, and also increases with increasing luminosity distance of the GW event.
We can use the Bayes factor to directly compare the advantages and disadvantages of the modified models and the standard model using real GW data,
$\begin{eqnarray}{{\rm{BF}}}_{B}^{A}=\frac{{{ \mathcal Z }}_{A}}{{{ \mathcal Z }}_{B}},\end{eqnarray}$
where ${{ \mathcal Z }}_{A}$, ${{ \mathcal Z }}_{B}$ are the Bayesian evidences of models A and B. To enhance the data's intuitiveness, we use the natural logarithm of the Bayes factor, $\begin{eqnarray}{\mathrm{ln}}\,{{\rm{BF}}}_{B}^{A}=\,{\mathrm{ln}}\,({{ \mathcal Z }}_{A})-\,{\mathrm{ln}}\,({{ \mathcal Z }}_{B}).\end{eqnarray}$
Massive gravity and the violation of WEP induce frequency-dependent variations in the propagation speed of GWs. Assuming that the impact of GW waveforms caused by WEP violation is solely attributable to the Milky Way, it follows that as the angle between the GW event and the Milky Way center as observed from Earth gradually decreases, its impact should become more pronounced. Conversely, the impact of GW waveforms caused by massive gravity should be independent of the angles of GW events and would uniformly affect the propagation of GWs through spacetime across all directions. This impact is expected to exhibit cumulative effects over the propagation distance. In other words, as the propagation time of GW increases, so does the luminosity distance of the GW events, the deviation of GW waveforms will become increasingly evident. We can elucidate this phenomenon using equation (2 ), where a larger luminosity distance corresponds to a greater variation in δ$\Psi$. This variation enables the differentiation of the GW waveform from the one predicted by GR. Thus, this induces an increasing impact on the GW waveform as the luminosity distance of the GW event increases.
Thus, as the luminosity distance of GW events increases, the Bayes factor between the massive gravity and the standard model derived from GWs data will increase. We also hypothesize that the potential impact of the WEP violation would be magnified as the luminosity distance of GW events increases and the angle decreases. Consequently, the Bayes factor comparing WEP violation model to the standard model based on GW data should exhibit higher values, indicating more pronounced WEP violation effects. Conversely, lower values indicate weaker effects.
3. Results
Our data is based on GW events of BBH in GWTC-2.1 and GWTC-3. We select GW events that exhibit a SNR greater than 10. We calculate the angle between each GW event and the center of the Milky Way as observed from Earth. Using the median of the posterior distribution of angles as the reference value, we approximately uniformly select GW events across the entire range of angles. We divide the angles into six sections, each covering a 30 degree interval, and select 3 to 5 GW events for each section. In this selection, events within 0 to 30 degrees and 150 to 180 degrees are relatively rare. For events with similar angles, we select the one with higher SNR to do the analysis. Following this methodology, we then obtain 22 suitable GW events.
Figures 1 and 2 illustrate the posterior distributions of mg and Δγ for a subset of events (90% credible interval), respectively. The prior distribution of mg follows the distribution presented in equation (8 ). The prior distribution of Δγ follows the distribution presented in equation (6) in [49], which provides continuous coverage for both negative and non-negative Δγ value. The detailed posterior information of Δγ and mg for each event is tabulated in table 1. Figures 3 and 4 present a comparison of our results with those from previous studies [26–28, 49]. For the results of mg, the GWTC-1, GWTC-2, and GWTC-3 results utilized uniform priors for the phenomenological parameters Aα, whereas the prior distribution we adopted is shown in equation (8 ). For Δγ, we employed the same prior as used in GWTC-1. Furthermore, the potential data-quality issues inherent in GW observations have been discussed in studies [7, 8]. The short duration glitches can affect the identification of GW signals and the measurements of the source parameters. It is crucial to acknowledge that our method could not measure the exact values of mg and ∣Δγ∣. This limitation arises from the assumption that all observation errors are attributable to the deviation arise from massive gravity and WEP violation. Consequently, the results presented here represent an upper limit for mg and ∣Δγ∣, implying that the actual values of mg and ∣Δγ∣ should be lower than the estimations obtained in this study.
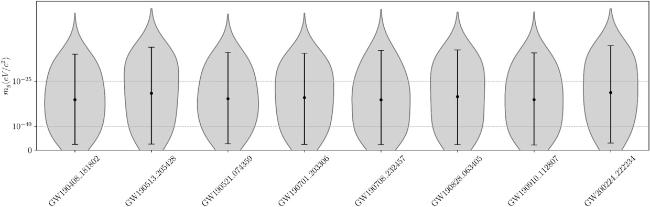
Figure 1. The posterior distribution of mg for selected GW events of BBH in GWTC-2.1 and GWTC-3 (90% credible interval). |
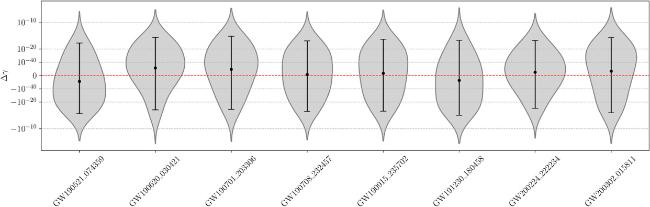
Figure 2. The posterior distribution of Δγ for selected GW events of BBH in GWTC-2.1 and GWTC-3 (90% credible interval). We selected a modified logarithmic prior (refer to equation (6) in [49]) for the prior distribution of Δγ, which encompasses both negative and non-negative values. |
Table 1. The posterior distribution of Δγ within the 90% credible interval and 90% credible interval upper bounds on the graviton mass mg for the selected BBH GW events in GWTC-2.1 and GWTC-3. Luminosity distance with 1σ credible intervals. |
| Events | SNR | dL[Mpc] | Posterior distribution of Δγ | mg[eV c−2] |
|---|---|---|---|---|
| GW190408_181802 | 14.6 | $154{0}_{-370}^{+280}$ | −1.96 × 10⁻¹³≤ Δγ ≤6.20 × 10⁻¹⁷ | 1.79 × 10⁻²³ |
| GW190503_185404 | 12.2 | $152{0}_{-370}^{+375}$ | −6.69 × 10⁻¹⁶ ≤ Δγ ≤ 2.27 × 10⁻¹³ | 2.62 × 10⁻²³ |
| GW190512_180714 | 12.7 | $146{0}_{-410}^{+315}$ | −3.89 × 10⁻¹³ ≤ Δγ ≤ 1.19 × 10⁻²⁴ | 1.37 × 10⁻²² |
| GW190513_205428 | 12.5 | $221{0}_{-500}^{+550}$ | −1.48 × 10⁻¹⁴ ≤ Δγ ≤ 4.80 × 10⁻¹⁶ | 4.49 × 10⁻²³ |
| GW190519_153544 | 15.9 | $260{0}_{-645}^{+1010}$ | −5.83 × 10⁻¹³ ≤ Δγ ≤ 2.96 × 10⁻¹⁶ | 7.90 × 10⁻²³ |
| GW190521_074359 | 25.9 | $108{0}_{-350}^{+400}$ | −1.08 × 10⁻¹⁴ ≤ Δγ ≤ 4.86 × 10⁻¹⁷ | 2.37 × 10⁻²³ |
| GW190602_175927 | 13.2 | $284{0}_{-840}^{+1070}$ | −2.28 × 10⁻¹² ≤ Δγ ≤ 2.92 × 10⁻²¹ | 4.61 × 10⁻²³ |
| GW190620_030421 | 12.1 | $291{0}_{-870}^{+1000}$ | −3.49 × 10⁻¹⁶ ≤ Δγ ≤ 1.03 × 10⁻¹⁴ | 8.59 × 10⁻²³ |
| GW190630_185205 | 16.4 | $87{0}_{-240}^{+330}$ | −1.06 × 10⁻¹³ ≤ Δγ ≤ 3.75 × 10⁻¹⁶ | 2.02 × 10⁻²³ |
| GW190701_203306 | 11.2 | $209{0}_{-440}^{+460}$ | −2.00 × 10⁻¹⁶ ≤ Δγ ≤ 2.93 × 10⁻¹⁴ | 2.01 × 10⁻²³ |
| GW190706_222641 | 13.4 | $363{0}_{-1360}^{+1500}$ | −3.72 × 10⁻¹² ≤ Δγ ≤ 8.61 × 10⁻¹⁸ | 6.91 × 10⁻²³ |
| GW190708_232457 | 13.4 | $93{0}_{-230}^{+190}$ | −1.56 × 10⁻¹⁵ ≤ Δγ ≤ 4.74 × 10⁻¹⁶ | 3.02 × 10⁻²³ |
| GW190828_063405 | 16.5 | $207{0}_{-610}^{+420}$ | −2.04 × 10⁻¹³ ≤ Δγ ≤ 3.82 × 10⁻²⁰ | 3.15 × 10⁻²³ |
| GW190910_112807 | 14.5 | $152{0}_{-420}^{+680}$ | −3.39 × 10⁻¹³ ≤ Δγ ≤ 2.24 × 10⁻¹⁶ | 2.17 × 10⁻²³ |
| GW190915_235702 | 13.1 | $175{0}_{-425}^{+435}$ | −1.24 × 10⁻¹⁵ ≤ Δγ ≤ 2.39 × 10⁻¹⁵ | 2.17 × 10⁻²³ |
| GW191109_010717 | 17.3 | $129{0}_{-440}^{+635}$ | −1.82 × 10⁻¹³ ≤ Δγ ≤ 2.52 × 10⁻²² | 1.55 × 10⁻²³ |
| GW191215_223052 | 11.2 | $193{0}_{-580}^{+560}$ | −1.85 × 10⁻¹⁸ ≤ Δγ ≤ 1.18 × 10⁻¹⁴ | 2.66 × 10⁻²³ |
| GW191222_033537 | 12.5 | $300{0}_{-1085}^{+1060}$ | −2.27 × 10⁻¹⁴ ≤ Δγ ≤ 3.49 × 10⁻¹⁶ | 1.90 × 10⁻²³ |
| GW191230_180458 | 10.4 | $430{0}_{-1300}^{+1230}$ | −4.10 × 10⁻¹⁴ ≤ Δγ ≤ 8.26 × 10⁻¹⁶ | 1.68 × 10⁻²³ |
| GW200112_155838 | 19.8 | $125{0}_{-285}^{+280}$ | −2.54 × 10⁻¹³ ≤ Δγ ≤ 2.47 × 10⁻¹⁸ | 6.91 × 10⁻²³ |
| GW200224_222234 | 20.0 | $171{0}_{-400}^{+310}$ | −7.88 × 10⁻¹⁷ ≤ Δγ ≤ 7.05 × 10⁻¹⁶ | 5.38 × 10⁻²³ |
| GW200302_015811 | 10.8 | $148{0}_{-460}^{+595}$ | −5.42 × 10⁻¹⁵ ≤ Δγ ≤ 9.87 × 10⁻¹⁵ | 2.55 × 10⁻²³ |
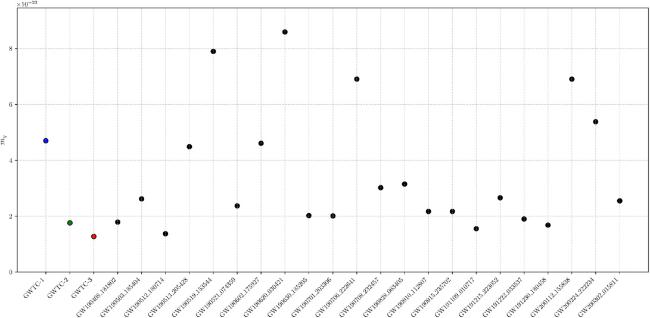
Figure 3. The scatter plot of 90% credible upper bounds on the mg for selected GW events of BBH in GWTC-2.1 and GWTC-3, with data points colored in black. Results from GWTC-1, GWTC-2, and GWTC-3 are represented by blue, green, and red markers, respectively. |
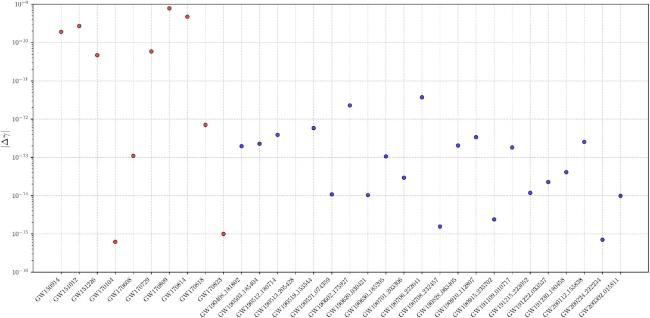
Figure 4. The scatter plot of 90% credible upper bounds on the ∣Δγ∣ for selected GW events of BBH in GWTC-2.1 and GWTC-3, with data points colored in blue. Results from GWTC-1 are represented by red markers. |
In fact, potential degeneracies between the deviations from massive gravity or WEP violation and other source parameters could introduce imprecision in the estimated values of mg and Δγ. However, we present upper limits, the results are considered acceptable. Figure 5 presents the relationship between the chirp mass and ∣Δγ∣ within our posterior distributions.
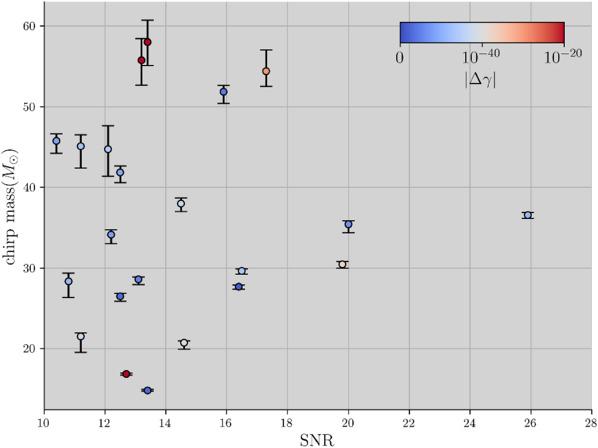
Figure 5. The median of the posterior distribution of Δγ for selected GW events of BBH in GWTC-2.1 and GWTC-3, represented by the color of points. Results are displayed with 1σ credible interval for the chirp mass. |
Additionally, we employ Bayes factors to evaluate the validity of the massive gravity and WEP violation models relative to the standard GW model. Figure 6 presents the natural logarithm of Bayes factors between the WEP violation model and the standard model for selected GW events of BBH in GWTC-2.1 and GWTC-3. The natural logarithm of Bayes factors are predominantly below an absolute value of 2 and do not show any significant trends in the top-left or bottom-right corners of the distribution, which correspond to the scenarios of small angle with large luminosity distance and large angle with small luminosity distance. These results show that under current experimental conditions and data precision, the Bayes factor cannot indicate whether the GW data favors models that support WEP violation or the standard Model. Figure 7 presents the natural logarithm of Bayes factors between the massive gravity and the standard model for selected GW events of BBH in GWTC-2.1 and GWTC-3. Similarly to the previous findings, the natural logarithm of Bayes factors are generally below an absolute value of 2, with no obvious deviation that correlate with variations in luminosity distance. These results show that under current experimental conditions and data precision, the Bayes factor cannot indicate whether the GW data favors massive gravity or the standard Model.
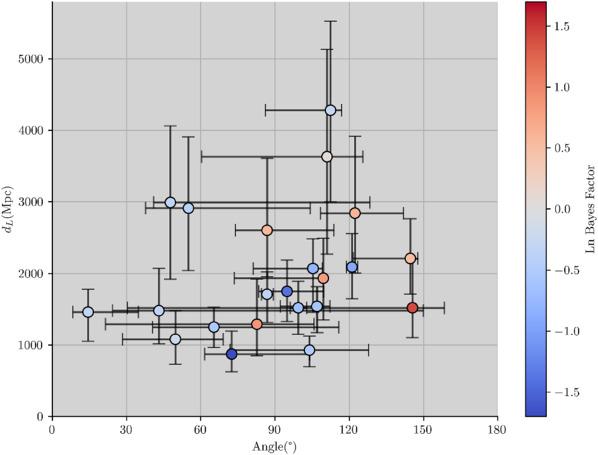
Figure 6. The natural logarithm of the Bayes factors of WEP violation model versus standard model for selected GW events of BBH in GWTC-2.1 and GWTC-3, represented by the color of points. Results are displayed with 1σ credible interval for the angle and luminosity distance. |
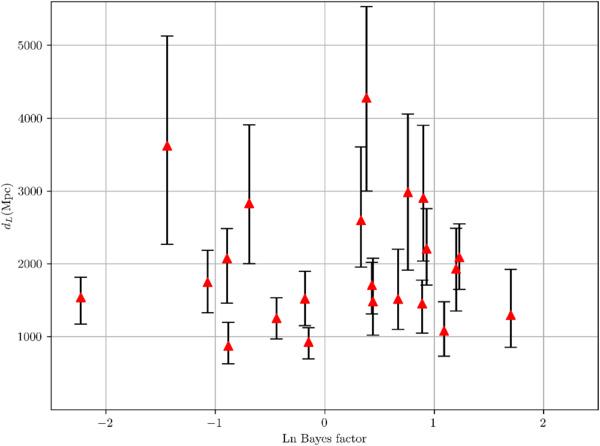
Figure 7. The natural logarithm of the Bayes factors of massive gravity versus standard model for selected GW events of BBH in GWTC-2.1 and GWTC-3. Results are displayed with 1σ credible interval for the luminosity distance. |
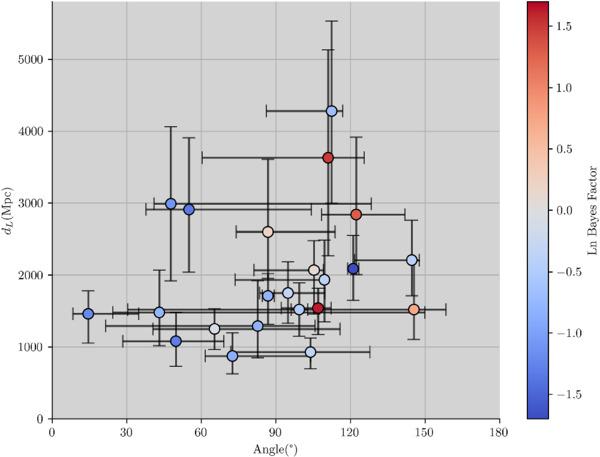
Furthermore, we also calculate Bayes factors between the WEP violation model and massive gravity, as shown in figure 8. The Bayes Factors are below zero in approximately two-thirds of the events. However, the absolute values of these natural logarithm of Bayes factors are generally less than 2. These results indicate that the GW data do not provide sufficient grounds to assert the superiority of one model over the other in terms of its fit to the GW observations.
Figure 8. The natural logarithm of the Bayes factors of WEP violation model versus massive gravity for selected GW events of BBH in GWTC-2.1 and GWTC-3, represented by the color of points. Results are displayed with 1σ credible interval for the angle and luminosity distance. |
4. Discussion
Since the direct detection of GWs [57], the LIGO and Virgo collaboration has rigorously evaluated the consistency between observed GW signals [27, 28, 50] and the theoretical predictions derived from GR. Therefore, previous studies have already placed bounds on the graviton mass and tested potential deviations induced by violation of the WEP during the propagation of GWs, and no significant deviations from the predictions of GR have been revealed through the examination of the GW data. It should be noted, however, that under the current experimental conditions, it is still necessary to use some novel methods to examine the existence of graviton mass and to test WEP violation during the propagation of GWs.
In this study, we do not find a significant preference for either the massive gravity or WEP violation models. Bayes factors fail to provide obvious evidence favoring one model over the other. With the current level of experimental precision, it remains uncertain to determine whether these deviations exist.
In this study, we have exclusively focused on the scenarios where α = 0 and A0 > 0 in modified dispersion relations. In an upcoming work, we will consider more cases of Aα with different α, different α values will introduce additional frequency-dependent corrections. And we will adopt a more comprehensive theory that incorporates the effects of WEP and LI violations, which will allow us to directly compare the impact of these two effects on GWs. We will consider the parameter degeneracies and attempt to analyze the relationship between mg and the luminosity distance, as well as the relationship between ∣Δγ∣ and the luminosity distance and the sky position. In the method of detecting the properties of GWs, we will no longer just focus on phase variations in the frequency domain of GW waveform. However, we will investigate how violations of WEP and LI may influence on other properties of GWs, such as polarizations. We will consider the effects of potential amplitude corrections and higher-mode distortions in GWs, and will employ more accurate waveform templates that incorporate amplitude corrections and higher-mode effects for our analysis.
The fourth observing run (O4) of the LIGO-Virgo-KAGRA (LVK) GW detector network has started running, it is promising to get more GW events, including more binary neutron star (BNS) merger events. These events are anticipated to have a promising probability of presenting multi-messenger characteristics, which would permit a better determination of parameters such as right ascension, declination, and luminosity distance. Then, we can clearly analyze the differences in propagation speeds between GWs and electromagnetic waves and the impact of large mass gravitational sources on the propagation of GWs. So it is possible to better constrain the upper bound of mg and Δγ.
In the future, the implementation of space-borne interferometers will expand our ability to detect GWs from a wider array of sources and improve the SNRs of detected events [58–62]. We will also develop statistical methods and try more efficient ways to search for traces of deviations from GR in the multitude of GW events. The utilization of O4 data and forthcoming space-borne interferometers will allow us to detect various GW events, and conduct population analysis on GW events that may contain deviations from GR. Hence, it is worthwhile to discuss the capability of GW detectors to detect signals that exhibit such deviations in future studies.