


1. Introduction
Ribonucleic Acids (RNAs) are essential macromolecules with critical roles in living organisms, including gene regulation, enzymatic catalysis, RNA splicing, and protein synthesis [1–5]. RNA functions mainly rely on their structures, especially the three-dimensional (3D) structures, which might be directly determined by the primary sequences and the corresponding folding dynamics [6–9]. However, determining RNA 3D structures remains challenging, and experimentally resolved RNA 3D structures in Protein Data Bank (PDB) are relatively scarce [10]. To address this limitation, computational methods including physics-based [11–24], template-based approaches [25–35], and deep learning techniques [36–39] have been developed to predict RNA 3D structures. Despite these advancements, accurately predicting RNA 3D structures, especially those with complex topology and long sequences, remains a significant challenge [40–43].
Contact prediction initially became prevalent in protein-related tasks, where statistical models were used to infer co-evolutionary patterns between amino acids based on abundant sequence data [44, 45]. With the growth of protein sequence data, contact prediction methods were continuously improved and refined [46–55]. Analogous to protein contacts, RNA contacts are operationally defined as nucleotide pairs with heavy atoms within a specified distance threshold (e.g., ≤ 8 Å), capturing spatial proximity in RNA tertiary structures [56–67]. In contrast, RNA secondary structure interactions arise from base pairing mediated by hydrogen bonds. Accurately predicting nucleotide contacts is crucial for predicting RNA 3D structures, as these nucleotide contacts can serve as the conformational spatial constraints for RNA structure modeling, thereby improving structure prediction accuracy and efficiency [68–71].
Existing contact prediction methods can be broadly categorized into two types: statistical inference-based and neural network-based approaches [44–48, 61–67]. Early approaches based on statistical inference for predicting RNA contacts can be traced back to those based on mutual information (MI) [56, 57]. Subsequently, approaches based on direct coupling analysis (DCA) (mpDCA [44], mfDCA [45]) and those more advanced versions (PSICOV [46], plmDCA [47], GREMLIN [48], CCMpred [49], Boltzmann learning [60], DIRECT [61], adabmDCA [62], plmc [70]) emerged later. Since 2020, neural network techniques, integrated with co-evolutionary information have been introduced and have achieved further advancements in RNA contact prediction (RNAcontact [63], CoCoNet [64], SPOT-RNA-2D [65], BARNACLE [66], and CoT-RNA [67]).
In this study, we provide a detailed overview of recent advancements in RNA contact prediction. Afterwards, we evaluate the performance of eight representative approaches (mfDCA, plmDCA, GREMLIN, adabmDCA, CoCoNet, RNAcontact, SPOT-RNA-2D and CoT-RNA) in predicting non-local, long-range and tertiary contacts, using two newly constructed test datasets based on RNA sequence identity and structural similarity, along with a benchmark set from the Critical Assessment of protein Structure Prediction (CASP) [72]. Moreover, we examine the influence of homologous sequence quality on prediction performance and assessed the similarity between methods using the Jaccard index (Jaccard similarity coefficient) [73].
2. Methods
2.1. RNA contact prediction methods
Contact prediction methods can be broadly classified into two categories: those based on statistical inference and those relying on neural networks [44–48, 61–67]. We summarized the main existing RNA contact prediction methods in table 1, which presents detailed information about these methods, serving as a reference for a better understanding of different approaches in this field.
Table 1. The mainly existing contact prediction methods for RNAs. |
2.1.1. Statistical inference-based methods
Mutual information method
Mutual information (MI), a fundamental metric in information theory, quantifies statistical dependencies between random variables [74]. For RNA contact prediction, MI can be employed to extract co-evolutionary signals by analyzing nucleotide covariation patterns within multiple sequence alignments (MSA) of homologous RNA sequences [56, 57]. The premise is that spatially proximal nucleotide pairs often exhibit coordinated mutational patterns during evolution to maintain the stability of the three-dimensional structure of RNA [68–71]. The MI can be given by [44]
$\begin{eqnarray}{\mathrm{MI}}_{ij}=\displaystyle \sum _{{a}_{i},{a}_{j}}^{}{f}_{ij}\left({a}_{i},{a}_{j}\right)\mathrm{ln}\frac{{f}_{ij}\left({a}_{i},{a}_{j}\right)}{{f}_{i}\left({a}_{i}\right){f}_{j}\left({a}_{j}\right)},\end{eqnarray}$
where ai and aj represent the residue type at i-th and j-th positions in the RNA sequence, respectively. Here, ${a}_{i},{a}_{j}\in \left\{A,U,G,C,-\right\}$, and the symbol '-' represents a gap. Additionally, the independent frequency ${f}_{i}\left({a}_{i}\right)$ and the joint frequency ${f}_{ij}\left({a}_{i},{a}_{j}\right)$ can be reweighted to correct the sampling bias of biological sequence data caused by phylogenetic relations between species, and they are respectively expressed by [44] $\begin{eqnarray}{f}_{i}\left({a}_{i}\right)=\frac{1}{\lambda +{M}_{{\rm{eff}}}}\,\left(\frac{\lambda }{q}+\displaystyle \sum _{k=1}^{M}\frac{1}{{m}^{k}}{\delta }_{{a}_{i},{a}_{i}^{k}}\right),\end{eqnarray}$
and $\begin{eqnarray}{f}_{ij}\left({a}_{i},{a}_{j}\right)=\frac{1}{\lambda +{M}_{{\rm{eff}}}}\,\left(\frac{\lambda }{{q}^{2}}+\displaystyle \sum _{k=1}^{M}\frac{1}{{m}^{k}}{\delta }_{{a}_{i},{a}_{i}^{k}}{\delta }_{{a}_{j},{a}_{j}^{k}}\right),\end{eqnarray}$
where M represents the number of sequences in an MSA, Meff is the effective number of independent sequences and $\frac{1}{{m}^{a}}$ represents the weight assigned to each sequence in the MSA. λ is a parameter used to avoid the denominator reaching zero. Furthermore, q is equal to 5, which is defined for the number of different nucleotides (also counting the gap). ${\delta }_{{a}_{i},{a}_{i}^{k}}$ denotes the Kronecker symbol, which equals one if ${a}_{i}={a}_{i}^{k}$, and zero otherwise.MI values are high if substitutions at the two positions are correlated. However, MI considers only one residue pair at a time, and different pairs are compared only at the end after the MI values are determined [44]. Therefore, MI method focuses on measuring local correlations, it may include strong coupling information for some indirect contact base pairs. And it may misidentify non-contacting base pairs as having contacts [44].
Direct Coupling Analysis methods
To overcome the inherent limitations of MI methods—namely, the inability to disentangle direct and indirect correlations—several direct coupling analysis (DCA) methods are proposed, including message-passing direct coupling analysis (mpDCA) [44], mean-field direct coupling analysis (mfDCA) [45] and pseudo-likelihood maximization direct coupling analysis (plmDCA) [47]. For a family of homologous RNA sequences, a global statistical model $P\left({a}_{1},{a}_{2},\cdots \,,{a}_{L}\right)$ for entire RNA sequences $\left({a}_{1},{a}_{2},\cdots \,,{a}_{L}\right)$ of length L can be assigned using the generalized Potts model as [44]
$\begin{eqnarray}P\left({a}_{1},{a}_{2},\cdots \,,{a}_{L}\right)=\frac{1}{Z}{\rm{\exp }}\left(\displaystyle \sum _{i=1}^{L}{h}_{i}\left({a}_{i}\right)+\displaystyle \sum _{i\lt j}^{L}{J}_{ij}\left({a}_{i},{a}_{j}\right)\right),\end{eqnarray}$
where Z is the partition function, which is defined as $\begin{eqnarray}Z=\displaystyle \sum _{{a}_{1},\cdots \,,{a}_{L}}^{}{\rm{\exp }}\left\{\displaystyle \sum _{i=1}^{L}{h}_{i}\left({a}_{i}\right)+\displaystyle \sum _{i\lt j}^{L}{J}_{ij}\left({a}_{i},{a}_{j}\right)\right\}.\end{eqnarray}$
Additionally, the local biases ${h}_{i}\left({a}_{i}\right)$ describing the preference for single nucleotide ai at position i and the ${J}_{ij}\left({a}_{i},{a}_{j}\right)$ represents direct coupling strength between nucleotides in positions i and j. Parameters ${h}_{i}\left({a}_{i}\right)$ and the ${J}_{ij}\left({a}_{i},{a}_{j}\right)$ ought to be determined from the multiple sequence analysis by the constraints, i.e. generating the empirical frequency counts as marginals,
$\begin{eqnarray}{P}_{i}\left({a}_{i}\right)=\displaystyle \sum _{\left\{{a}_{k}| k\ne i\right\}}^{}P\left({a}_{1},{a}_{2},\cdots \,,{a}_{L}\right)={f}_{i}\left({a}_{i}\right),\end{eqnarray}$
and $\begin{eqnarray}{P}_{ij}\left({a}_{i},{a}_{j}\right)=\displaystyle \sum _{\left\{{a}_{k}| k\ne i,j\right\}}^{}P\left({a}_{1},{a}_{2},\cdots \,,{a}_{L}\right)={f}_{ij}\left({a}_{i},{a}_{j}\right).\end{eqnarray}$
However, the calculation of ${J}_{ij}\left({a}_{i},{a}_{j}\right)$ is a tricky problem [46]. The core of mpDCA is to apply the message-passing algorithm to estimate the parameters in the Potts model [44]. Compared with the MI approach, mpDCA can improve the direct contact prediction accuracy, but it results in relatively high computational complexity [59]. mfDCA simplifies parameter estimation via mean-field approximation, turning it into a matrix inversion problem, and it is 103 to 104 times faster than mpDCA [45]. For plmDCA, the parameters are inferred by minimizing the pseudo-likelihood function [47]. Once the model parameters are determined, we can obtain ${P}_{ij}^{\left({\rm{dir}}\right)}\left({a}_{i},{a}_{j}\right)$, which only retain the direct coupling between sites i and j while ignoring the indirect effects of other sites. The direct information (DI) is then defined as [44] $\begin{eqnarray}{\mathrm{DI}}_{ij}=\displaystyle \sum _{{a}_{i},{a}_{j}}^{}{P}_{ij}^{\left({\rm{dir}}\right)}\left({a}_{i},{a}_{j}\right){\mathrm{ln}}_{}\frac{{P}_{ij}^{\left({\rm{dir}}\right)}\left({a}_{i},{a}_{j}\right)}{{f}_{i}\left({a}_{i}\right){f}_{j}\left({a}_{j}\right)}.\end{eqnarray}$
Detailed information for mpDCA, mfDCA and plmDCA can also be found in [44, 45, 47]. The codes of mfDCA and plmDCA can be found at https://github.com/KIT-MBS/pydca.GREMLIN
The DCA methods mentioned above demand a large number of evolutionary related sequences to accurately evaluate the degree of residue covariation. Moreover, the larger the protein/RNA family, the more likely it is that contact information is unnecessary because a reasonable model can be built based on the structure of a homolog [48]. Therefore, building upon plmDCA, Kamisetty et al proposed the GREMLIN method in 2013, which used a pseudo-likelihood approach to integrate sequence co-evolution and structural context information, such as secondary structure [48]. This innovative integration allows for more accurate contact predictions, even when dealing with a smaller number of homologous sequences [48]. GREMLIN is available at https://github.com/sokrypton/GREMLIN_CPP.
DIRECT
To overcome these limitations that DCA has difficulties in precisely determining the tertiary contacts within loop-loop and junction regions, Zhao et al have developed a method named DIRECT (direct information reweighted by contact templates) in 2019, which is designed to optimize the prediction of loop-loop and junction contacts [61]. In DIRECT, the initial contact weights were learned through a restricted Boltzmann machine (RBM) using non-redundant experimentally determined RNA structures. Subsequently, these contact weights can be utilized to refine the RNA contact predictions derived from sequence co-evolution analysis by DCA. Finally, contact score can be represented as follows [61]:
$\begin{eqnarray}{\rm{DIRECT}}={\rm{DI}}\times {w}^{2},\end{eqnarray}$
where DI is the initial residue pair direct coupling score obtained through mfDCA or plmDCA, while w represents the structural contact frequency from the RBM. It is claimed that DIRECT can accurately identify long-range contacts. This ability enables it to efficiently reduce the search space for structural modeling [61]. Unfortunately, it is not accessible from the website provided.adabmDCA
In adabmDCA, an adaptive Boltzmann machine learning approach was implemented [62]. The Boltzmann learning algorithm consists of a series of training epochs. At each epoch t, a Monte Carlo Markov Chain (MCMC) strategy was applied to numerically estimate the marginal probability distributions of the model, namely ${p}_{i}^{\left(t\right)}\left({a}_{i}\right)$ and ${p}_{ij}^{\left(t\right)}\left({a}_{i},{b}_{j}\right)$ [62]. More specifically, Muntoni et al employed Ns independent Markov chains, each of which samples Nc configurations [62]. Here,
$\begin{eqnarray}{p}_{i}^{\left(t\right)}\left({a}_{i}\right)=\frac{1}{{N}_{s}{N}_{c}}\displaystyle \sum _{\mu =1}^{{N}_{s}{N}_{c}}{\delta }_{{s}_{i}^{\mu }\left(t\right),{a}_{i}},\end{eqnarray}$
and $\begin{eqnarray}{p}_{ij}^{\left(t\right)}\left({a}_{i},{b}_{j}\right)=\frac{1}{{N}_{s}{N}_{c}}\displaystyle \sum _{\mu =1}^{{N}_{s}{N}_{c}}{\delta }_{{s}_{i}^{\mu }\left(t\right),{a}_{i}}{\delta }_{{s}_{j}^{\mu }\left(t\right),{b}_{j}}.\end{eqnarray}$
The term ${s}_{i}^{\mu }\left(t\right)$ represents the residue state at the i-th position in the sequence sampled by the μ-th Markov chain during the t-th iteration [62]. Through the adaptive MCMC sampling strategy, the sampling time can be effectively adjusted to ensure that the model converges to a Potts model capable of accurately fitting the one-site and two-site frequencies. In addition, this method enables users to flexibly control the training process according to the characteristics of the data and research requirements, effectively avoiding overfitting [62]. adabmDCA can be found at https://github.com/anna-pa-m/adabmDCA.2.1.2. Neural network-based methods
RNA contact is designed based on a deep residual neural network (ResNet) by Yang et al in 2019 [63]. It requires the MSA constructed by Infernal [75], and the secondary structure predicted by PETfold [76]. Then, for an RNA of length L, the L × L × 25-dimensional covariance features are combined with the L × L × 1-dimensional secondary structure features to form 26 two-dimensional feature maps, which serve as the input for the ResNet. The covariance information features are represented as follows [63]:
$\begin{eqnarray}{\rm{cov}}\left({a}_{i},{a}_{j}\right)=p\left({a}_{i}{a}_{j}\right)-p\left({a}_{i}\right)p\left({a}_{j}\right).\end{eqnarray}$
Here, i and j represent the i-th and j-th columns of the MSA, with $p\left({a}_{i}{a}_{j}\right)$ and $p\left({a}_{i}\right)$ denoting the observed frequencies of the respective nucleotide pairs or nucleotides in the MSA.The network architecture consists of three initial convolutional layers and five residual blocks (each containing two convolutional layers), ultimately outputting an L × L 3D closeness probability matrix [63]. The 3D closeness in RNAcontact is defined as a situation where the heavy-atom distance between nucleotide pairs is less than 8 Å [63]. This method breaks through the traditional methods' reliance on co-evolutionary signals through deep feature fusion and residual learning, offering new insights for RNA contact prediction. RNAcontact is available at http://yanglab.nankai.edu.cn/RNAcontact/.
CoCoNet
CoCoNet, developed by Schug et al in 2021, integrates a DCA model with a shallow convolutional neural network (CNN) [64]. The method begins by constructing an initial L × L two-dimensional contact map (L: RNA sequence length) using mfDCA. Then, this contact map is processed through a convolutional layer, where convolution operations are performed using filters of different sizes (such as 3 × 3, 5 × 5, and 7 × 7) to enhance the real contact signals and suppress noise and the model is trained using the gradient back-propagation algorithm [64]. Notably, different filters are taken into account for the distinction between Watson-Crick base pairs and non-Watson–Crick pairs. The total loss function for the entire training set R is defined as [64]:
$\begin{eqnarray}{ \mathcal F }=\displaystyle \sum _{R}^{}\displaystyle \sum _{j\gt i+4}^{}\left(w\ast {{ \mathcal D }}_{ij}^{R}-\delta \left({{ \mathcal C }}_{ij}^{R}\right)\right).\end{eqnarray}$
Here, w and ${{ \mathcal D }}_{ij}^{R}$ represent the filter weight matrix and the local DI score matrix between the residues at position i and j, respectively. $\delta \left({{ \mathcal C }}_{ij}^{R}\right)$ is 1 when nucleotides at i and j are in contact in the RNA structure, and 0 otherwise. This method effectively addresses the challenge of scarce RNA structure data through the design of a shallow CNN (with 9-98 parameters) [64]. Meanwhile, it uses convolution operations to mine the spatial patterns of co-evolutionary signals, providing an efficient and lightweight solution for RNA contact prediction. CoCoNet is available at https://github.com/KIT-MBS/coconet.SPOT-RNA-2D
Zhou et al proposed SPOT-RNA-2D in 2022. It combines deep learning with physical inference using secondary structure, coevolutionary information, and multiple sequence alignment sampling to predict RNA residue pair contacts [65]. This model employs an ensemble of residual convolutional neural networks (ResNets) and utilizes pre-activated convolutional blocks, layer normalization, and dropout to prevent overfitting. During training, a random sampling strategy for MSA is introduced to improve adaptability to sparse homologous sequences. Importantly, for RNA sequences with a high number of homologous sequences (Meff > 50), it ensures highly accurate predictions for top-L long-range contacts [65]. SPOT-RNA-2D provides a critical tool for RNA structure prediction, advancing the exploration from contact maps to high-accuracy 3D modeling. SPOT-RNA-2D is accessible at https://github.com/jaswindersingh2/SPOT-RNA-2D.
CoT-RNA
Very recently, Jian et al proposed Cot-RNA, a novel approach that transfers knowledge learned from protein coevolution transformer-based language models to RNA contact prediction tasks [67]. This method first converts the nucleotides (A/U/C/G) in the RNA MSA into protein amino acid symbols (e.g., A → H, U → E) through random mapping to adapt to the input format of the CoT (co-evolution transformer) model, and utilizes its multi-layer attention mechanism to extract co-evolutionary features [67]. Subsequently, a mid-fusion strategy is adopted to process features at different levels: the output features of each attention block are optimized separately through independent convolutional modules, and then concatenated into a unified tensor and input into a 3-layer convolutional classification network to predict the contact probability of nucleotide pairs [67]. During training, this method only updates the parameters of the newly added modules to avoid overfitting, and uses the Adam optimizer and cosine annealing learning rate to optimize the model [67]. This method provides an example for the transfer of knowledge across biomolecular modalities. CoT-RNA is available at https://github.com/yiren-jian/CoT-RNA-Transfer.
In summary, statistical inference-based methods infer residue contacts by detecting covariation signals in MSAs, typically using computational models such as the Potts model. These methods are effective in extracting direct evolutionary constraints but are limited when MSAs are shallow or lack diversity. In contrast, neural network-based methods integrate multi-source features—such as MSAs, predicted secondary structures, and position-specific scoring matrices (PSSMs)—into deep learning architectures (e.g., convolutional neural networks and transformers). These models are trained in a supervised manner using labels derived from experimentally determined RNA 3D structures, enabling them to capture complex patterns in sequences to predict spatial interactions.
2.2. Benchmark test sets
In this work, we curated our test sets by independently considering sequence identity and structure similarity. Initially, 3284 representative RNA chains with an x-ray resolution < 4.0 Å were retrieved from RNA 3D Hub list (Release 3.352, 2024-09-11), which can ensure that the sequence identity between any two chains in the set is < 95% (Leontis and Zirbel 2012) [77]. Then, RNA chains were excluded if their lengths fell outside the range of 40-500nts, their corresponding 3D structures lacked ≥ 5 residue-residue spatial contacts and their sequences contained gaps. Subsequently, CD-HIT-EST [78] was utilized to remove redundant sequences at 80% sequence identity cutoff, resulting in a set of 354 RNA chains.
For the low sequence identity test set (test set I), we further employed CD-HIT-EST with a stringent sequence identity threshold of 60%, retaining 52 RNA chains. For the low structural similarity test set (test set II), US-align [79] was applied to perform 3D structure alignments. This tool conducts RNA 3D structure alignments using the well-established TM-score and heuristic structural alignment algorithms [78]. By setting a TM-score cutoff of 0.48, 44 RNA chains were retained. Notably, there are 10 structures overlapped between test sets I and II. Additionally, test set III comprised 9 target RNA-only structures from CASP (Critical Assessment of protein Structure Prediction), a biennial international top-tier competition that introduced the RNA structure prediction in its last two editions (CASP15 and CASP16) [72]. The PDB IDs of all test set RNAs are provided in tables S1-S3 of the Supplementary Material.
To ensure a sufficient number of RNAs in the test sets while maintaining comparability across the four neural network-based contact predictors, we allowed for some degree of sequence redundancy between the test sets and the training sets of the four predictors. To quantify this redundancy, we used CD-HIT-EST with an 80% identity threshold to compare each training set of the four neural network-based methods against the test sequences in this work. As shown in table S4 of the Supplementary Material, the proportion of potentially redundant sequences is low for all methods. Notably, none of the RNAs in test set III has > 80% sequence identity with RNAs in the training data from all four predictors.
2.3. Contact definition and evaluation metrics
In this study, we adopted a consistent residue contact definition following established conventions (DIRECT [61], RNAcontact [63], SPOT-RNA-2D [65]), where two RNA nucleotides are defined as contacting if the minimum distance between any pair of their non-hydrogen atoms measures ≤ 8 Å in three-dimensional structures.
To comprehensively evaluate the performance of various computational methods, four evaluation metrics—precision, recall, F1-score, and Matthews Correlation Coefficient (MCC)—were employed across three hierarchically structured contact types: (a) non-local contacts defined as nucleotide contact pairs with a sequence separation of ∣i − j∣ > 4, excluding strong local contacts associated with backbone connectivity; (b) long-range contacts defined as a specific subset with an extended sequence separation (∣i − j∣ > 24), focusing on contacts between nucleotides distant in the primary sequence; (c) long-range tertiary contacts defined as residue pairs spanning distinct secondary structure elements (e.g., loops, helices) with any non-hydrogen atoms within 6.0 Å and identified via urslib2 [80]. The four metrics can be defined as [81]:
$\begin{eqnarray}{\rm{precision}}=\frac{{\rm{TP}}}{{\rm{TP}}+{\rm{FP}}}={\rm{PR}},\end{eqnarray}$
$\begin{eqnarray}{\rm{sensitivity}}=\frac{{\rm{TP}}}{{\rm{TP}}+{\rm{FN}}}={\rm{SE}},\end{eqnarray}$
$\begin{eqnarray}{\rm{F1}}-{\rm{score}}=\frac{2\left({\rm{PR}}\ast {\rm{SE}}\right)}{{\rm{PR}}+{\rm{SE}}},\end{eqnarray}$
and $\begin{eqnarray}{\rm{MCC}}=\frac{{\rm{TP}}\ast {\rm{TN}}-{\rm{FP}}\ast {\rm{FN}}}{\sqrt{\left({\rm{TP}}\ast {\rm{FP}}\right)\left({\rm{TP}}\ast {\rm{FN}}\right)\left({\rm{TN}}\ast {\rm{FP}}\right)\left({\rm{TN}}\ast {\rm{FN}}\right)}}.\end{eqnarray}$
Here, TP, FP, TN, and FN represent true positives, false positives, true negatives, and false negatives, respectively. Precision (PR) represents the fraction of correctly predicted contacts among all predicted contacts. Recall (SE) indicates the proportion of true contacts correctly identified by the model. The F1-score is the harmonic mean of PR and SE. Besides, in RNA contact prediction, non-contacting residue pairs typically outnumber contacting pairs, leading to an imbalance between the positive and negative classes—a phenomenon that becomes more pronounced with longer RNA chains. Thus, MCC offers a balanced evaluation by holistically integrating TP, FP, TN, and FN. The MCC ranges from −1 to 1, with values interpreted as follows: 0 indicates performance equivalent to random guessing, 1 represents perfect predictive accuracy, and −1 signifies complete misclassification.Additionally, Jaccard index (Jaccard similarity coefficient) was used to assess the similarity between two different prediction methods [73]:
$\begin{eqnarray}J\left(X,Y\right)=\frac{| X\cap Y| }{\left|X\cup Y\right|},\end{eqnarray}$
where X and Y can represent two different methods of predicting RNA residue contacts. ∣X ∩ Y∣ represents the number of identified contacts shared by both X and Y, while ∣X ∪ Y∣ represents the total count of distinct identified contacts in either X or Y (including those in both).2.4. Number of effective sequences
As presented in table 1, MSA serves as an indispensable input for contemporary RNA residue contact prediction methods. High-quality MSA is crucial for the performance of these methods based on the fact that interacting residue pairs are subject evolutionary pressure to preserve the structure. To evaluate the quality of MSA, the concept of number of effective sequences can be introduced. For an MSA = $\left\{\left({A}_{1}^{a},{A}_{2}^{a},\cdots \,,{A}_{L}^{a}\right)| a=1,2,\cdots \,,M\right\}$, where M is the column number of MSA and L is the length of the target sequence, the number of effective sequences can be expressed as [48]:
$\begin{eqnarray}{M}_{{\rm{eff}}}=\displaystyle \sum _{a=1}^{M}\frac{1}{{m}^{a}},\end{eqnarray}$
where ma is a number determined by ${m}^{a}\,=\left|| \,\{b\in \left\{1,2,\cdots \,,M\right\}| {{\rm{seq}}}_{{\rm{identity}}}\left({A}^{a},{A}^{b}\right)\gt {\rm{Threshold}}\}\,\right|$, and $\frac{1}{{m}^{a}}$ represents the weight assigned to each sequence in MSA. In this work, the threshold is defined as 80%, and the Meff for each MSA can be calculated by GREMLIN [48].3. Results and discussion
3.1. Influence of MSAs on RNA contact prediction
Table 1 highlights the importance of MSAs in RNA contact prediction as most state-of-the-art methods require users to provide MSAs as input. A common approach to generating MSAs relies on homologous sequences from the Rfam database [82]. However, Rfam contains only 4178 manually curated families (as of September 2024), which limits its applicability. To address this limitation, some methods, such as RNAcontact and SPOT-RNA-2D, automatically construct MSAs by searching NCBI's non-redundant nucleotide database [63]. RNAcmap, integrated within SPOT-RNA-2D, is a high-quality MSA generation tool. It identifies homologous sequences [83] through two rounds of searching in the NCBI nucleotide database [84] and incorporates the consensus secondary structure (CSS) predicted by RNAfold [85] or SPOT-RNA [86] to build the covariance model (CM).
figure 1 compares RNA contact predictions using RNAcontact's default MSA with those using RNAcmap-generated MSAs, in which SPOT-RNA was employed, across a test set of 95 RNAs (i.e., test sets I + II + III). Overall, RNAcontact (RNAcmap) outperformed RNAcontact (default). For non-local contacts, RNAcontact (RNAcmap) achieved a precision of 0.620, compared to 0.502 for RNAcontact (default), representing a 23.5% improvement. A similar trend was observed for MCC, with RNAcontact (RNAcmap) scoring 0.342 versus 0.271 for RNAcontact (default), a 26.2% increase. The performance gap was even more pronounced for long-range contact prediction. RNAcontact (RNAcmap) showed a 46.4% higher precision than RNAcontact (default) (0.429 versus 0.293), while the MCC improved by 51.5% (0.306 versus 0.202).
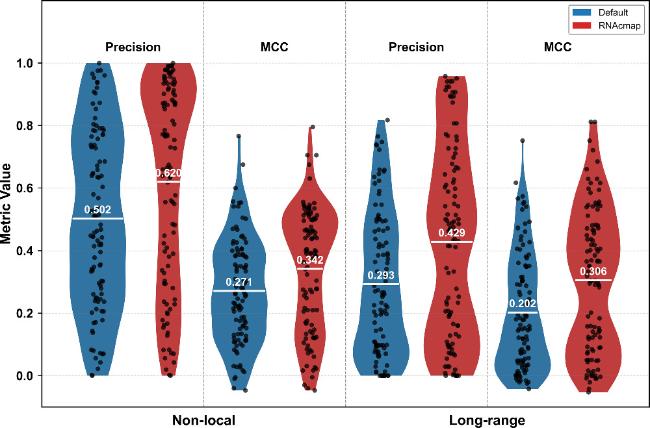
Figure 1. The performance of RNAcontact with two MSAs on the entire test set (test sets I + II + III). ‘Default' represents the MSA acquired through the in-built MSA search method within RNAcontact. ‘RNAcmap' indicates the MSA derived from RNAcmap, in which SPOT-RNA was utilized. |
The observed performance improvement indicates the importance of MSA quality in RNA contact prediction. As shown in tables S1-S3 of the Supplementary Material, RNAcmap achieved significantly higher Meff (a key metric for evaluating the quality of homologous sequences) than RNAcontact. This improvement may be attributed to RNAcmap's two-round search strategy and the incorporation of secondary structure predictions from SPOT-RNA. Therefore, to eliminate the influence of MSA quality on RNA contact prediction, all evaluations in this study used MSAs generated by RNAcmap (with SPOT-RNA-2D derived consensus secondary structures).
3.2. Overall performance of eight RNA contact prediction methods
Detailed performance metrics for the three test sets are provided in tables S5-S7, and their performance—including error bars—is also visualized in figure S2 of the Supplementary Material, which confirms that neural network-based methods consistently outperformed the statistical inference-based methods. For non-local contacts in test sets I, II, and III, neural network-based methods achieved mean precision values of 0.641, 0.673, and 0.699 with MCC values of 0.359, 0.373, and 0.370, respectively. Conversely, statistical inference-based methods showed significantly lower performance, with precision ranging from 0.342 to 0.385 and MCC values between 0.173 and 0.204, approximately 1.7 to 2.0 times lower than those of neural network-based methods.
A similar trend was observed in long-range contact prediction, further demonstrating the superior ability of neural network-based methods to capture RNA contact patterns. Additional performance metrics, including sensitivity and F1-score for the three test sets, also confirm the advantage of neural network-based methods, especially SPOT-RNA-2D, which consistently achieved the best performance; see tables S5-S7 in the Supplementary Material.
To assess consensus among methods, Jaccard similarity analysis was conducted on the top L long-range contacts, as shown in figure S1 of the Supplementary Material. Statistical methods (mfDCA, plmDCA, GREMLIN, adabmDCA) formed a distinct cluster (Jaccard: 0.31–0.39), while neural methods (SPOT-RNA-2D, RNAcontact, CoCoNet, CoT-RNA) showed intra-group similarity (Jaccard: 0.20–0.45). However, cross-category similarity was consistently low (Jaccard < 0.20), reflecting fundamental differences in prediction strategies. Notably, CoT-RNA showed limited similarity with other neural methods (Jaccard: 0.20–0.25), reinforcing its divergence due to protein-to-RNA transfer learning.
3.2.1. Statistical inference-based methods: mfDCA performs relatively better
Among statistical inference-based methods, mfDCA achieved the highest precision and MCC across the three test sets (95 RNAs, figure 2(A) and (B)). It attained 0.383 precision and 0.194 MCC for non-local contacts, and 0.256 precision and 0.162 MCC for long-range contacts, respectively. However, adabmDCA, plmDCA and GREMLIN showed similar performance. For example, for identifying long-range contacts, plmDCA had a precision of 0.223 and an MCC of 0.138; GREMLIN had a precision of 0.228 and an MCC of 0.142; adabmDCA had a precision of 0.238 and an MCC of 0.154. Although the differences are not significant, mfDCA outperformed others, likely owing to its mean-field approximation, which reduces the parameter space while enhancing the stability and consistency of the results [45].
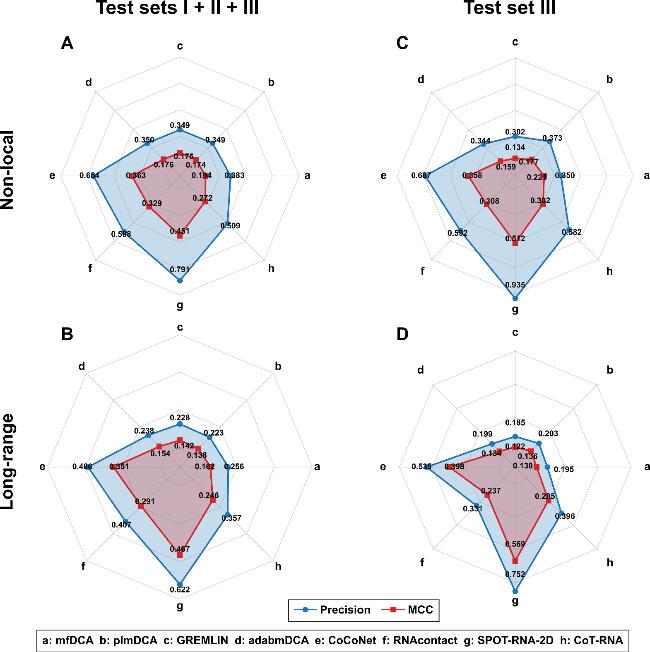
Figure 2. The performance of eight RNA contact prediction methods on the entire test set (test set I + II + III) and the test set III. |
3.2.2. Neural network-based methods: SPOT-RNA-2D excels via multi-feature integration
Among neural network-based methods, SPOT-RNA-2D achieved the highest accuracy across the three test sets (figure 2(A) and (B)). It attained 0.791 precision and 0.451 MCC for non-local contacts, and 0.622 precision with 0.467 MCC for long-range contacts. CoCoNet ranked second, while CoT-RNA performed the worst. For example, for identifying the long-range contacts, CoCoNet, RNAcontact, and CoT-RNA had precisions of 0.486, 0.407, and 0.357, with MCCs of 0.351, 0.291, and 0.246, respectively. Despite using transfer learning to adapt a protein co-evolution transformer model, CoT-RNA underperformed, likely because RNA and protein co-evolution signals differ. Mapping RNA nucleotides (A/U/C/G) to protein amino acid symbols (e.g., A→H, U→E) disrupts RNA-specific features such as base-pairing rules and non-standard base interactions, limiting the predictive ability of CoT-RNA.
Overall, neural network-based methods outperformed statistical inference-based ones, with SPOT-RNA-2D leading the field, likely due to its integration of multiple input features (e.g., position-specific scoring matrix (PSSM), pseudo-likelihood maximization coupling (PLMC), and predicted secondary structure) and effective feature learning via residual convolutional neural networks (ResNets) [65].
3.3. Performance variations across test sets I and II
A comparative analysis of test set I (emphasizing sequence diversity) and test set II (focusing on structural divergence) reveals key differences in method generalizability. Neural network-based methods (except CoCoNet) performed better on test set II than test set I.As shown in table 2, SPOT-RNA-2D improved in non-local contact prediction, with precision increasing by 3.3% (0.779 to 0.805) and MCC by 6.1% (0.440 to 0.467). This suggests that most neural network-based methods effectively generalize across diverse sequence and structural distributions.
Table 2. The performance of eight RNA contact prediction methods on test sets I and II. |
| Test set I | Test set II | Difference $\left({\rm{\Delta }}\right)$ a | ||||||||||||
|---|---|---|---|---|---|---|---|---|---|---|---|---|---|---|
| non-local | long-range | non-local | long-range | non-local | long-range | |||||||||
| Method | Precision | MCC | Precision | MCC | Precision | MCC | Precision | MCC | Precision | MCC | Precision | MCC | ||
| mfDCA | 0.417 | 0.222 | 0.295 | 0.197 | 0.378 | 0.184 | 0.254 | 0.149 | −0.039 | −0.038 | −0.041 | −0.048 | ||
| plmDCA | 0.380 | 0.199 | 0.246 | 0.160 | 0.341 | 0.162 | 0.227 | 0.131 | −0.039 | −0.037 | −0.019 | −0.029 | ||
| GREMLIN | 0.379 | 0.200 | 0.253 | 0.165 | 0.346 | 0.168 | 0.232 | 0.136 | −0.033 | −0.032 | −0.021 | −0.029 | ||
| adabmDCA | 0.364 | 0.193 | 0.256 | 0.171 | 0.369 | 0.180 | 0.254 | 0.158 | 0.005 | −0.013 | −0.002 | −0.013 | ||
| CoCoNet | 0.692 | 0.390 | 0.542 | 0.391 | 0.659 | 0.363 | 0.470 | 0.334 | −0.033 | −0.027 | −0.072 | −0.057 | ||
| RNAcontact | 0.570 | 0.317 | 0.412 | 0.292 | 0.684 | 0.378 | 0.466 | 0.334 | 0.114 | 0.061 | 0.054 | 0.042 | ||
| SPOT-RNA-2D | 0.779 | 0.440 | 0.640 | 0.469 | 0.805 | 0.467 | 0.618 | 0.468 | 0.026 | 0.027 | −0.022 | −0.001 | ||
| CoT-RNA | 0.523 | 0.288 | 0.371 | 0.257 | 0.542 | 0.285 | 0.385 | 0.263 | 0.019 | −0.003 | 0.014 | 0.006 | ||
aThe difference $\left({\rm{\Delta }}\right)$ represents the precision and MCC on test set II minus those on test set I for eight RNA contact prediction methods, respectively. |
In contrast, statistical inference-based methods suffered a performance decline. mfDCA, the best in this category, showed a 9.3% drop in precision (0.417 to 0.378) and a 17.1% decline in MCC (0.222 to 0.184) for non-local contacts (table 2). This degradation likely stems from two factors: excessive reliance on evolutionary signals and algorithmic inflexibility. Statistical inference-based methods depend on conserved covariation patterns, which weaken with low sequence similarity (test set I) or significant structural divergence (test set II). Additionally, unlike neural networks that adaptively learn features, these methods such as mfDCA employ fixed co-evolution models, making them less effective for structurally novel RNAs (e.g., TM-score < 0.48 in the test set II).
3.4. Performance on the challenging CASP test set
As shown in figure 2(C) and (D), neural network-based methods also outperformed statistical inference-based methods on test set III, with SPOT-RNA-2D leading in both contact prediction tasks. It achieved state-of-the-art precision/MCC values of 0.935/0.512 for non-local contacts and 0.752/0.569 for long-range contacts (figure 2(C) and (D)). CoCoNet ranked second (with precision/MCC values of 0.687/0.358 for non-local, and 0.535/0.398 for long-range), followed by CoT-RNA and RNAcontact, which had comparable non-local performance (0.592/0.308 versus 0.582/0.302) but diverged in long-range contact prediction.
In contrast, statistical inference-based methods exhibited progressive performance degradation from test sets I to III. For instance, in long-range contact prediction, GREMLIN's precision dropped from 0.253 (test set I) to 0.185 (test set III), with MCC values decreasing from 0.165 to 0.122, as shown in tables S5 and S7. This trend highlights a key limitation: simplified co-evolutionary assumptions in statistical methods fail to capture intricate dependencies in complex RNA architectures. As structural complexity increases (test sets I → II → III), evolutionary signals become less informative, reinforcing the advantage of neural network-based approaches for high-order structural inference.
3.5. Performance on identifying long-range tertiary contacts
Long-range tertiary interactions play a crucial role in stabilizing RNA 3D structures. They occur when residue pairs, with any non-hydrogen atoms within 6.0 Å of one another, come from distant RNA secondary structure elements [80]. Although almost all of the long-range tertiary contacts are included in non-local contacts, their distinct assessment is necessary. Here, we evaluated the number of long-range tertiary contacts among the top L non-local predictions across different methods.
Interestingly, statistical inference-based methods excel in identifying long-range tertiary interactions, significantly outperforming neural network-based approaches (figure 3). GREMLIN leads with 126 identified contacts, followed by mfDCA (96), plmDCA (89), and adabmDCA (67). In contrast, RNAcontact, the best among neural network-based methods, predicts only 52 such contacts, while SPOT-RNA-2D, despite its strong performance for predicting non-local and long-range contacts, identifies just 44. CoCoNet ranks lowest with 16 contacts. A case presentation on 8s95 from test set III (figure 4) further illustrates these differences, with long-range tertiary contacts highlighted in figure S3 of the Supplementary Material. Notably, while statistical inference-based methods identify fewer true positives overall, their correctly predicted long-range tertiary contacts differ markedly from those captured by neural network-based methods.
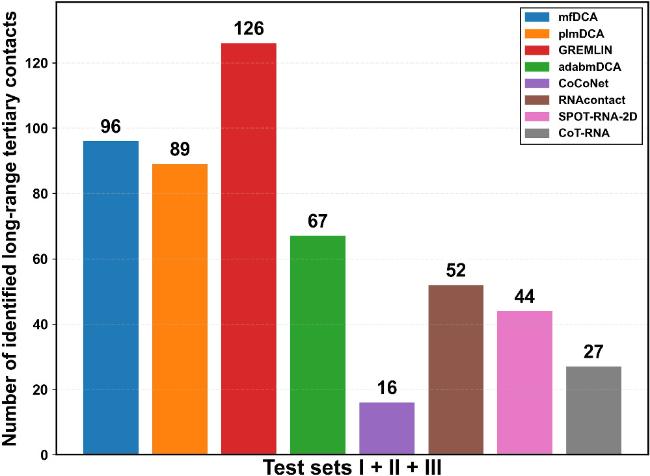
Figure 3. The total number of identified long-range tertiary contacts among the top L contacts within the non-local contacts obtained by different methods across the entire test set (test set I + II + III). |
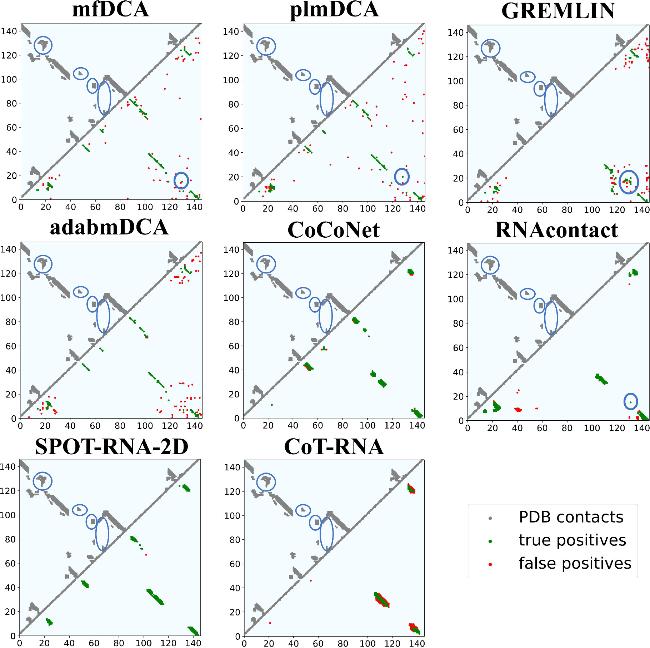
Figure 4. Comparison of predictions by eight RNA contact methods for an example RNA (PDB ID: 8s95) from test set III. The upper triangle depicts the native contacts, while the lower triangle represents the predicted top L non-local contacts. Red points denote false positives, and green points denote true positives. The native long-range tertiary contacts of 8s95 (upper triangle) and the identified native long-range tertiary contacts among top L non-local contacts (lower triangle) are circled, respectively. |
This result contrasts with previous findings on non-local (∣i − j∣ > 4) and conventional long-range contacts, where neural network-based methods (e.g., SPOT-RNA-2D) generally outperform statistical inference-based approaches in terms of precision and MCC metrics (tables S5-S7). This discrepancy likely arises from fundamental methodological differences. In RNA, long-range tertiary interactions constitute only a small fraction of all contacts (e.g., <10% in 8s95). Neural network-based approaches, which aim to predict all contacts, tend to underemphasize these rare interactions, leading to lower predictive accuracy. In contrast, statistical inference-based methods directly extract co-evolutionary signals among sequences, making them more sensitive to sparse but highly correlated tertiary contacts, and thus exhibit superior performance in identifying long-range tertiary interactions.
3.6. Runtime comparison of the different methods
To evaluate the computational efficiency of RNA contact prediction methods, all tests were performed on an Intel i7-10700 processor. To ensure consistent experimental benchmarks, the MSAs data required by these methods was pre-generated using RNAcmap. The number of sequences in each MSA is listed in table S8 of the Supplementary Material. MSA generation for the longest (7ptk, 720 nt) and shortest (8fza, 30 nt) RNAs in the test set III took 37 and 9 hours, respectively.
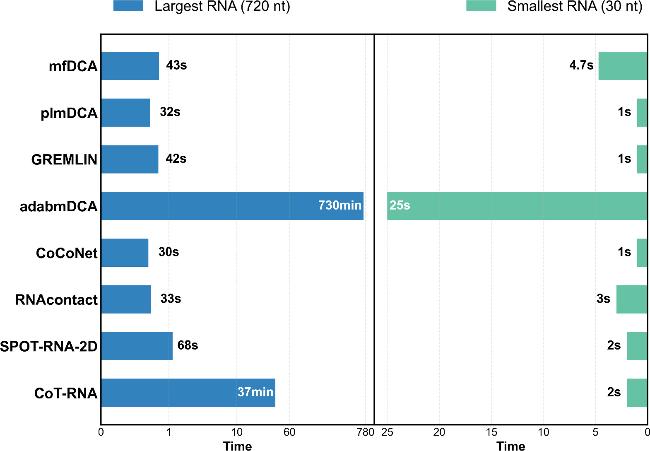
As shown in figure 5, most methods demonstrated high efficiency for the shortest RNA (30 nt). plmDCA, GREMLIN, and CoCoNet were particularly fast, completing predictions with 1 second. RNAcontact and SPOT-RNA-2D took 3 and 2 seconds respectively, while mfDCA required 4.7 seconds. adabmDCA needed the longest time of 25 seconds. These results show that these methods are highly efficient in handling short-sequence RNAs. However, for the longest RNA (720nt) in test set III, runtime varied significantly. As depicted in figure 5, CoCoNet, plmDCA, and RNAcontact exhibited the highest efficiency, requiring 30, 32, and 33 seconds, respectively. GREMLIN and mfDCA had comparable running times of 42 and 43 seconds, respectively. In contrast, CoT-RNA required 37 minutes, which was about 74 times longer than CoCoNet (30 seconds) and about 33 times longer than SPOT-RNA-2D (68 seconds). This discrepancy might stem from the complex transfer-learning architecture of CoT-RNA, which introduces additional computational burdens. Meanwhile, CoCoNet, designed with a lightweight shallow convolutional neural network, completed the 720 nt RNA in just 30 seconds, which was merely 44.1% of the time consumed by SPOT-RNA-2D. adabmDCA exhibited extreme inefficiency, requiring 730 minutes for the 720 nt RNA, likely due to its high algorithmic complexity and numerous iterative computations.
Figure 5. The time costs of eight RNA contact prediction methods for the largest RNA (720 nt) and the shortest RNA (30 nt) in test set III. |
These findings indicate that for a given MSA, the optimal method likely depends on RNA length. SPOT-RNA-2D provides both efficiency and stability for short RNAs. For long RNAs, where speed is critical, CoCoNet—although less accurate than SPOT-RNA-2D—emerges as the most practical choice.
3.7. Impact of predicted contacts on RNA 3D structure modeling
Although our benchmark comprehensively evaluates the performance of RNA contact prediction methods, their practical value in facilitating RNA 3D structure modeling is still a critical consideration. To address this, we summarize findings from recent studies that incorporated contact predictions into RNA 3D structure modeling pipelines, focusing on representative neural network-based (SPOT-RNA-2D, CoCoNet) and statistical inference-based (mfDCA) methods.
3.7.1. SPOT-RNA-2D in FARFAR2
Zhou et al integrated the contacts predicted by SPOT-RNA-2D into the FARFAR2 framework to model 30 RNAs, achieving a 13.6% reduction in mean RMSD (from 16.9 Å to 14.6 Å) [65]. For non-complex RNA structures (25 targets), the improvement was more pronounced, with an 18.1% RMSD reduction (from 15.5 Å to 12.7 Å) [65]. Nevertheless, even when native contacts were used as input, the mean RMSD was still 8.1 Å (6.5 Å for non-complexes), highlighting that current modeling accuracy is still limited by folding algorithms rather than contact prediction alone [65].
3.7.2. CoCoNet versus mfDCA in SimRNA
Schug et al compared the performance of CoCoNet and mfDCA using the SimRNA to model 10 RNAs [64]. Surprisingly, despite CoCoNet's better contact prediction, it achieved a 14.8% RMSD reduction (from 14.8 Å to 12.6 Å), whereas mfDCA achieved a 20.9% reduction (from 14.8 Å to 11.7 Å) [64]. This suggests that statistical inference-based methods such as mfDCA, despite lower overall performance (tables S5-S7), prioritize evolutionarily conserved long-range tertiary interactions (figure 3), which play pivotal roles in stabilizing global RNA structures. These sparse yet critical contacts may more effectively guide conformational sampling in physics-based folding pipelines.
3.8. Limitations of this benchmark
Although this study provides a comprehensive evaluation of RNA contact prediction methods, there are still some non-negligible limitations. First, our benchmarking framework relies on MSAs generated by RNAcmap. While section 3.1 confirms that RNAcmap improves the performance of RNAcontact, the specific choice of homology search databases and algorithms may introduce systematic biases, potentially affecting fair comparisons. Second, the scarcity of experimentally resolved RNA 3D structures restricts both the size and diversity of training and test data, limiting the model's ability to learn complex structural patterns and weakening the generalizability of method evaluations. Third, the rapid advancement of deep learning architectures diminishes the long-term relevance of current benchmarks. Therefore, future work will focus on tracking advances in neural network architectures to inform benchmark updates.
4. Conclusion
In this work, we provided a brief overview of RNA contact prediction methods and conducted a comprehensive evaluation of eight representative methods using two newly constructed test sets alongside the CASP test set. Neural network-based methods demonstrated robust performance in identifying non-local and long-range contacts, outperforming statistical inference-based methods represented by mfDCA. This highlights their ability to capture complex patterns in high-dimensional data. However, statistical inference-based methods, particularly GREMLIN, excelled in detecting long-range tertiary contacts, possibly due to their direct extraction of co-evolutionary signals from sequence covariation analysis, which enhances sensitivity to sparse but evolutionarily correlated tertiary interactions. Despite these advancements, RNA contact prediction accuracy remains unsatisfactory, especially for long-range tertiary contacts. Moreover, even the top-performing method, SPOT-RNA-2D, achieves MCC values below 0.6 for identifying non-local and long-range contact.
The performance gap highlights several strategic opportunities for methodological advancement. First, high-quality MSAs should be constructed by selecting a compact set of evolutionarily diverse homologs. Such MSAs not only enhance the signal-to-noise ratio of evolutionary information but also improve computational efficiency by reducing redundant sequence processing. Second, neural networks learn complex interaction patterns through data-driven approaches, while statistical methods detect sparse yet strongly co-evolutionary interactions that rely on evolutionary conservation. Our Jaccard similarity analysis further validates the differences between these approaches, which supports integration strategies that combine their complementary strengths. For example, statistical contact matrices can serve as attention weights in neural networks to direct focus towards evolutionarily conserved regions. Alternatively, a weighted voting strategy merges low inter-method overlap predictions to enhance the coverage of critical contacts. Third, developing contact predictors specifically designed to predict long-range tertiary contacts-a key determinant of RNA 3D structure modeling-is imperative. Such dedicated predictors would significantly enhance structural prediction by explicitly addressing the sparsity and complex dependencies inherent in tertiary contacts. Finally, the continuous expansion of high-resolution, structurally diverse, and conformationally complex RNA structures in the PDB databases will address current data limitations, providing a robust foundation for neural network-based methods to predict critical RNA contacts.