


1. Introduction
Two-dimensional lattice band models have been intensively studied in the context of band structure because Bloch electrons in such models give rise to exotic quantum effects. Such two-dimensional materials have been synthesized in various structures, and one of the most recently noted structures is the kagome lattice [1, 2]. The Kagome structure is composed of regular hexagons and surrounding equilateral triangles, vice versa [3–6]. Such lattice geometry gives rise to the gapless electronic structure that can be described by three-band model, including two massless Dirac bands and a flat band. These two Dirac bands are similar to that of graphene, which endows the kagome lattice with many exotic properties observed in graphene. The flat band further enriches topological physical properties [7–9], such as topological insulators, Chern insulators, and fractional quantum Hall phases [3, 10]. Experimentally, various kagome lattice materials have been fabricated and their band structures can be verified using the scanning tunneling microscope or angle-resolved photoemission spectroscopy (ARPES) [11–15]. This ARPES study utilized density functional theory calculations and confirmed the frustrated nature of the flat band by analyzing the chiral d-orbital texture through Wannier functions. Based on this study, the opening of the energy gap around 80 meV is resulted under applying spin–orbit coupling.
The Dirac bands feature massless electrons in flat bands, akin to photons in linear equations. On the other hand, electrons in flat bands are characterized by infinite mass. Additionally, the position of the flat band is determined by the sign of the lattice hopping [16]. The arrangement of the flat band and Dirac bands is different from the kagome lattice. The kagome lattice structure can be resulted by replacing the sites of the honeycomb lattice with corner-sharing triangles. One notable example being the kagome lattice is the metal-organic framework. These materials have garnered significant attention from the scientific community due to their applications in various fields such as magnetic and electric properties, luminescence, and catalysis [17, 18].
Nearby flat band may substantially impact anomalous low-energy physics [19]. Such issue carries promising implications for further exploration of exotic phenomena. According to the band filling and interaction between electrons, the physical properties are justified by charge density wave [20], spin density wave and superconductivity [21]. Charge density wave is close to the van Hove singularity at the Fermi level, contributing to the intriguing superconductivity properties observed in the kagome lattice. The optical and topological properties of the kagome network due to spin–orbit coupling were investigated using tight binding model [22]. However, electronic and transport properties of kagome structure under both spin–orbit coupling and impurity doping effects have not been thoroughly explored theoretically.
The intrinsic spin–orbit coupling plays an important role in the topological and thermal properties of honeycomb structures such as phosphorene plane. Such coupling arises from perpendicular electric field or interaction with a substrate. Based on extensive theoretical studies, opening a bulk gap in band structure of some two-dimensional lattices, such as graphene plane, originates from both spin–orbit coupling and exchange field factors so that leads to the quantum spin Hall effect [23, 24]. In the band structure where the Dirac bands intersect, signifying symmetry in the structure, the two lines become separated under the impact of spin–orbit coupling [25]. Kane and Mele [26] have applied a simple model to describe physical properties of topological insulators. This model Hamiltonian includes a tight binding term for hopping amplitudes of electrons on lattice sites of the structure and also an intrinsic spin–orbit coupling term on the honeycomb structures. The microscopic Kane–Mele model for topological insulator has been originally applied to describe the quantum spin Hall effect in graphene-like structures [26]. In this work, we have analyzed the impact of spin–orbit coupling on the band structure of the materials, taking into account lattice symmetry.
Peres et al studied the physical properties of graphene, in the Dirac Hamiltonian limit, including the effect of disorder in a self consistent Born approximation [27]. The effects of disorder doping on optical conductivity of graphene bilayer was done by Koshino and Ando [28] and by Nilsson et al [29, 30]. Abergel and Falko first computed the optical conductivity of a clean bilayer [31], and generalized to the biased bilayer case by Nicol and Carbotte [32]. Some results on electronic properties of graphene layer show that the magneto-optical response can be tuned in the microwave-to-terahertz and visible frequency ranges in contrast with a conventional two-dimensional electron gas [33]. However, the effects of impurity atoms on electronic and transport properties of kagome lattice is an open problem and we have focused in this paper.
Nevertheless, just like single layer graphene [34], bilayer graphene is also sensitive to the unavoidable disorder generated by the environment of the SiO2 substrate: adatoms, ionized impurities, etc. Disorder generates a scattering rate τ and hence a characteristic energy scale ℏ/τ which is the order of the Fermi energy EF = ℏvFkF (${k}_{{\rm{F}}}\propto \sqrt{n}$ is the Fermi momentum and n is the planar density of electrons) when the chemical potential is close to the Dirac point (n → 0). Thus, one expects disorder to have a strong effect in the physical properties of graphene. Indeed, theoretical studies of the effect of disorder in unbiased [35] and biased [36] graphene bilayer show that disorder leads to strong modifications of its transport and spectroscopic properties. The understanding of the effects of disorder in this new class of materials is fundamental for any future technological applications. On the other hand, the investigation of spin–orbit coupling and disorder effects on electronic properties of two-dimensional kagome structure can be interesting from theoretical and experimental viewpoints.
The purpose of this paper is to provide a Kane–Mele model including intrinsic spin-orbit and interaction impurity scattering Hamiltonian for studying the density of states and the temperature dependence of thermodynamic, transport and thermoelectric properties of kagome structure within the well-known self-consistent Born approximation [37–40]. Such impurity scattering mechanisms break the translational symmetry of crystal so that it introduces the scattering of electrons from impurities situated at randomly distributed but fixed positions. Especially, the effects of spin–orbit coupling strength and impurity concentration on temperature dependence of specific heat and Pauli paramagnetic susceptibility has been studied. Thermal and electrical conductivities of two-dimensional kagome lattice as a function of temperature are calculated for different scattering potential strengths. We also study effects of impurity concentration and scattering potential strengths on the transport properties of the structure. Moreover, we have analyzed the behaviors of thermopower power (Seebeck coefficient) and figure of merit of kagome Structure in the presence of impurity doping in the presence of spin–orbit coupling. Also we discuss and analyze to show how spin–orbit coupling and impurity concentration affect the temperature of transport properties of the kagome lattice.
2. Model Hamiltonian for clean kagome lattice
In figure 1, the crystal structure of kagome lattice has been depicted. This figure implies the unit cell of kagome structure has two constructing vectors shown by a1 = ai and ${{\boldsymbol{a}}}_{2}=a{\boldsymbol{i}}+a\frac{\sqrt{3}}{2}{\boldsymbol{j}}$ in which a is the length of each constructing vector. As shown in figure 1, each unit cell of kagome lattice comprises atomic basis A, B, C. The Kane–Mele model Hamiltonian [26] (H(0)) model for clean kagome structure is composed of tight binding model (HTB) and the intrinsic spin–orbit coupling (HISOC) as 3 ), the model Hamiltonian in equation (1 ) is expressed in terms of Fourier transformations of creation operators as 5 ) are expressed in terms of hopping amplitude t and spin–orbit coupling strength λ. Based on constructing vectors of unit cell of kagome lattice as a1 = ai and ${{\boldsymbol{a}}}_{2}=a\frac{1}{2}{\boldsymbol{i}}+a\frac{\sqrt{3}}{2}{\boldsymbol{j}}$, we obtain the following expressions for matrix elements of ${{ \mathcal H }}_{{\boldsymbol{k}}}$ as
$\begin{eqnarray}{H}^{(0)}={H}^{\mathrm{TB}}+{H}^{\mathrm{ISOC}}.\end{eqnarray}$
The tight binding part, i.e. HTB and the spin–orbit coupling term HISOC of the model Hamiltonian of clean kagome structure are given by $\begin{eqnarray}\begin{array}{rcl}{H}^{\mathrm{TB}} & = & -t\displaystyle \sum _{\langle i,\alpha ;j,\beta \rangle }\displaystyle \sum _{\sigma =\uparrow ,\downarrow }\left({c}_{j,\beta }^{\sigma \dagger }{c}_{i,\alpha }^{\sigma }+h.c.\right)-\displaystyle \sum _{i,\alpha ,\sigma }\mu \left({c}_{i,\alpha }^{\dagger \sigma }{c}_{i,\alpha }^{\sigma }\right),\\ {H}^{\mathrm{ISOC}} & = & {\rm{i}}\lambda \displaystyle \sum _{\langle \langle i,\alpha ;j,\beta \rangle \rangle }\displaystyle \sum _{\sigma ,{\sigma }^{{\prime} }=\uparrow ,\downarrow }\left({\nu }_{ij}^{\alpha \beta }{c}_{j,\beta }^{\dagger \sigma }{\sigma }_{\sigma {\sigma }^{{\prime} }}^{z}{c}_{i,\alpha }^{{\sigma }^{{\prime} }}\right)\cdot \end{array}\end{eqnarray}$
Here ${c}_{i,\alpha }^{\sigma }$ is annihilation operator of electron with spin σ on sublattice α = A, B, C in unit cell index i. ⟨i, α;j, β⟩ denotes the nearest neighbor atomic sites while ⟨⟨i, α;j, β⟩⟩ implies the next nearest neighbor sites. The operators fulfill the fermionic standard anticommutation relations $\{{c}_{i,\alpha }^{\sigma },{c}_{j,\beta }^{{\sigma }^{{\prime} }\dagger }\}={\delta }_{ij}{\delta }_{\sigma {\sigma }^{{\prime} }}{\delta }_{\alpha \beta }$. The hopping parameter amplitudes t, i.e. the hopping amplitude of electron from atom located in unit cell i on sublattice α to atom located in unit cell j on sublattice β. μ refers to chemical potential which gets the zero value at half filling case. Half filling means the unit value for electronic population per atomic site. The spin–orbit coupling strength is denoted by the parameter λ. The third Pauli matrix is σz, and ${\nu }_{ji}^{a(b)}=\pm 1$ is discussed in the following. Depending on the orientation of the sites, the expression ${\nu }_{ji}^{a(b)}=\pm 1$. A standard statement for ${\nu }_{ij}^{\alpha \beta }$ in each sublattice α = A, B, C is ${\nu }_{ij}^{\alpha \beta }={\left(\frac{{{\boldsymbol{d}}}_{j}^{\beta }\times {{\boldsymbol{d}}}_{i}^{\alpha }}{| {{\boldsymbol{d}}}_{j}^{\beta }\times {{\boldsymbol{d}}}_{i}^{\alpha }| }\right)}_{z}=\pm 1$ where ${{\boldsymbol{d}}}_{j}^{\beta }$ and ${{\boldsymbol{d}}}_{i}^{\alpha }$ are the two unit vectors along the nearest neighbor bonds connecting lattice site i, α to its next-nearest neighbor j, β. On the other hand, the Fourier transformation of fermionic creation operator ${c}_{{\boldsymbol{k}},\alpha }^{\sigma }$ is defined as $\begin{eqnarray}{c}_{{\boldsymbol{k}},\alpha }^{\sigma }=\frac{1}{\sqrt{N}}\displaystyle \sum _{i}{{\rm{e}}}^{{\rm{i}}{\boldsymbol{k}}\cdot {{\boldsymbol{R}}}_{i}}{c}_{i,\alpha }^{\sigma },\end{eqnarray}$
where k defines the wave vectors belonging to the first Brillouin zone of kagome structure and Ri is the position vector of lattice unit cell in kagome lattice. Also N describes the number of unit cells. Based on equation ( $\begin{eqnarray}{H}^{(0)}=\displaystyle \sum _{{\boldsymbol{k}},\sigma }{{\rm{\Psi }}}_{{\boldsymbol{k}}}^{\sigma \dagger }{{ \mathcal H }}_{{\boldsymbol{k}}}{{\rm{\Psi }}}_{{\boldsymbol{k}}}^{\sigma },\ \ {{\rm{\Psi }}}_{{\boldsymbol{k}}}^{\sigma }=\left(\begin{array}{c}{c}_{{\boldsymbol{k}},A}^{\sigma }\\ {c}_{{\boldsymbol{k}},B}^{\sigma }\\ {c}_{{\boldsymbol{k}},C}^{\sigma }\end{array}\right).\end{eqnarray}$
${{ \mathcal H }}_{{\boldsymbol{k}}}$ is given as a 3 × 3 matrix as follows $\begin{eqnarray}{{ \mathcal H }}_{{\boldsymbol{k}}}=\left(\begin{array}{ccc}{H}_{AA}({\boldsymbol{k}}) & {H}_{AB}({\boldsymbol{k}}) & {H}_{AC}({\boldsymbol{k}})\\ {H}_{BA}({\boldsymbol{k}}) & {H}_{BB}({\boldsymbol{k}}) & {H}_{BC}({\boldsymbol{k}})\\ {H}_{CA}({\boldsymbol{k}}) & {H}_{CB}({\boldsymbol{k}}) & {H}_{CC}({\boldsymbol{k}})\end{array}\right).\end{eqnarray}$
The matrix elements in equation ( $\begin{eqnarray}\begin{array}{rcl}{H}_{AA}({\boldsymbol{k}}) & = & -\mu ,\ \ {H}_{AB}({\boldsymbol{k}})=t(1+{{\rm{e}}}^{-{\rm{i}}{k}_{x}a})\\ & & +2{\rm{i}}\lambda {{\rm{e}}}^{-{\rm{i}}\frac{a}{2}{k}_{x}}\cos \left(\frac{\sqrt{3}a}{2}{k}_{y}\right),\\ {H}_{AC}({\boldsymbol{k}}) & = & t\left(1+{{\rm{e}}}^{-{\rm{i}}\frac{a}{2}({k}_{x}+\sqrt{3}{k}_{y})}\right)+{\rm{i}}\lambda \left({{\rm{e}}}^{{\rm{i}}\frac{a}{2}({k}_{x}-\sqrt{3}{k}_{y})}+{{\rm{e}}}^{-{\rm{i}}{k}_{x}a}\right),\\ {H}_{BA}({\boldsymbol{k}}) & = & t(1+{{\rm{e}}}^{{\rm{i}}{\boldsymbol{k}}.{{\boldsymbol{a}}}_{1}})-2{\rm{i}}\lambda {{\rm{e}}}^{{\rm{i}}\frac{a}{2}{k}_{x}}\cos \Space{0ex}{0.25ex}{0ex}(\frac{\sqrt{3}a}{2}{k}_{y}\Space{0ex}{0.25ex}{0ex}),\\ {H}_{BB}({\boldsymbol{k}}) & = & -\mu ,\\ {H}_{BC}({\boldsymbol{k}}) & = & t(1+{{\rm{e}}}^{{\rm{i}}\frac{a}{2}({k}_{x}-\sqrt{3}{k}_{y})})+{\rm{i}}\lambda \left({{\rm{e}}}^{{\rm{i}}{k}_{x}a}+{{\rm{e}}}^{-{\rm{i}}\frac{a}{2}({k}_{x}+\sqrt{3}{k}_{y})}\right),\\ {H}_{CA}({\boldsymbol{k}}) & = & t\left(1+{{\rm{e}}}^{{\rm{i}}\frac{a}{2}({k}_{x}+\sqrt{3}{k}_{y})}\right)-{\rm{i}}\lambda \left({{\rm{e}}}^{-{\rm{i}}\frac{a}{2}({k}_{x}-\sqrt{3}{k}_{y})}+{{\rm{e}}}^{{\rm{i}}{k}_{x}a}\right),\\ {H}_{CB}({\boldsymbol{k}}) & = & t(1+{{\rm{e}}}^{-{\rm{i}}\frac{a}{2}({k}_{x}-\sqrt{3}{k}_{y})})-{\rm{i}}\lambda \left({{\rm{e}}}^{-{\rm{i}}{k}_{x}a}+{e}^{{\rm{i}}\frac{a}{2}({k}_{x}+\sqrt{3}{k}_{y})}\right),\\ {H}_{CC}({\boldsymbol{k}}) & = & -\mu ,\end{array}\end{eqnarray}$
where wave vector k = ikx + jky belongs to the first Brillouin zone of the kagome lattice which is similar to that of a honeycomb structure.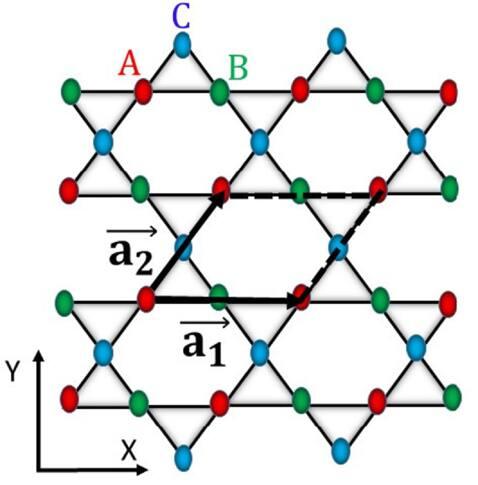
Figure 1. Structure of a kagome lattice, consisting of three sublattices, A, B and C. a1 = ai and ${{\boldsymbol{a}}}_{2}=a{\boldsymbol{i}}+a\frac{\sqrt{3}}{2}{\boldsymbol{j}}$ are two constructing vectors of the unit cell. |
In the presence of impurity atoms in the kagome lattice, we should add that the Hamiltonian consists of two parts: H = H(0) + Himp. Since each unit cell of the kagome lattice includes 3 basis atom types A, B and C, the Green’s function of model Hamiltonian in equation (1 ) can be written as the 3 × 3 matrix. At finite temperature [41], Matsubara’s Green’s function matrix of clean kagome lattice is defined by [41]8 ), the Fourier transformations of Green’s function matrix elements of clean system can be found.
$\begin{eqnarray}{{\boldsymbol{G}}}^{(0)}({\boldsymbol{k}},{\rm{i}}{\omega }_{n})={({\rm{i}}{\omega }_{n}{\bf{1}}-{{ \mathcal H }}_{{\boldsymbol{k}}})}^{-1},\end{eqnarray}$
where 1 denotes the 3 × 3 unit matrix. With the introduction of the matrix elements of clean Green’s function as ${G}_{\alpha \beta }^{(0)}({\boldsymbol{k}},{\rm{i}}{\omega }_{n})$ where α, β = A, B, C, the matrix form of above equation can be given by $\begin{eqnarray}\begin{array}{l}\left(\begin{array}{ccc}{G}_{AA}^{(0)}({\boldsymbol{k}},{\rm{i}}{\omega }_{n}) & {G}_{AB}^{(0)}({\boldsymbol{k}},{\rm{i}}{\omega }_{n}) & {G}_{AC}^{(0)}({\boldsymbol{k}},{\rm{i}}{\omega }_{n})\\ {G}_{BA}^{(0)}({\boldsymbol{k}},{\rm{i}}{\omega }_{n}) & {G}_{BB}^{(0)}({\boldsymbol{k}},{\rm{i}}{\omega }_{n}) & {G}_{BC}^{(0)}({\boldsymbol{k}},{\rm{i}}{\omega }_{n})\\ {G}_{CA}^{(0)}({\boldsymbol{k}},{\rm{i}}{\omega }_{n}) & {G}_{CB}^{(0)}({\boldsymbol{k}},{\rm{i}}{\omega }_{n}) & {G}_{CC}^{(0)}({\boldsymbol{k}},{\rm{i}}{\omega }_{n})\end{array}\right)\\ =\,{\left(\begin{array}{ccc}{\rm{i}}{\omega }_{n}-{H}_{AA}({\boldsymbol{k}}) & -{H}_{AB}({\boldsymbol{k}}) & -{H}_{AC}({\boldsymbol{k}})\\ -{H}_{BA}({\boldsymbol{k}}) & {\rm{i}}{\omega }_{n}-{H}_{BB}({\boldsymbol{k}}) & -{H}_{BC}({\boldsymbol{k}})\\ -{H}_{CA}({\boldsymbol{k}}) & -{H}_{CB}({\boldsymbol{k}}) & {\rm{i}}{\omega }_{n}-{H}_{CC}({\boldsymbol{k}})\end{array}\right)}^{-1}.\end{array}\end{eqnarray}$
Here, ωn = (2n + 1)πkBT with integer number n denotes Matsubara fermionic frequency. Also kB is the Boltzmann constant and T introduces equilibrium temperature of the system. After performing algebraic calculations in equation (In the single impurity case, impurity scattering Hamiltonian is added to the Hamiltonian of the clean system. Such a local energy term is given by
$\begin{eqnarray}{H}_{\mathrm{imp}}=\frac{v}{3N}\displaystyle \sum _{\alpha }\displaystyle \sum _{\sigma =\uparrow ,\downarrow }\displaystyle \sum _{{\boldsymbol{k}},{\boldsymbol{q}}}{c}_{\alpha ,{\boldsymbol{k}}+{\boldsymbol{q}}}^{\sigma \dagger }{c}_{\alpha ,{\boldsymbol{k}}}^{\sigma },\end{eqnarray}$
where v is the electron-impurity potential strength and 3N describes the number of atoms in the lattice. This term breaks the translational symmetry of crystal so that it introduces the scattering of electrons from impurities situated at randomly distributed but fixed positions. Under half filling constraint corresponding to one electron per each lattice site chemical potential (μ) gets zero value.According to the Born approximation and T-matrix approach in the scattering theory [42], the electronic self-energy matrix of disordered system in the presence of finite but small density of impurity atoms, n = Ni/N, could be obtained as 10 ), leading to full self-consistent Born approximation. Under neglecting intersite correlations, the self-consistent problem requires the solution of the equation 1 ) as 5 ), (6 ). 1 is the 3 × 3 unit matrix. Based on matrix forms of Green’s function of clean system and diagonal form of self-energy matrix with its elements in equation (12 ), the following matrix form for G is obtained as 12 ) can be obtained. For finding the self-energy using equation (12 ), the process is started with an initial guess for self-energy matrix elements ΣAA, ΣBB and then we can find the results for Green’s function of disordered system using equation (15 ). The obtained results of GAA, GBB and GCC are utilized for finding the new values for ${{\rm{\Sigma }}}_{AA},{{\rm{\Sigma }}}_{BB}^{\sigma },{{\rm{\Sigma }}}_{CC}^{\sigma }$ according to equation (12 ). These calculations are repeated until convergence is reached for obtaining numerical values of self-energy matrix elements. The final converged numerical results of Σαα(E) are used in order to find diagonal matrix elements of Green’s function of disordered system via the Dyson equation according to equation (15 ).
$\begin{eqnarray}{\boldsymbol{\Sigma }}({\rm{i}}{\omega }_{n})={N}_{i}{{\boldsymbol{T}}}_{\mathrm{imp}}({\rm{i}}{\omega }_{n})=\frac{nv}{1-v{\overline{{\boldsymbol{G}}}}^{(0)}({\rm{i}}{\omega }_{n})},\end{eqnarray}$
where Ni is the number of impurity atoms and v denotes the electronic on-site energy which shows the strength of scattering potential. The local propagator of clean system ${\overline{{\boldsymbol{G}}}}^{(0)}$ is given by $\begin{eqnarray}{\overline{{\boldsymbol{G}}}}^{(0)}({\rm{i}}{\omega }_{n})=\frac{1}{3N}\displaystyle \sum _{{\boldsymbol{k}}}{{\boldsymbol{G}}}^{(0)}({\boldsymbol{k}},{\rm{i}}{\omega }_{n}).\end{eqnarray}$
In order to include some contributions from multiple site scattering, we replace the local bare Green’s function G(0)(iωn) with a local full one (G(iωn)) in the expression of the self-energy matrix in equation ( $\begin{eqnarray}{{\boldsymbol{\Sigma }}}_{\alpha \alpha }(E)=\frac{nv}{1-v{G}_{\alpha \alpha }(E)}=\frac{nv}{1-v{G}_{\alpha \alpha }(E+{\rm{i}}{0}^{+},{{\rm{\Sigma }}}_{\alpha \alpha }(E))},\end{eqnarray}$
where a simple analytical continuation as iωn ⟶ E + i0+ has been performed to obtain retarded self-energy. α = A, B, C implies the sublattice index for kagome lattice. On the other hand, Dyson’s equation [41] gives us the Green’s function matrix of disordered system (G) in terms of self-energy matrix and Green’s function matrix (G(0)) of clean system as $\begin{eqnarray}{{\boldsymbol{G}}}^{-1}({\boldsymbol{k}},{\rm{i}}{\omega }_{n})={({{\boldsymbol{G}}}^{(0)}({\boldsymbol{k}},{\rm{i}}{\omega }_{n}))}^{-1}-{\boldsymbol{\Sigma }}({\rm{i}}{\omega }_{n}),\end{eqnarray}$
where we can write the matrix form of G(0) using Kane–Mele model Hamiltonian of clean system in equation ( $\begin{eqnarray}{({{\boldsymbol{G}}}^{(0)}({\boldsymbol{k}},{\rm{i}}{\omega }_{n}))}^{-1}={\rm{i}}{\omega }_{n}{\bf{1}}-{{ \mathcal H }}_{{\boldsymbol{k}}},\end{eqnarray}$
where the matrix form and matrix elements of ${{ \mathcal H }}_{{\boldsymbol{k}}}$ for clean kagome lattice are given in equations ( $\begin{eqnarray}\begin{array}{l}{\boldsymbol{G}}({\boldsymbol{k}},{\rm{i}}{\omega }_{n})={\left(\begin{array}{ccc}{\rm{i}}{\omega }_{n}-{H}_{AA}({\boldsymbol{k}})-{{\rm{\Sigma }}}_{AA}({\rm{i}}{\omega }_{n}) & -{H}_{AB}({\boldsymbol{k}}) & -{H}_{AC}({\boldsymbol{k}})\\ -{H}_{BA}({\boldsymbol{k}}) & {\rm{i}}{\omega }_{n}-{H}_{BB}({\boldsymbol{k}})-{{\rm{\Sigma }}}_{BB}({\rm{i}}{\omega }_{n}) & -{H}_{BC}({\boldsymbol{k}})\\ -{H}_{CA}({\boldsymbol{k}}) & -{H}_{CB}({\boldsymbol{k}}) & {\rm{i}}{\omega }_{n}-{H}_{CC}({\boldsymbol{k}})-{{\rm{\Sigma }}}_{CC}({\rm{i}}{\omega }_{n})\end{array}\right)}^{-1}.\end{array}\end{eqnarray}$
After analytical continuation as iωn ⟶ E + i0+, the required diagonal matrix elements of Green’s function of disordered kagome, i.e. Gαα(k, E) with α = A, B, C, for self consequent solution of equation (The band energy dispersions of clean kagome lattice are found by solving the following characteristic equation 5 ), (6 ). Equation (16 ) can be solved numerically and the band dispersions Eη(k) can be found as functions of spin–orbit coupling strength λ, wave vector k and hopping amplitude t.
$\begin{eqnarray}\det \left({{ \mathcal H }}_{{\boldsymbol{k}}}-{E}_{\eta }({\boldsymbol{k}}){{\bf{1}}}_{3\times 3}\right)=0,\end{eqnarray}$
where η = 1, 2, 3 denotes the band energy quantum number and the matrix form of ${{ \mathcal H }}_{{\boldsymbol{k}}}$ has been given in equations (Based on band energy dispersions, the model Hamiltonian of clean kagome lattice, i.e. H(0), can be rewritten as 16 ). Now, the Fourier transformations of the matrix elements of Green’s function of clean kagome lattice with Hamiltonian H(0) in band energy index Hilbert space are given by 12 ) have been expressed in atomic basis Hilbert space. It can be suitable to rewrite the self-energy matrix in band energy Hilbert space. For this purpose, we have used the operator transformations in equation (18 ) in which the unitary transformation matrix elements ${{ \mathcal F }}_{\eta \alpha }({\boldsymbol{k}})$ relate two different Hilbert spaces to each other. Thus diagonalized self-energy matrix elements in band index Hilbert space, i.e. Σηη(k, iωn), are expanded in terms of matrix elements Σαα(k, iωn) as following 20 ) and by applying the Dyson’s equation [41] the Green’s function matrix elements of disordered kagome lattice in band index representation, i.e. Gηη(k, iωn), get the relation
$\begin{eqnarray}{H}^{(0)}=\displaystyle \sum _{\eta =\pm }\displaystyle \sum _{{\boldsymbol{k}}}{E}_{\eta }({\boldsymbol{k}}){{ \mathcal C }}_{\eta ,{\boldsymbol{k}}}^{\sigma \dagger }{{ \mathcal C }}_{\eta ,{\boldsymbol{k}}}^{\sigma }.\end{eqnarray}$
The operators ${{ \mathcal C }}_{\eta ,{\boldsymbol{k}}}^{\sigma \dagger }$ creates one electron with spin σ at quantum energy levels with quantum numbers η, k. Using the eigenfunctions of matrix ${{ \mathcal H }}_{{\boldsymbol{k}}}$, we can expand new operators ${{ \mathcal C }}_{\eta ,{\boldsymbol{k}}}^{\sigma \dagger }$ in terms of creation operators ${c}_{{\boldsymbol{k}},\alpha }^{\sigma \dagger }$ as follows $\begin{eqnarray}{{ \mathcal C }}_{\eta ,{\boldsymbol{k}}}^{\sigma \dagger }=\displaystyle \sum _{\alpha }{{ \mathcal F }}_{\eta \alpha }({\boldsymbol{k}}){c}_{{\boldsymbol{k}},\alpha }^{\sigma \dagger },\end{eqnarray}$
where ${{ \mathcal F }}_{\eta \alpha }({\boldsymbol{k}})$ are matrix elements of eigenfunction of Hamiltonian matrix ${{ \mathcal H }}_{{\boldsymbol{k}}}$ for each eigenvalue Eη(k). Such eigenfunctions can be determined by numerical solution of characteristic equation in equation ( $\begin{eqnarray}{G}_{\eta {\eta }^{{\prime} }}^{(0)}({\boldsymbol{k}},{\rm{i}}{\omega }_{n})=\frac{1}{{\rm{i}}{\omega }_{n}-{E}_{\eta }({\boldsymbol{k}})}{\delta }_{\eta {\eta }^{{\prime} }}.\end{eqnarray}$
The results for self-energy matrix elements in equation ( $\begin{eqnarray}{{\rm{\Sigma }}}_{\eta \eta }({\boldsymbol{k}},{\rm{i}}{\omega }_{n})=\displaystyle \sum _{\alpha =A,B,C}| {{ \mathcal F }}_{\eta \alpha }({\boldsymbol{k}}){| }^{2}{{\rm{\Sigma }}}_{\alpha \alpha }({\boldsymbol{k}},{\rm{i}}{\omega }_{n}).\end{eqnarray}$
By using the self-energy matrix elements in equation ( $\begin{eqnarray}{G}_{\eta \eta }({\boldsymbol{k}},{\rm{i}}{\omega }_{n})=\frac{1}{{\rm{i}}{\omega }_{n}-{E}_{\eta }({\boldsymbol{k}})-{{\rm{\Sigma }}}_{\eta \eta }({\boldsymbol{k}},{\rm{i}}{\omega }_{n})}.\end{eqnarray}$
The electronic density of states of disordered kagome structure can be readily derived by using electronic Green’s function in equation (21 ) as
$\begin{eqnarray}D(E)=-\frac{1}{3\pi N}\mathrm{Im}\displaystyle \sum _{{\boldsymbol{k}},\sigma ,\eta }{G}_{\eta \eta }^{\sigma }({\boldsymbol{k}},{\rm{i}}{\omega }_{n}\longrightarrow E+{\rm{i}}{0}^{+}).\end{eqnarray}$
The wave vectors region is considered to be in the first Brillouin zone of honeycomb structure. The density of states includes prominent asymmetric peaks due to the band edge of parabolic subbands. The peak positions arise from the band edge state energies and the density of states heights are proportional to the inverse square root of the subband curvature and band degeneracy.The density of states D(E) can be exploited to determine the chemical potential, μ, based on the relation between concentration of electrons (ne) and chemical potential as 23 ). Here, we add a few comments regarding self-consistent Born approximation (SCBA). The SCBA is widely used for modeling disorder effects in multiband systems, including kagome and honeycomb lattices, due to its ability to account for impurity scattering in a self-consistent manner. Below, we provide a more rigorous justification for our approach: 1) Neglecting Intersite Correlations: The assumption of neglecting intersite correlations is commonly employed in SCBA when the disorder potential is short-ranged (such as on-site disorder) and randomly distributed over the lattice. This allows the self-energy to be treated as a local quantity, simplifying the Dyson equation. In kagome systems, disorder effects have been studied under similar approximations (e.g., local impurity models) where SCBA successfully captures key physical behaviors. The justification for this assumption is supported by previous works that analyze disorder in multiband systems, including honeycomb and kagome lattices [27, 38].
$\begin{eqnarray}{n}_{e}={\int }_{-\infty }^{\infty }{\rm{d}}ED(E)\frac{1}{{{\rm{e}}}^{\frac{E-\mu }{{k}_{{\rm{B}}}T}}+1}.\end{eqnarray}$
Based on the values of electronic concentration ne, the chemical potential, μ, can be obtained by means equation (2) SCBA in Multiband Systems: The SCBA has been successfully applied to systems with multiple sublattices, such as graphene bilayers and topological insulators, where similar approximations have been made. The method assumes that the disorder is weak enough to be treated perturbatively but strong enough to modify the density of states and transport properties. In kagome lattices, SCBA has been used to analyze disorder-induced localization and modifications to electronic structure [43, 44]. We will include references to prior studies that have employed SCBA in similar contexts.
3. Transport properties of disordered kagome lattice
In order to find transport as well as thermoelectric properties of disordered kagome structure, we should calculate the transport coefficients within linear response theory. Based on this theory, the transport coefficients under the assumption of weak perturbing field, i.e weak gradient of temperature and weak gradient of external electric potential are found. Transport coefficients, i.e. ${{ \mathcal L }}_{11},{{ \mathcal L }}_{12},{{ \mathcal L }}_{22}$, relate the the charge and thermal current to the gradients of electric potential and temperature as motive forces [41]17 ). The electrical (thermal) current operator Je (JQ) for itinerant electrons in disordered kagome lattice in the context of Kane–Mele model Hamiltonian is reduced to 27 ) into equation (26 ) and using Fourier transformation of fermionic Green’s function, i.e. ${G}_{\eta \eta }({\boldsymbol{k}},\tau )={k}_{{\rm{B}}}T{\sum }_{m}{{\rm{e}}}^{-{\rm{i}}{\omega }_{m}\tau }{G}_{\eta \eta }({\boldsymbol{k}},{\rm{i}}{\omega }_{m})$, transport ${{ \mathcal L }}_{11}$ can be expressed in terms of electronic Green’s function of disordered kagome lattice as 21 ), the results of transport coefficients are obtained based on equations (30 ), (31 ). For this purpose, the numerical integration should be performed over wave vector through the first Brillouin zone of the kagome lattice. Since the scattering effects of electrons from impurity atoms on band index electronic Green’s function of disordered kagome lattice, i.e. Gηη in equation (21 ), are accounted for by self-energy Σηη, thus transport coefficients are connected to the self-energy Σηη. Transport coefficients are computed using the spectral function, which is derived from the imaginary part of the Green’s function in the band representation: ${{ \mathcal A }}_{\eta }({\boldsymbol{k}},\epsilon )\equiv -2\mathrm{Im}{G}_{\eta \eta }({\boldsymbol{k}},{\rm{i}}{\omega }_{n}\longrightarrow \epsilon +{\rm{i}}{0}^{+})$ The electrical conductivity, Seebeck coefficient, and thermal conductivity are then obtained through the Kubo-Greenwood formalism, which involves integration over the spectral function weighted by Fermi–Dirac derivatives.
$\begin{eqnarray}\begin{array}{rcl}{{\boldsymbol{J}}}_{e} & = & {{ \mathcal L }}_{11}(-{\rm{\nabla }}\,V)+{{ \mathcal L }}_{12}(-{\boldsymbol{\nabla }}T),\\ {{\boldsymbol{J}}}_{Q} & = & {{ \mathcal L }}_{21}(-{\rm{\nabla }}\,V)+{{ \mathcal L }}_{22}(-{\boldsymbol{\nabla }}T),\end{array}\end{eqnarray}$
where Je(JQ) implies electrical (thermal) current density. Also Lab(a, b = 1, 2) are determined by calculating correlation function between the electrical and thermal current operators. Imposing the continuity equation for both charge and energy densities, the explicit form of the electrical and thermal current operators can be calculated. This calculation has been done for a bilinear Hamiltonian describing Fermionic system [41] and we can exploit this result for model Hamiltonian in equation ( $\begin{eqnarray}{{\boldsymbol{J}}}_{e}=\displaystyle \sum _{{\boldsymbol{k}},\sigma ,\eta }{{\boldsymbol{v}}}_{\eta }({\boldsymbol{k}}){c}_{\eta ,{\bf{k}}}^{\dagger \sigma }{c}_{\eta ,{\boldsymbol{k}}}^{\sigma },\ \ {{\boldsymbol{J}}}_{Q}=\displaystyle \sum _{{\boldsymbol{k}},\sigma ,\eta }{E}_{\eta }({\boldsymbol{k}}){{\boldsymbol{v}}}_{\eta }({\boldsymbol{k}}){c}_{\eta ,{\boldsymbol{k}}}^{\dagger \sigma }{c}_{\eta ,{\boldsymbol{k}}}^{\sigma },\end{eqnarray}$
so that ${{\boldsymbol{v}}}_{\eta }({\boldsymbol{k}})={\overrightarrow{{\rm{\nabla }}}}_{{\boldsymbol{k}}}\,{E}_{\eta }({\boldsymbol{k}})$ denotes the group velocity of electrons in each energy spectrum. The Kubo formula gives the transport coefficient ${{ \mathcal L }}_{11}$ in terms of a correlation function of electrical current operators [41] $\begin{eqnarray}\begin{array}{rcl}{{ \mathcal L }}_{11} & = & \mathop{\mathrm{lim}}\limits_{\omega \longrightarrow 0}\frac{{k}_{{\rm{B}}}T}{\omega }\mathrm{Im}\left({\rm{i}}{\displaystyle \int }_{-\infty }^{+\infty }{\rm{d}}t{{\rm{e}}}^{{\rm{i}}\omega t}\theta (t)\langle [{J}_{e}^{x}(t),{J}_{e}^{x}(0)]\rangle \right)\\ & = & \mathop{\mathrm{lim}}\limits_{\omega \longrightarrow 0}\frac{{k}_{{\rm{B}}}T}{\omega }\mathrm{Im}\\ & & \times \left(\mathop{\mathrm{lim}}\limits_{{\rm{i}}{\omega }_{n}\longrightarrow \omega +{\rm{i}}{0}^{+}}{\displaystyle \int }_{0}^{1/{k}_{{\rm{B}}}T}{\rm{d}}\tau {{\rm{e}}}^{{\rm{i}}{\omega }_{n}\tau }\langle {T}_{\tau }({J}_{e}^{x}(\tau ){J}_{e}^{x}(0))\rangle \right),\end{array}\end{eqnarray}$
where it is assumed that electrical current flows along x direction according to figure 1. Also ωn = 2nπkBT denotes the bosonic Matsubara frequency and T refers to the equilibrium temperature. Applying the Wick’s theorem leads to the following expression for the electrical current-current correlation function as $\begin{eqnarray}\langle {T}_{\tau }({J}_{e}^{x}(\tau ){J}_{e}^{x}(0))\rangle =\displaystyle \sum _{{\boldsymbol{k}},\eta }{({v}_{\eta }^{x}({\boldsymbol{k}}))}^{2}{G}_{\eta \eta }({\boldsymbol{k}},\tau ){G}_{\eta \eta }({\boldsymbol{k}},-\tau ).\end{eqnarray}$
By substituting equation ( $\begin{eqnarray}\begin{array}{rcl}{{ \mathcal L }}_{11} & = & \mathop{\mathrm{lim}}\limits_{\omega \longrightarrow 0}\frac{{k}_{{\rm{B}}}T}{\omega }\mathrm{Im}\\ & & \times \left(\mathop{\mathrm{lim}}\limits_{{\rm{i}}{\omega }_{n}\longrightarrow \omega +{\rm{i}}{0}^{+}}{\displaystyle \int }_{0}^{1/{k}_{{\rm{B}}}T}{\rm{d}}\tau {{\rm{e}}}^{{\rm{i}}{\omega }_{n}\tau }\langle {T}_{\tau }({J}_{E}^{x}(\tau ){J}_{E}^{x}(0))\rangle \right)\\ & = & \mathop{\mathrm{lim}}\limits_{\omega \longrightarrow 0}\frac{{k}_{{\rm{B}}}T}{\omega }\mathrm{Im}\\ & & \times \left(\mathop{\mathrm{lim}}\limits_{{\rm{i}}{\omega }_{n}\longrightarrow \omega +{\rm{i}}{0}^{+}}\displaystyle \sum _{{\boldsymbol{k}},\eta ,m}{({v}_{\eta }^{x}({\boldsymbol{k}}))}^{2}{G}_{\eta \eta }({\boldsymbol{k}},{\rm{i}}{\omega }_{m}){G}_{\eta \eta }({\boldsymbol{k}},{\rm{i}}{\omega }_{n}+{\rm{i}}{\omega }_{m})\right).\end{array}\end{eqnarray}$
According to the Lehmann representation [41], the imaginary part of retarded Green’s function and Matsubara form of Green’s function are related to each other as $\begin{eqnarray}{G}_{\eta \eta }({\boldsymbol{k}},{\rm{i}}{\omega }_{m})={\int }_{-\infty }^{+\infty }\frac{{\rm{d}}\epsilon }{2\pi }\frac{-2\mathrm{Im}\left({G}_{\eta \eta }^{\sigma }({\boldsymbol{k}},\epsilon +{\rm{i}}{0}^{+})\right)}{{\rm{i}}{\omega }_{m}-\epsilon }.\end{eqnarray}$
Using Lehmann representation and after summation over Matsubara’s fermionic frequency ωm = (2m + 1)πkBT, the final result form for static transport coefficient ${{ \mathcal L }}_{11}$ of kagome structure along x direction as $\begin{eqnarray}{{ \mathcal L }}_{11}=\frac{2{e}^{2}{k}_{{\rm{B}}}T}{3N}\displaystyle \sum _{{\boldsymbol{k}},\eta }{\left(\frac{{\rm{d}}{E}_{\eta }({\boldsymbol{k}})}{{\rm{d}}{k}_{x}}\right)}^{2}{\int }_{-\infty }^{\infty }\frac{{\rm{d}}\epsilon }{2\pi }\frac{-{\rm{d}}{n}_{F}(\epsilon )}{{\rm{d}}\epsilon }{\left({{ \mathcal A }}_{\eta }({\boldsymbol{k}},\epsilon )\right)}^{2},\end{eqnarray}$
where ${n}_{F}(x)=\frac{1}{{{\rm{e}}}^{x/{k}_{{\rm{B}}}T}+1}$ denotes the Fermi–Dirac distribution function. Moreover the spectral function ${{ \mathcal A }}_{\eta }$ is given by ${{ \mathcal A }}_{\eta }({\boldsymbol{k}},\epsilon )\equiv -2\mathrm{Im}{G}_{\eta \eta }({\boldsymbol{k}},{\rm{i}}{\omega }_{n}\longrightarrow \epsilon +{\rm{i}}{0}^{+})$. In a similar way, we can derive the other transport coefficients ${{ \mathcal L }}_{12}$ and ${{ \mathcal L }}_{22}$ by calculating the correction functions between electrical current and thermal current. The final results for these transport coefficients are given by $\begin{eqnarray}\begin{array}{rcl}{{ \mathcal L }}_{12} & = & \frac{2e{k}_{{\rm{B}}}T}{3N}\displaystyle \sum _{{\boldsymbol{k}},\eta }{\left(\frac{{\rm{d}}{E}_{\eta }({\boldsymbol{k}})}{{\rm{d}}{k}_{x}}\right)}^{2}{\displaystyle \int }_{-\infty }^{\infty }\frac{{\rm{d}}\epsilon }{2\pi }\epsilon \frac{-{\rm{d}}{n}_{F}(\epsilon )}{{\rm{d}}\epsilon }\\ & & \times {\left({{ \mathcal A }}_{\eta }({\boldsymbol{k}},\epsilon )\right)}^{2},\\ {{ \mathcal L }}_{22} & = & \frac{2e{k}_{{\rm{B}}}T}{3N}\displaystyle \sum _{{\boldsymbol{k}},\eta }{\left(\frac{{\rm{d}}{E}_{\eta }({\boldsymbol{k}})}{{\rm{d}}{k}_{x}}\right)}^{2}{\displaystyle \int }_{-\infty }^{\infty }\frac{{\rm{d}}\epsilon }{2\pi }{\epsilon }^{2}\frac{-{\rm{d}}{n}_{F}(\epsilon )}{{\rm{d}}\epsilon }\\ & & \times {\left({{ \mathcal A }}_{\eta }({\boldsymbol{k}},\epsilon )\right)}^{2}.\end{array}\end{eqnarray}$
Using band index electronic Green’s function presented in equation (The static electrical conductivity along x direction for kagome lattice in the presence of spin–orbit coupling and impurity atoms is related to the transport coefficient ${{ \mathcal L }}_{11}$ as [41]
$\begin{eqnarray}\sigma (T)=\frac{1}{T}{{ \mathcal L }}_{11}.\end{eqnarray}$
Under open circuit situation, i.e. Je = 0, heat current is the response to the temperature gradient and we have JQ = κ∇T where κ is the thermal conductivity. Such parameter is obtained using transport coefficients as [45] $\begin{eqnarray}\kappa =\frac{1}{{T}^{2}}\left({{ \mathcal L }}_{22}-\frac{{{ \mathcal L }}_{12}^{2}}{{{ \mathcal L }}_{11}}\right).\end{eqnarray}$
In the following, we have focused on thermoelectric properties of the structure. The ratio of the measured voltage to the temperature gradient applied across the sample is known as the Seebeck coefficient (or the thermopower) and is given by S = ∇V/∇T, where ∇V is the potential difference between two points of the sample [45]. In linear response approximation the Seebeck coefficient is related to transport coefficients as $\begin{eqnarray}S=-\frac{1}{T}\frac{{{ \mathcal L }}_{12}}{{{ \mathcal L }}_{11}}.\end{eqnarray}$
S denotes the thermopower which describe the voltage generation owing to the temperature gradient. The sign of S determines the sign of majority carriers of thermal transport in the kagome lattice. The other thermoelectric parameter, i.e. Figure of merit ZT can be expressed based on transport coefficients as [41] $\begin{eqnarray}ZT=\frac{\sigma {S}^{2}}{K}T.\end{eqnarray}$
Based on the above equation, the small thermal conductivity and relatively high thermopower and electrical conductivity are required for high efficiency thermoelectric materials. Moreover transport coefficients can be utilized to find the other thermoelectric properties such as power factor (PF) and Lorenz number (L). Such parameters are expressed in terms of transport coefficients as following relations [46] $\begin{eqnarray}PF=\frac{{{ \mathcal L }}_{12}^{2}}{{T}^{2}{{ \mathcal L }}_{11}},\ \ L=\frac{{{ \mathcal L }}_{11}{{ \mathcal L }}_{22}-{{ \mathcal L }}_{12}^{2}}{{T}^{2}{{ \mathcal L }}_{12}^{2}}.\end{eqnarray}$
We would like to add a few comments about the derivation of Green’s function formalism, particularly the transformation from the atomic to the band basis and its connection to transport coefficients. Below, we outline how we will address this issue: Clarifying the Transformation from Atomic to Band Basis (equation (18 )): In our formulation, Green’s function is first expressed in the atomic (sublattice) basis, where the impurity self-energy is initially calculated within the SCBA.
The transformation to the band basis is performed using the eigenvectors of the clean Hamiltonian matrix ${{ \mathcal H }}_{{\boldsymbol{k}}}$, which diagonalizes the system. Specifically, the unitary transformation matrix ${{ \mathcal F }}_{\eta \alpha }({\boldsymbol{k}})$ relates the atomic basis operators ${c}_{{\boldsymbol{k}},\alpha }^{\sigma \dagger }$ to the band basis operators ${{ \mathcal C }}_{\eta ,{\boldsymbol{k}}}^{\sigma \dagger }$ leading to the expression for Σηη in equation (20 ). This transformation ensures that the self-energy in the band representation retains the influence of disorder while maintaining the fundamental electronic structure of the kagome lattice. Using unitary transformation in equation (18 ) for creation operators in band and atomic basis, we can find the expansion of Gηη in terms of Gαβ. We can use such expansion for Σηη in terms of Σαβ.
In the next section, the numerical results of electronic and thermoelectric properties of disordered kagome structure due to effects of spin–orbit coupling are presented.
4. Numerical results and discussion
In this section our numerical results for density of states, thermoelectric and transport properties of two-dimensional kagome lattice in the presence of impurity doping and spin–orbit coupling effects are presented. We investigate the electronic density of states, the electrical conductivity, thermal conductivity, Seebeck coefficient and its corresponding figure of merit ZT. Also we have addressed power factor of this structure due to impurity doping effects. It should be noted that, we set chemical potential μ = 0 in all calculated quantities so that we have considered the half filling case for kagome lattice. For finding Green’s function of electrons in the presence of impurity doping effects, we should find the electronic self-energy matrix elements Σαα(E) due to scattering of electrons from impurity atoms. For this purpose, the electronic self-energy of the disordered system in atomic basis Hilbert space is calculated within a self-consistent solution of equation (12 ). Then we can find the electronic self-energy in band index Hilbert space by using equation (20 ). The final results for self-energy matrix elements have been employed to obtain electronic Green’s function of disordered kagome lattice based on equation (21 ). The density of states numerical results of kagome lattice in the presence of spin–orbit coupling and impurity atoms is calculated by equation (22 ).
On the other hand, we can find diagonal matrix elements of electronic self energy in band index Hilbert space, using equation (20 ). The electronic Green’s function in band index Hilbert space is readily obtained by equation (21 ). Afterwards transport coefficients are found by substitution of Green’s function into relations in equation (30 ). The static electrical conductivity, thermal conductivity, Seebeck coefficient, power factor and Lorenz number readily calculated based on equations (32 ), (33 ), (34 ), (35 ), (36 ), respectively. Both inter and intra band transitions contribute to the results of electronic properties of disordered kagome structure. It should be noted that the transport properties of kagome has have been studied along x direction according to figure 1.
The total density of states (DOS(E)) of kagome layer in the presence of impurity atoms for different values of impurity concentration n has been shown in figure 2. Spin-orbit coupling and scattering potential strengths have been assumed to be λ = 0.03 eV and v = 0.3 eV, respectively. The relative shape of density of states changes due to impurity doping. The model Hamiltonian in equation (2 ) loses its particle-hole symmetry thus the density of states curves has no symmetry with respect to E = 1 eV. It is well known that the total number of available states corresponds to area below the density of states curve versus energy and it is proportional to the concentration of electrons in the system. Since the number of electrons in the system does not change in the presence of impurity atoms, the area under the curve of density of states remains constant due to the variation of impurity concentration. Also the density of states of value at zero energy, i.e. chemical potential value, decreases with impurity concentration according to figure 2. This fact implies that impurity concentration improves the non metallic behavior of the kagome lattice.
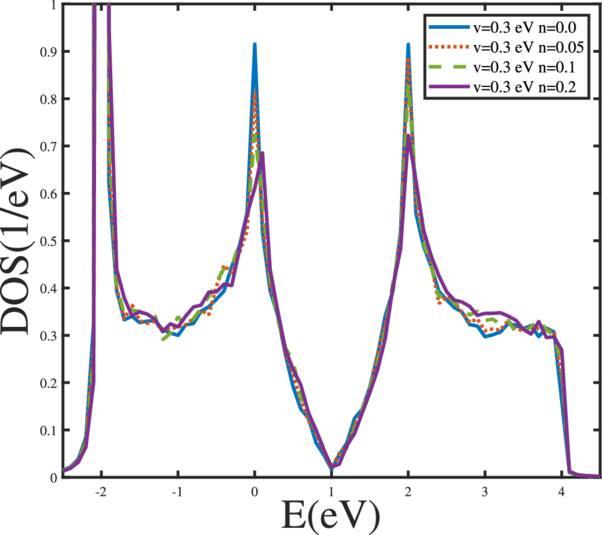
Figure 2. The electronic density of states of disordered kagome structure for different values of impurity concentration at fixed scattering potential strength v = 0.3 eV. |
We have plotted the energy dependence of density of states DOS(E) for different values of scattering potential strength v at fixed impurity concentration n = 0.02 with spin–orbit coupling strength λ = 0.03 eV in figure 3. The model Hamiltonian in equation (2 ) loses its particle-hole symmetry thus the density of states curves has no symmetry with respect to E = 1 eV. Since the number of electrons of the system does not suffer from change in the presence of impurity atoms, the area under the curve of density of states is preserved under variation of scattering potential strength. Moreover, the height of peak at zero energy, i.e. chemical potential value, reduces with increase of scattering potential strength according to figure 3. This fact implies that scattering potential strength improves the non metallic behavior of kagome lattice.
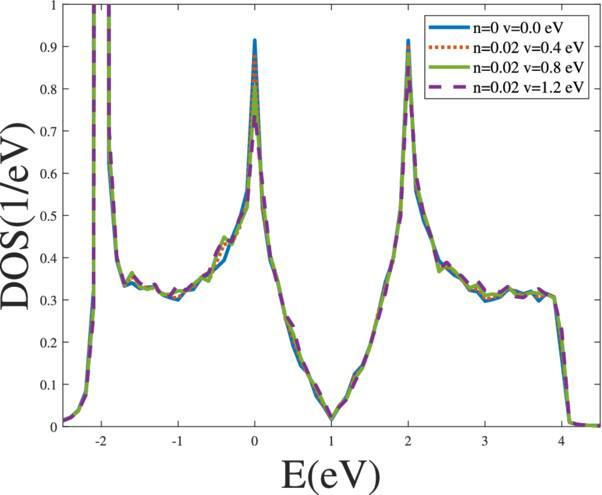
Figure 3. The electronic density of states of disordered kagome structure for different values of scattering potential strength at fixed impurity concentration n = 0.02. |
We would like to add a few comments regarding a more detailed physical interpretation of the density of states (DOS) results, particularly regarding the suppression of the DOS at the chemical potential and its relation to spin–orbit coupling (SOC) and impurity-induced states.
Physical Interpretation of DOS Suppression
1. Interplay of SOC and Disorder on DOS Features: - In a clean kagome lattice with SOC, the intrinsic SOC term opens a topological gap at the Dirac points in the electronic band structure. This effect is analogous to the Kane–Mele model for graphene, where SOC lifts degeneracies and induces a bandgap.
- When a disorder (impurity scattering) is introduced, two competing effects arise:
- Impurity-induced states: Disorder broadens the energy bands and introduces localized states, which can lead to spectral weight redistribution. - Suppression of states near the chemical potential: In the SCBA, impurity scattering leads to a self-energy correction that modifies the quasiparticle lifetime and reduces the DOS at certain energy regions, similar to what is observed in disordered Dirac and Weyl systems.
2. Comparison with Disordered Dirac/Weyl Systems: - The suppression of DOS at the chemical potential in figure 2 is reminiscent of similar phenomena observed in disordered graphene and Weyl semimetals. For example: - In graphene, short-range disorder (such as vacancies or random impurities) leads to spectral weight redistribution and a pseudogap formation in the DOS, as discussed in Peres et al [27] and Wehling et al [47].
- In pyrochlore iridates (topological Weyl semimetals with SOC), disorder-induced modifications to the DOS and quasiparticle lifetimes have been studied extensively [3]. These works show that disorder can suppress the DOS at the Fermi level due to enhanced scattering effects, leading to transport signatures of a crossover from a metallic to an insulating regime
3. Impurity Concentration versus Bandgap Modification: - As seen in figure 2, increasing impurity concentration reduces the DOS at the chemical potential, suggesting enhanced localization effects. This is consistent with theoretical studies on Anderson localization in two-dimensional systems, where increasing disorder strength gradually suppresses extended states near the Fermi level. - However, our results show that impurity scattering does not completely close the SOC-induced bandgap. Instead, it modifies the spectral weight distribution, which suggests that kagome lattices remain in a non-trivial electronic phase even in the presence of moderate disorder.
figures 2, 3 illustrate the energy dependence of the DOS for the disordered kagome lattice in the presence of SOC and impurity scattering. A key observation is the suppression of the DOS at the chemical potential with increasing impurity concentration, suggesting a transition toward non-metallic behavior. In the clean kagome lattice, the intrinsic SOC term lifts the degeneracy at the Dirac points, opening a bandgap similar to the Kane–Mele model in graphene. This topological gap prevents electronic states from existing at the Fermi level, leading to a semiconducting behavior in the absence of disorder. However, when disorder is introduced through randomly distributed impurity atoms. The introduction of impurity scattering broadens the energy bands, redistributing spectral weight within the electronic structure. Disorder modifies the local density of states (LDOS), potentially introducing mid-gap states that arise from localized impurity orbitals interacting with the kagome electronic bands. Within the SCBA, impurity scattering contributes to a finite quasiparticle self-energy, which alters the electronic lifetime. The suppression of the DOS at the chemical potential, particularly evident in figure 2, suggests that disorder-induced scattering increases electron localization, reducing the availability of extended states for conduction. This behavior is analogous to what has been observed in disordered Dirac materials, such as graphene and pyrochlore iridates, where disorder-induced scattering can lead to spectral weight depletion at the Fermi level, signaling a transition toward a more insulating regime [27, 47]. In monolayer graphene, short-range disorder leads to a renormalization of the DOS, often resulting in a pseudogap due to Anderson localization effects. Similar mechanisms may be at play in the kagome lattice, given its Dirac-like band structure near the Fermi energy. In topological Weyl systems with SOC, impurity scattering induces a self-energy correction that modifies the band structure, leading to disorder-driven suppression of the DOS at low energies [3]. Our results suggest that similar mechanisms contribute to the observed DOS behavior in the kagome lattice. From figure 2, we observe that as impurity concentration increases, the DOS at the chemical potential decreases, reinforcing the idea that disorder enhances electron localization. However, the bandgap induced by SOC is not completely closed by impurity scattering, indicating that kagome lattices retain non-trivial electronic properties even under moderate disorder. The fact that the DOS does not exhibit a metallic-like increase at the chemical potential suggests that the system is not undergoing a simple band-filling effect but instead a disorder-driven transition toward a more localized state.
The temperature dependence of static electrical conductivity, σ(T) of kagome lattice for different amounts of impurity concentration at fixed scattering potential strength v = 0.4 eV is shown in figure 4. The electrical conductivity of kagome lattice increases in temperature region kBT > 0.05 eV for each value of impurity concentration. The increasing behavior of electrical conductivity with temperature in this temperature region comes from the enhancement of electronic transition rate with temperature. In addition, at fixed temperatures in temperatures region kBT < 0.2 eV, electrical conductivity of disordered kagome lattice increases with impurity concentration. It can be understood that higher impurity concentration at low temperature causes more transition rate of electrons from valence band to conduction one. On the other hand, lower thermal fluctuations at low temperature cause less scattering rate of electrons from impurity atoms. Therefore electrical conductivity rises with increase of ni at low temperatures as shown in figure 4. Such results are in agreement with another theoretical work where electrical conductivity of disordered nanotubes increases with impurity concentration at low temperatures [48]. A decreasing behavior for temperature dependence of electrical conductivity is clearly observed at temperatures kBT < 0.05 eV for all impurity concentrations.
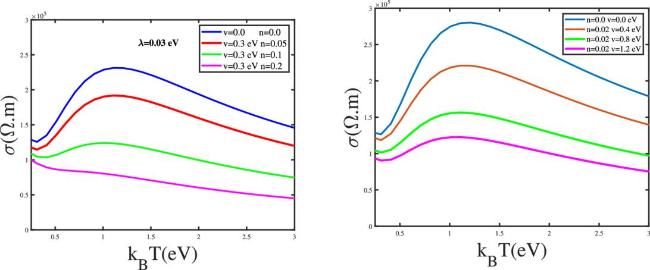
Figure 4. Left panel: Electrical conductivity of disordered kagome lattice as a function of temperature kBT for different values of impurity concentration, namely n = 0.0, 0.05 eV, 0.1, 0.2, at fixed scattering potential strength v = 0.3 eV. Spin-orbit coupling strength is assumed to be λ = 0.03 eV. Right panel: Electrical conductivity of disordered kagome lattice as a function of temperature kBT for different values of scattering potential strength at fixed impurity concentration n = 0.02. Spin-orbit coupling strength is assumed to be λ = 0.03 eV. |
The temperature dependence of electrical conductivity of disordered kagome lattice for different impurity concentrations is observed in the left panel of figure 4. Scattering potential strength has been fixed at v = 0.3 eV. Also the spin–orbit coupling strength is assumed to be λ = 0.03 eV. Electrical conductivity curves for impurity concentrations n = 0.0, 0.05, 0.1 include a peak at characteristic temperature kBT ≈ 1.2 eV. Such peak is not observed for impurity concentration n = 0.2 eV according to the left panel of figure 4. For temperatures below characteristic temperature 1.2 eV, the enhancement of temperature leads to increase the transition rate of electrons to the excited state. Therefore we see an increase of the electrical conductivity at low temperatures. Moreover, electrical conductivity reduces with temperature at temperature region kBT > 1.2 eV for each impurity concentration n = 0.0, 0.05, 0.1. This arises from this point that scattering rate between electrons and impurity atoms increases with temperature above kBT > 1.2 eV and thus conductivity reduces with temperature at kBT > 1.2 eV. At fixed temperature, it is clearly observed that electrical conductivity decreases with impurity concentration as shown in figure 4. It can be understood from this fact that increase of impurity concentration at temperatures above 0.15 eV leads to enhance the scattering rate of electrons of the system from impurity atoms and consequently electrical conductivity reduces with n according to the left panel of figure 4.
The effects of scattering potential strength on temperature dependence of electrical conductivity of kagome lattice have been studied in the right panel of figure 4. In this panel, impurity concentration is assumed to be n = 0.02 and spin–orbit coupling constant is fixed at λ = 0.03 eV. Each curve in the right panel of figure 4 includes a peak at temperature position kBT ≈ 1.0 eV. The height of peak reduces with scattering potential strength v. For temperatures below peak position, electrical conductivity shows an increasing behavior in terms of temperature for each value of v. This arises from the point that enhancement of temperature leads to increase the transition rate of electrons to the excited state. Also electrical conductivity decreases with temperature at temperatures above peak position for each value of v = 0.0, 0.4, 0.8, 1.2 eV. This arises from the point that scattering rate between electrons and impurity atoms increases with temperature above 1.0 eV and thus conductivity reduces with temperature at kBT > 1.0 eV. On the other hand, electrical conductivity decreases with scattering potential strength at fixed temperature according to the right panel of figure 4. It can be understood from this fact that increase of scattering potential strength at temperatures above 1.0 eV leads to enhance the scattering rate of electrons of the system from impurity atoms and consequently electrical conductivity reduces with v. Some comments are suitable regarding the non-monotonic temperature dependence of the electrical conductivity in figure 4. The interplay between the enhanced electronic transition rate and impurity-induced scattering rate requires a more quantitative analysis. Below, we outline our response and propose a revision to our manuscript. figure 4 shows the temperature dependence of the electrical conductivity, exhibiting a non-monotonic behavior with an initial decrease at low temperatures, an increase in the intermediate temperature range, and a subsequent decline at high temperatures. This behavior arises from the competition between thermally activated carriers and scattering mechanisms, which can be quantitatively analyzed using the relaxation time approximation and Drude weight formalism. At low temperatures (kBT < 0.05 eV), the electrical conductivity decreases due to impurity-dominated scattering. Since impurity scattering is elastic and does not contribute to energy relaxation, the relaxation time remains finite and temperature-independent (τimp ∼ n−1). However, the number of thermally excited carriers is low, leading to a reduced density of available conduction states, which suppresses conductivity. As temperature increases (0.05 eV <kBT < 1.2 eV), thermally activated carriers become the dominant factor. The derivative of the Fermi–Dirac distribution, $-\partial f(E)/\partial E\approx {{\rm{e}}}^{-E/{k}_{{\rm{B}}}T}$ enhances carrier transitions, increasing the number of available conduction states. This behavior is consistent with thermally activated transport in Dirac and topological systems, where an increase in thermal energy facilitates electron-hole pair generation, leading to an enhancement of conductivity. At high temperatures (kBT > 1.2 eV), phonon and impurity scattering become dominant, reducing the relaxation time and thereby suppressing conductivity. The electron-phonon relaxation time follows a power-law dependence, τph(T) ∝ T−p with p ≈ 1, 2, which leads to increased electron scattering and a subsequent reduction in conductivity. This behavior is in agreement with disorder-driven transport models in topological kagome and Dirac materials. In this present study, we have not investigated the optical absorption rate of electromagnetic wave in the medium. Thus analysis of Drude weight parameter is mainly far from the scope of the topic of this manuscript. However, it is a good idea that we address Drude weight in the future work via concentrating on the optical properties of the kagome lattice. The present study is along static transport properties of kagome lattice and such study does not include the investigation of Drude weight parameter of this lattice structure.
Considering magnetothermal effects using equation (24 ), the Seebeck coefficient S is obtained under the condition of zero electrical current Je = 0 and for ballistic transport. In left panel of figure 5, we have depicted the Seebeck coefficient S of disordered kagome lattice has been plotted as a function of temperature kBT for several values of impurity concentration n at fixed scattering potential strength v = 0.03 eV. Also the spin–orbit coupling strength is assumed to be λ = 0.03 eV. We note that Seebeck coefficient curves of kagome structure in the presence of finite impurity concentration include peaks so that the positions of these peaks tend to lower temperatures with increase of impurity concentration n. The height of the peak in Seebeck coefficient decreases with n according to left panel of figure 5. The sign of S on the whole range of temperature for impurity concentrations n = 0.0, 0.05, 0.1 is positive. In ([49]), it was suggested that the sign of S is a criterion to clarify the types of majority carriers; a positive (negative) S implies that the charge and heat are dominantly carried by electrons (holes). Moreover, the Seebeck coefficient gets positive sign in temperature region kBT < 0.75 for impurity concentration n = 0.2 as shown in left panel of figure 5. Seebeck coefficient gets the negative sign in temperature region kBT > 0.75 for impurity concentration n = 0.2 so that the charge and heat are dominantly carried by holes. In addition, at fixed temperature above 0.25 eV, Seebeck coefficient of disordered kagome lattice reduces with scattering potential strength. The Seebeck coefficient (S) and power factor (PF) are key thermoelectric parameters that depend on the electronic structure, disorder effects, and SOC strength. In our study, we observe nontrivial temperature and impurity-dependent behavior in these quantities, which we analyze in more depth below.
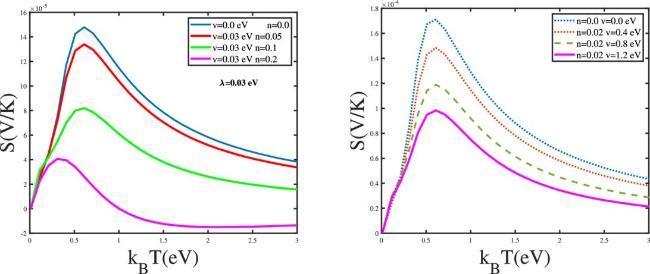
Figure 5. Left panel: Seebeck coefficient of disordered kagome lattice as a function of temperature kBT for different values of impurity concentration, namely n = 0.0, 0.05 eV, 0.1, 0.2, at fixed scattering potential strength v = 0.3 eV. Spin-orbit coupling strength is assumed to be λ = 0.03 eV. Right panel: Seebeck coefficient of disordered kagome lattice as a function of temperature kBT for different values of scattering potential strength at fixed impurity concentration n = 0.02. Spin-orbit coupling strength is assumed to be λ = 0.03 eV. |
1. Sign of the Seebeck Coefficient: Electron versus Hole Transport The sign of S determines whether electrons or holes dominate transport: Positive S indicates hole-dominated conduction (valence band contribution). Negative S indicates electron-dominated conduction (conduction band contribution). Our numerical results show that: At low impurity concentrations (n < 0.1), the Seebeck coefficient is positive across all temperatures, indicating hole-like carriers dominate transport. As impurity concentration increases, a sign change occurs at higher temperatures (kBT > 0.75 eV), indicating a transition to electron-dominated transport. This behavior arises from impurity-induced spectral weight redistribution, which shifts the effective Fermi level, allowing electron states to contribute to transport at elevated temperatures. Similar sign-reversal behavior has been observed in disordered graphene and topological kagome lattices, where vacancy states or impurity scattering shift the carrier balance between conduction and valence bands.
2. Dependence of Seebeck Coefficient on Spin-Orbit Coupling SOC affects the Seebeck coefficient in two significant ways: 1. Modifying the Bandgap: The intrinsic SOC term opens a gap at the Dirac points, reducing the number of available low-energy states. A larger bandgap enhances the thermopower because carriers require more energy to be thermally excited. This effect is captured in the Mott relation: $S\approx -{\pi }^{2}{k}_{{\rm{B}}}^{2}T/3{\left({\mathrm{ln}}\,D(E)/{\rm{d}}E\right)}_{{E}_{{\rm{F}}}}$ As SOC increases, the density of states (DOS) slope near Fermi energy EF changes, which alters sign of Seebeck coefficient. 2. Impact on Carrier Scattering: SOC modifies the group velocity and scattering rates, which influence charge carrier mobility. Our results show that increasing SOC enhances ∣S∣ at low temperatures, suggesting that spin-orbit interactions stabilize the asymmetry in carrier distribution. Previous studies on kagome materials with SOC indicate that strong spin-orbit interactions can improve thermoelectric performance by optimizing the balance between electrical conductivity and thermopower [3].
The effects of scattering potential strength v on the temperature dependence of Seebeck coefficient of kagome lattice at fixed spin–orbit coupling strength λ = 0.03 eV have been plotted in the right panel of figure 5. impurity concentration has been assumed to be n = 0.02. This panel indicates that Seebeck coefficient curves of kagome structure include peaks so that the positions of these peaks are not affected by the variation of v. Although the height of peaks decreases with scattering potential strength v. The sign of S on the whole range of temperature for various scattering potential strength v = 0.0, 0.4, 0.8, 1.2 is positive. This implies that charge and heat are dominantly carried by electrons for various scattering potential strengths at fixed impurity concentration n = 0.02.
The numerical results of temperature behavior of thermal conductivity of disordered kagome lattice for different values of impurity concentration at fixed scattering potential strength v = 0.3 eV are given in left panel of figure 6. Each curve shows an increasing behavior in temperature region kBT < 0.75 eV. For temperatures below 0.75 eV, the enhancement of temperature leads to increase the transition rate of electrons to the excited state. Therefore we see an increase of the thermal conductivity in temperature region kBT < 0.75 eV for each value of impurity concentration. Moreover, thermal conductivity reduces with increase of impurity concentration at fixed temperature above 0.15 eV. It can be understood from this fact that increase of impurity concentration at temperatures above 0.15 eV leads to enhance the scattering rate of electrons of the system from impurity atoms and consequently thermal conductivity reduces with n according to the left panel of figure 6. For temperatures above 0.75 eV, thermal fluctuations leads to increase the scattering rate between electrons and impurity atoms which implies the decreasing behavior for thermal conductivity at kBT > 0.75 eV. Each curve of thermal conductivity in the left panel of figure 6 includes a peak at characteristic temperature kBT ≈ 0.75 eV. The height of peaks decreases with impurity concentration as shown in the left panel of figure 6.
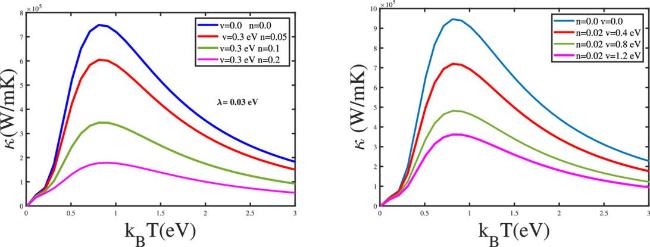
Figure 6. Left panel: Thermal conductivity of disordered kagome lattice as a function of temperature kBT for different values of impurity concentration, namely n = 0.0, 0.05 eV, 0.1, 0.2, at fixed scattering potential strength v = 0.3 eV. Spin-orbit coupling strength is assumed to be λ = 0.03 eV. Right panel: Thermal conductivity of disordered kagome lattice as a function of temperature kBT for different values of scattering potential strength at fixed impurity concentration n = 0.02. Spin-orbit coupling strength is assumed to be λ = 0.03 eV. |
Investigation of the Lorenz number L is an important parameter for determining the thermoelectric efficiency of materials. This parameter is defined as the ratio of thermal to electrical conductivities , i.e. $L=\frac{1}{T}\frac{K}{\sigma }$. Enhancing the Lorenz number involves simultaneously increasing electrical conductivity and decreasing thermal conductivity. This feature can be achieved by engineering materials with a high density of charge carriers and a low lattice thermal conductivity. Left panel of figure 7 shows the Lorenz number L(T) of disordered kagome lattice as a function of temperature for different values of impurity concentration at fixed scattering potential strength v = 0.3 eV. A peak in Lorenz number curve is clearly observed for each value of impurity concentration so that the temperature position of the peak is around kBT ≈ 0.6 eV for each value of n. Also the height of peak decreases with impurity concentration as shown in left panel of figure 7. In addition, at fixed temperature above 0.2 eV, the reduction of n raises the Lorenz number value. In temperature regions kBT > 2.0 eV and kBT < 0.2 eV, the increase of impurity concentration has no effect on Lorenz number values so that the curves fall on each other in these temperature regions.
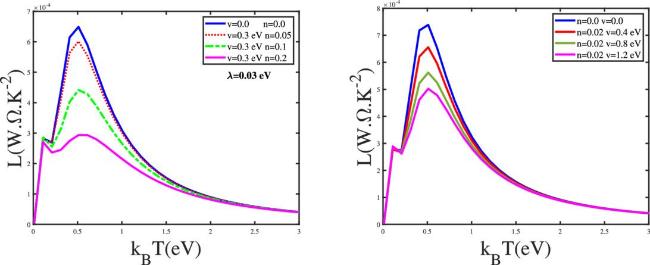
Figure 7. Left panel: Lorenz number of disordered kagome lattice as a function of temperature kBT for different values of impurity concentration, namely n = 0.0, 0.05 eV, 0.1, 0.2, at fixed scattering potential strength v = 0.3 eV. Spin-orbit coupling strength is assumed to be λ = 0.03 eV. Right panel: Lorenz number of disordered kagome lattice as a function of temperature kBT for different values of scattering potential strength at fixed impurity concentration n = 0.02. Spin-orbit coupling strength is assumed to be λ = 0.03 eV. |
In the right panel of figure 7, we have depicted the temperature dependence of Lorenz number of disordered kagome lattice for different values of scattering potential strength v at fixed impurity concentration n = 0.02. There is a peak in Lorenz number curve for each value of v at temperature around 0.6 eV so that the height of peak reduces with scattering potential strength according to the right panel of figure 7. Also the height of peak decreases with scattering potential strength as shown in left panel of figure 7. In addition, at fixed temperature in the region 0.2 eV <kBT < 2.0 eV, the reduction of v enhances the Lorenz number value. In temperature regions kBT > 2.0 eV and kBT < 0.2 eV, the increase of scattering potential strength has no effect on Lorenz number values so that the curves fall on each other in these temperature regions. figure 8 presents the behaviors of power factor of the kagome lattice in terms of temperature kBT for different values of impurity concentration at fixed scattering potential strength v = 0.3 eV. Spin-orbit coupling strength has been fixed at λ = 0.03 eV. All curves in this figure get a peak so that its temperature position moves to lower temperature with increase of impurity concentration. On the other hand, the height of peak in temperature dependence of power factor with enhancement of impurity concentration as shown in figure 8. Another novel feature in figure 8 is the zero values for power factor in temperature region kBT > 0.75 eV. In addition, at fixed temperature above 0.25 eV, power factor decreases with impurity concentration.
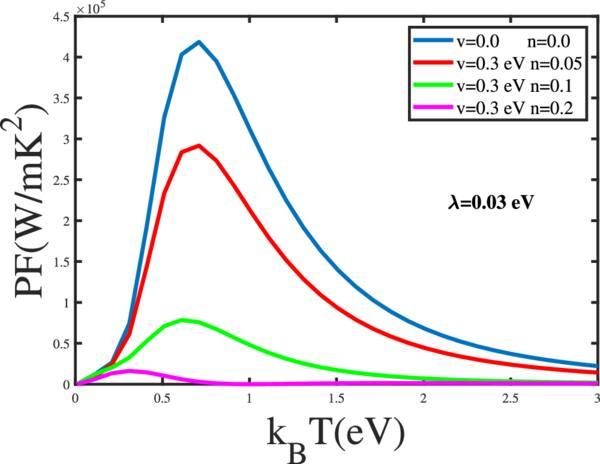
Figure 8. Power factor of disordered kagome lattice as a function of temperature kBT for different values of impurity concentration at fixed scattering potential strength v = 0.3. Spin-orbit coupling strength is assumed to be λ = 0.03 eV. |
In the left panel of figure 9, the behavior of figure of merit of kagome lattice has been depicted versus temperature for different values of impurity concentration due to scattering potential strength v = 0.3 eV. The figure of merit is the measure of efficiency of system in thermoelectric properties. We note that each figure of merit curves of kagome lattice includes so that the temperature position of this peak moves to lower values with impurity concentration n. On the other hand, the height of the peak decreases with n according to the left panel of figure 9. There is a temperature region around temperature kBT = 1.0 eV where ZT gets the zero value for n = 0.2.
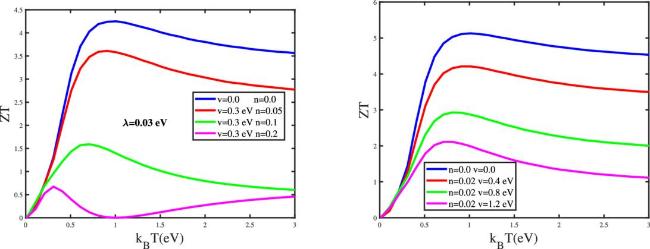
Figure 9. Left panel: figure of merit, ZT, of disordered kagome lattice as a function of temperature kBT for different values of impurity concentration, namely n = 0.0, 0.05 eV, 0.1, 0.2, at fixed scattering potential strength v = 0.3 eV. Spin-orbit coupling strength is assumed to be λ = 0.03 eV. Right panel: figure of merit, ZT, of disordered kagome lattice as a function of temperature kBT for different values of scattering potential strength at fixed impurity concentration n = 0.02. Spin-orbit coupling strength is assumed to be λ = 0.03 eV. |
The temperature dependence of figure of merit, ZT, of disordered kagome lattice for different values of scattering potential strength v at n = 0.02 has been plotted in right panel of figure 9. This figure implies that there is a peak in temperature dependence of ZT so that the height of this peak reduces with increase of v. Also the peak appears at temperature kBT = 0.75 eV for scattering potential strength v = 0.0 eV, 0.4 eV, 0.8 eV, 1.2 eV as shown in right panel of figure 9. The temperature position of peak in ZT of kagome lattice for all values of scattering potential strength is around kBT ≈ 0.75 eV which is independent of the value of the right panel of figure 9. Moreover, figure of merit decreases with scattering potential strength at fixed temperature above 0.25 eV.
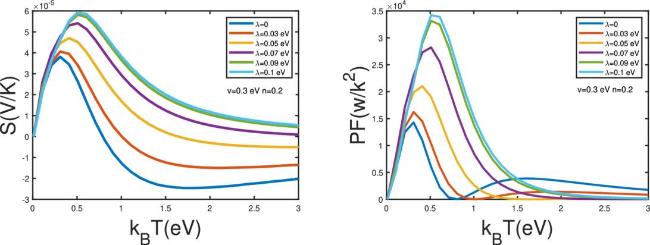
We have also studied the effects of spin–orbit coupling strength on temperature dependence of some of the thermoelectric properties of disordered kagome lattice. Specially, we have plotted the temperature dependence of Seebeck coefficient and power factor of disordered kagome lattice for different values of spin–orbit coupling strength λ at fixed n = 0.2 and v = 0.3 eV in right and left panels of figure 10, respectively. These panels imply that Seebeck coefficient and power factor curves include a peak in their temperature dependences so that the temperature position of peak tends to higher amounts with increase of λ. On the other hand, the height of the peak in Seebeck coefficient and power factor enhances with increase of spin–orbit coupling strength. At fixed temperature above 0.5 eV, Seebeck coefficient increases with λ. However, Seebeck coefficient is not affected by λ at fixed temperature below 0.5 eV. Also, PF grows with spin–orbit coupling strength at fixed temperature in the region 0.4 eV < kBT < 0.7 eV.
Figure 10. Left panel: Seebeck coefficient of disordered kagome lattice as a function of temperature kBT for different values of spin–orbit coupling at fixed scattering potential strength v = 0.3 eV. Impurity concentration is assumed to be n = 0.2. Right panel: Power factor of disordered kagome lattice as a function of temperature kBT for different values of spin–orbit coupling at fixed scattering potential strength v = 0.3 eV. Impurity concentration is assumed to be n = 0.2. |
Hence, we add few comments regarding regarding the distribution of impurity positions in the kagome lattice and their potential impact on the electronic and transport properties. Below, we provide additional clarification and address how different impurity distributions could affect our results.
Clarification of Impurity Distribution
In our study, we assume that impurity atoms are randomly distributed across all three sublattices (A, B, C) with equal probability. This assumption is consistent with the SCBA, where disorder is treated as an ensemble-averaged effect, preserving the statistical homogeneity of the system. The disorder potential is modeled as an on-site perturbation, meaning that impurity scattering is purely local (i.e., no long-range impurity-impurity correlations or clustering effects are considered).
Potential Effects of Sublattice-Dependent Disorder
We acknowledge that in kagome lattices, impurities localized on specific sublattices could lead to different physical effects:
1. Symmetry Breaking:
- If impurities preferentially occupy one sublattice, it could break the underlying C3 rotational symmetry of the kagome lattice. This could lead to sublattice-dependent renormalization of the density of states (DOS) and modifications to transport properties.
- In extreme cases, selective disorder could induce an energy gap or shift the flat band position, altering the system’s topological characteristics.
2. Modifications to Band Topology: Disorder-induced symmetry breaking can modify the topological properties of the kagome lattice, especially in the presence of spin–orbit coupling. For instance, if the disorder preferentially affects sublattice A, the effective hopping parameters could become anisotropic, modifying the band dispersion and potentially altering the anomalous Hall conductivity.
5. Conclusions
Using the tight-binding method and the Green’s function function, the general electronic structure of the disordered kagome lattice doped with impurity atom was analyzed, considering the effects of spin–orbit coupling. Materials with a kagome structure are typically metallic; tailoring their properties through energy gap engineering can transition into different topological phases, including semi-metallic, insulating, and semiconducting states. These phases are associated with diverse applications depending on their electronic properties. The unique geometry, bonding characteristics, and electron arrangement in kagome materials result in distinct behaviors in transport properties such as thermal and electrical conductivities. Also thermoelectric properties such as Seebeck coefficient, Lorenz number and power factor of disordered kagome lattice have been analyzed. In the spin–orbit coupling state, the displacement of energy bands and proximity to the Fermi level significantly influence electron positioning. This leads to intriguing variations in electronic responses, including transport and thermoelectric properties. The temperature behaviors of thermal conductivity, figure of merit and Lorenz number reaches the peak for each value of spin–orbit coupling. All transport and thermoelectric properties of the structure decrease as the scattering potential strength increases. The thermal conductivity and figure of merit also diminish with increasing impurity concentration at a fixed scattering potential strength.