Effects of Inhibitory Signal on Criticality in Excitatory-Inhibitory Networks *
|
Effects of Inhibitory Signal on Criticality in Excitatory-Inhibitory Networks * |
| Fan Wang,Sheng-Jun Wang |
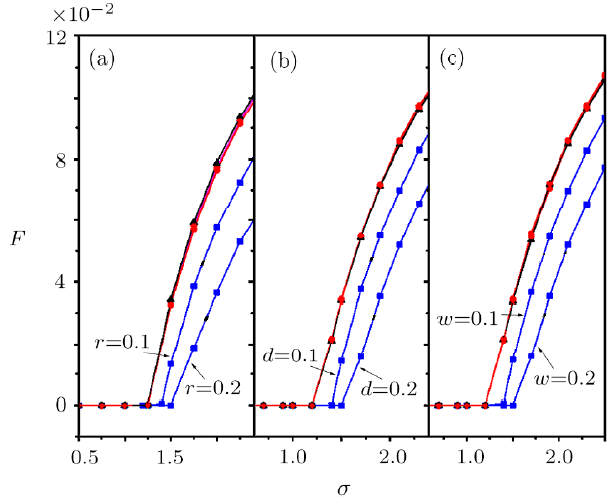
| Fig. 6 (Color online) Response curves (mean firing rate versus stimulus rate) for different fraction of decreasing the excitation (square) and inhibition (circle). The triangle points represent the network's mean firing rates in critical state. (a) In the case of removing a fraction ($r$) of excitatory nodes or inhibitory nodes, the $r=0.1,0.2$ are plotted separately. (b) In the case of deleting a fraction ($d$) of excitatory or inhibitory links, the $d=0.1,0.2$ are plotted separately. (c) In the case of weakening a fraction ($w$) of excitatory or inhibitory coupling strength, the $w=0.1,0.2$ are plotted separately. |
|
|