Stable Fano-like plasmonic resonance: its impact on the reversal of far- and near-field optical binding force

|
Stable Fano-like plasmonic resonance: its impact on the reversal of far- and near-field optical binding force |
| Hamim Mahmud Rivy,M R C Mahdy,Nabila Masud,Ziaur Rahman Jony,Saikat Chandra Das |
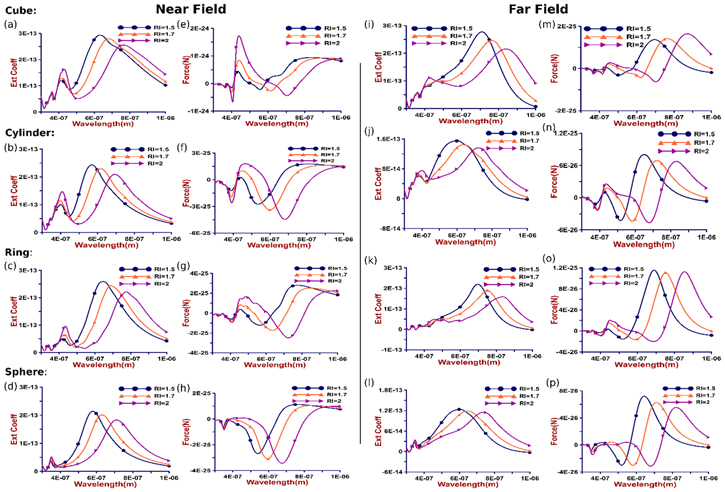
| Figure 9. The extinction spectra and binding force curves of both the near field and far field for three different refractive index values (RI = 1.5, 1.7, 2 respectively) of the three distinct lower background media, respectively. The first and second columns represent the near field, and the third and fourth columns represent the corresponding force curves. Figures (a)–(e) represent the extinction spectra, and figures (f)–(h) represent the binding force curves for the near-field tetramers. Similarly, figures (i)–(l) represent the extinction spectra, and figures (m)–(p) represent the binding force curves for the near-field tetramers. |

|