Ion-acoustic waves at the night side of Titan’s ionosphere: higher-order approximation

|
Ion-acoustic waves at the night side of Titan’s ionosphere: higher-order approximation |
| S M Ahmed,E R Hassib,U M Abdelsalam,R E Tolba,W M Moslem |
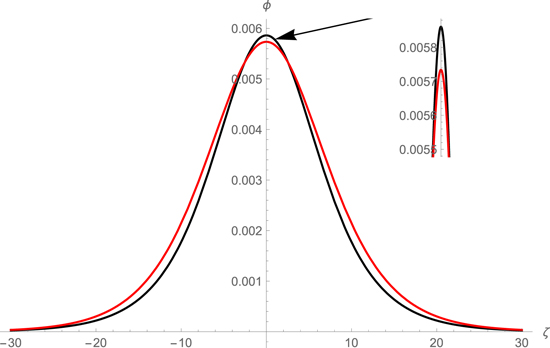
| Figure 5. A graph of φ(1) (red color) and ${\phi }^{(1)}+{\phi }^{(2)}$ (black color) versus ζ, where μ2 = 0.97, μ3 = 0.68, N2 = 0.22, N3 = 0.1, σ1,2,3 = 0.1, and $\lambda =0.8$. |

|