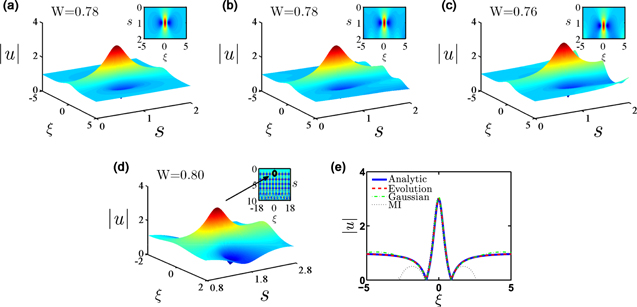
Figure A1. (a) The profile of the analytical rogue wave solution (10). (b) The evolution result by taking the analytical solution (10) as the initial value of propagation. (c) The propagating results by taking (8) as the initial value, here, A = 0.3, ω = 0.6, and C = 1. (d) The profile of the rogue wave by the numerical MI. The inset shows the sea of the rogue wave generated by MI. The FWHM of (a)–(d) are W = 0.78, 0.78, 0.76, and 0.80, respectively. (e) The cross sections of the profiles in panels (a)–(d) by taking a special s located at the peak value of rogue wave profiles. The blue solid line is the cross section of panel (a), the red dashed line for panel (b), the green dashed–dotted line for panel (c), and the black dotted line for panel (d).
|

