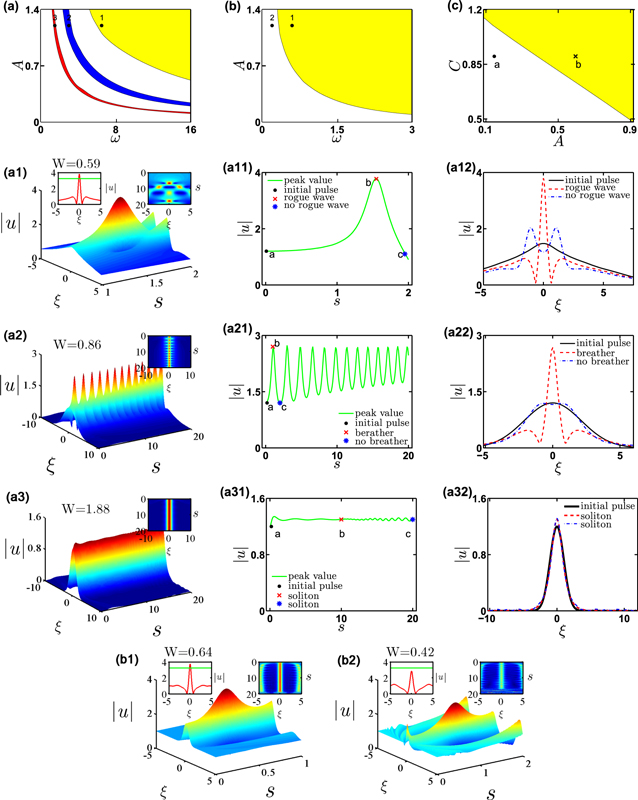
Figure A2. (a) The phase transition regions of nonlinear modes for NLSE (9) as the function of the initial amplitude A and width w when taking C = 0. (b) The phase transition curve of the rogue wave for NLSE (9) as the function of the initial amplitude A and width w when taking C = 1. (c) The phase transition curve of the rogue wave as the function of the initial amplitude A and the background height C. (a1)–(a3) The evolution results of the initial incident pulse (8) with these parameters corresponding to the black points 1–3 in figure A2(a), respectively. Here, A = 1.2, ω = 6.5, 3, and 1.45, respectively. The FWHM of (a1)–(a3) are W = 0.59, 0.86, and 1.88, respectively. (a11)–(a31) The peak amplitudes of the rogue wave, breather and soliton as the function of the propagation distance, respectively. (a12)–(a32) The profiles of nonlinear modes corresponding to points a–c of figure A2(a11)–(a31) denoted by the black solid line, red dashed line, and blue dashed–dotted line, respectively. (b1)–(b2) The evolution results of the initial incident pulse (8) with these parameters corresponding to the black points 1 and 2 in figure A2(b), respectively. Here, A = 1.2, ω = 0.6, and 0.2, respectively. The FWHM of figures A2(b1) are W = 0.64 and 0.42.
|

