Reconstructing f(T) modified gravity from ECHDE and ECNADE models

|
Reconstructing f(T) modified gravity from ECHDE and ECNADE models |
| A E Godonou,Ines G Salako,M J S Houndjo,Etienne Baffou,Joel Tossa |
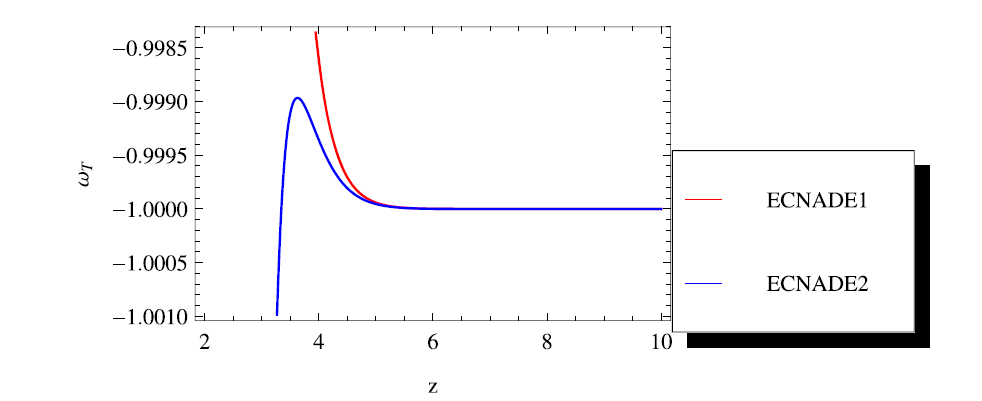
| Figure 2. Plot of ωT versus z. The curves of the ECNADE model are characterized as follows: red is for the first category ( |

|