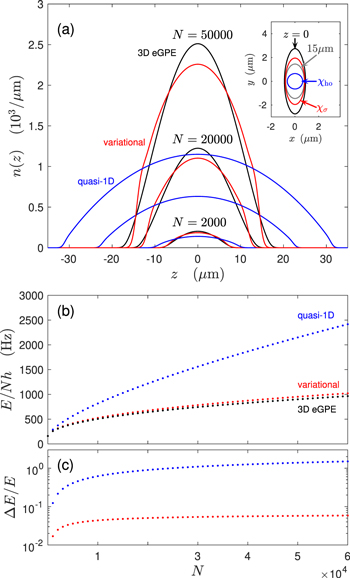
Figure 4. Comparison of line density profiles $n(z)=\int {\rm{d}}{\boldsymbol{\rho }}| {\rm{\Psi }}({\boldsymbol{x}}){| }^{2}$ and energies for a 164Dy condensate in a trap with ${\omega }_{x,y}=2\pi \,\times 150\,\mathrm{Hz}$, ${\omega }_{z}=2\pi \times 20\,\mathrm{Hz}$, for ${a}_{s}=100{a}_{0}$ and various atom numbers N. (a) The line density along the z-axis calculated using the 3D eGPE (black), variational (red) and the quasi-1D (blue) theories. Inset shows the 1/e density contours (relative to the density at ${\boldsymbol{\rho }}={\bf{0}}$) in the ${\boldsymbol{\rho }}$-plane for the various theories for N = 5 × 10⁴. The contour of the 3D eGPE solution is evaluated at z = 0 (black) and z = 15 μm (grey). (b) Energy per particle of the three theories and (c) error in the energy of the variational and the quasi-1D theories relative to the 3D eGPE results.
|

