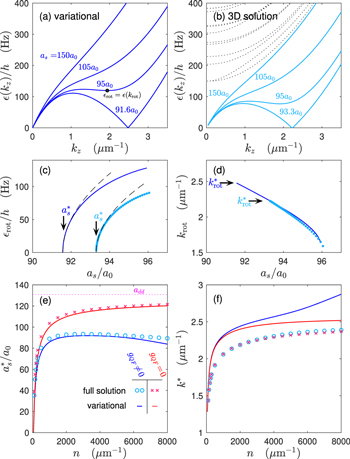
Figure 5. Excitation dispersion relations obtained from the (a) variational (dark blue) and (b) 3D (light blue) BdG theories for various values of as as labelled. In (a) the black circle indicates the roton coordinates (${k}_{\mathrm{rot}},{\epsilon }_{\mathrm{rot}}$) for ${a}_{s}=95{a}_{0}$. In (b) the higher excitations bands for ${a}_{s}=150{a}_{0}$ are shown (black dotted lines). The (c) roton energy and (d) roton wavevector as as changes for the variational (dark blue line) and 3D (light blue dots) theories. In (c) the critical value ${a}_{s}^{* }$ at which the roton energy goes to zero is indicated for each theory with an arrow and the fit function $\alpha \sqrt{{a}_{s}-{a}_{s}^{* }}$ (with α a fitting parameter) is also shown (dashed lines). In (d) the value of the critical roton wavevector (${k}_{\mathrm{rot}}^{* }$) when ${\epsilon }_{\mathrm{rot}}=0$ for ${a}_{s}={a}_{s}^{* }$ is indicated by an arrow for each theory. The roton critical values (e) ${a}_{s}^{* }$ and (f) ${k}_{\mathrm{rot}}^{* }$ as the system density changes. We compare the variational (lines) and 3D (symbols) theories both including (dark blue line for variational, light blue circles for 3D) and neglecting (red line for variational, magenta crosses for 3D) the quantum fluctuation term. Results for 164Dy with ${\omega }_{x,y}=2\pi \times 150\,\mathrm{Hz}$, and in (a)–(d) the density is n = 2.5 × 103 μm−1.
|

