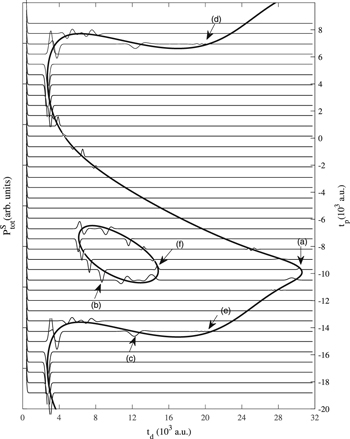
Figure 4. The horizontal thin curves show the plots of total population from equation (11) against the time delay td between the pulses of a double-pulse laser while changing the peak of the first pulse to be at different times $t={t}_{p}$. The remaining fixed parameters are the same as in figure 2. The total population has different positions and numbers of peaks for different times tp. Noting all the time delays td, corresponding to the peaks in the total population for each time tp, one may extract all the closed orbits existing in the system. The thick curve is the classical period of the closed orbits originating at different times based on equation (5). The closed orbits corresponding to the peaks are plotted in figure 5.
|

