Statistical mechanics of the directed 2-distance minimal dominating set problem

|
Statistical mechanics of the directed 2-distance minimal dominating set problem |
| Yusupjan Habibulla |
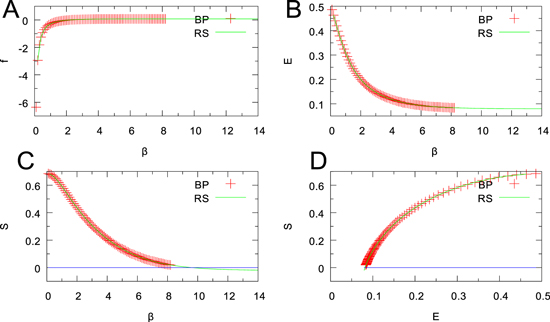
| Figure 3. RS and BP results for the D-2MDS problem on the RR random graph with the arc density α = 3.5 and N = 104 obtained using the BP equation and population dynamics. In subgraphs A, B, and C, the x-axis denotes the inverse temperature β while the y-axis denotes the thermodynamic quantity. In subgraph D, the x-axis denotes the energy density while the y-axis denotes the entropy density. |

|