Perturbative chiral nucleon–nucleon potential for the 3P0 partial wave

|
Perturbative chiral nucleon–nucleon potential for the 3P0 partial wave |
| Rui Peng,Songlin Lyu,Bingwei Long |
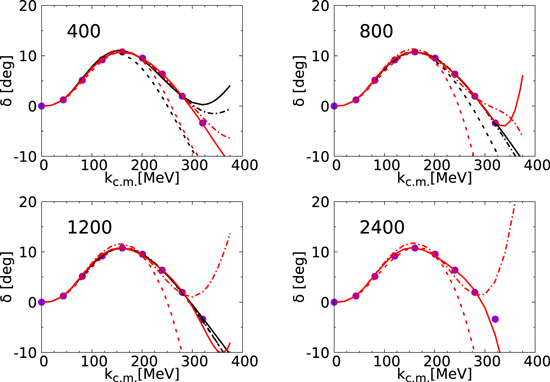
| Figure 2. The solid circles are the empirical phase shifts from the SAID program [ |

|