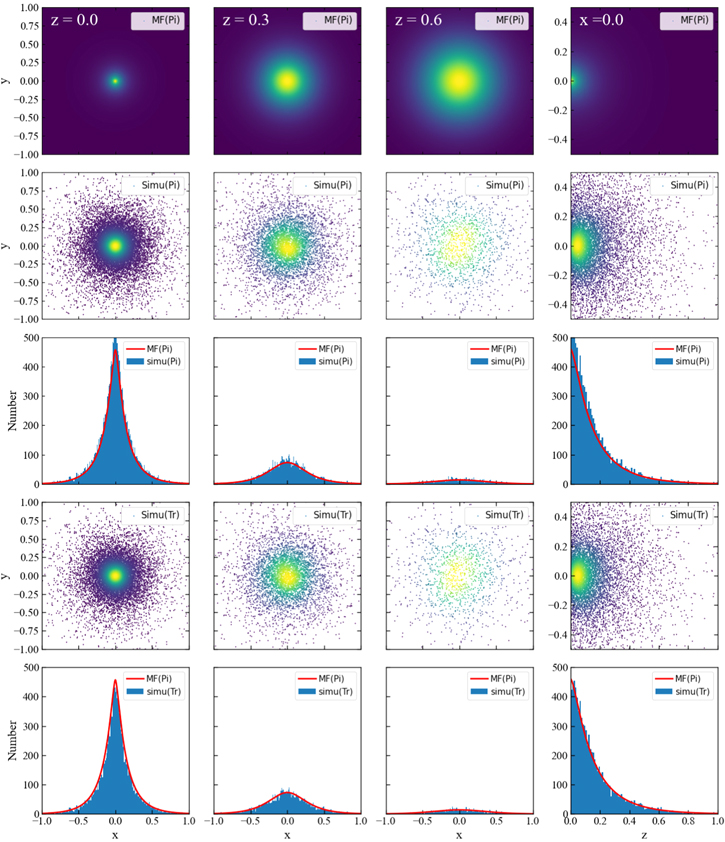
Figure 2. Spatial probability distribution of phosphorylation with νa = 10, νd = 10, νl = 20, and DK = 0.02 [35–38] from 107 stochastic simulations in CaM scenario. The panels in the first row are for results of phosphorylation events (Pi) in the mean field ansatz (MF). The panels in the second and fourth rows are for the simulation (Simu) results of phosphorylation events (Pi) and trajectories (Tr), respectively. And comparisons between simulation and mean field ansatz are given in third and fifth rows. The color of the scattering points is determined by Gaussian kernel density estimation. The first three columns are for slices at z = 0.0, 0.3, and 0.6, with thickness δz = 0.01, and the last column is for x = 0 with δx = 0.01.
|

