Power law decay of stored pattern stability in sparse Hopfield neural networks

|
Power law decay of stored pattern stability in sparse Hopfield neural networks |
| Fei Fang,Zhou Yang,Sheng-Jun Wang |
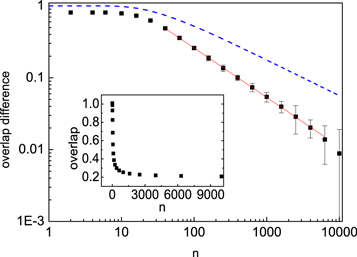
| Figure 10. The overlap difference φ − φ0 versus the number of patterns n on ER random networks on a log-log scale. The blue dashed line is the analytic results. Squares represent the simulation results. The red solid line is the fitted line. Data points from n=40 to 6500 are used in fitting. The parameters are N=10 000, average degree ⟨k⟩=50. Inset: the overlap φ versus the number of patterns n on random networks on a linear coordination. The final overlap φ0 is 0.19. Each data point is the average over 1000 realizations. |

|