Modeling the COVID-19 epidemic and awareness diffusion on multiplex networks

|
Modeling the COVID-19 epidemic and awareness diffusion on multiplex networks |
| Le He,Linhe Zhu |
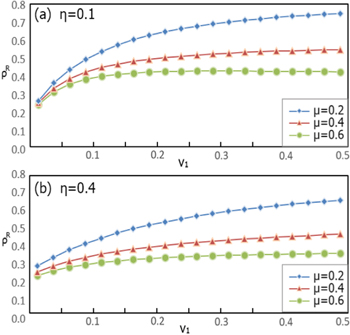
| Figure 7. The ratio of the recovered (ρR) in the stationary state varies with the parameters v1. In panel (a), the green, red and blue curves represent $\mu$ = 0.6, $\mu$ = 0.4 and $\mu$ = 0.2, respectively, and the parameter η is set as 0.1. In panel (b), the parameter η is set as 0.4. Other parameters are set as follows: $\delta$ = 0.5, δ = 0.4, β1 = 0.2, β2 = 0.2, β3 = 0.25, γ = 0.5, $\alpha$1 = 0.2, $\alpha$2 = 0.5, v2 = 0.1. |

|