Exploring the influence of microRNA miR-34 on p53 dynamics: a numerical study

|
Exploring the influence of microRNA miR-34 on p53 dynamics: a numerical study |
| Nan Liu(刘楠),Hongli Yang(杨红丽),Liangui Yang(杨联贵) |
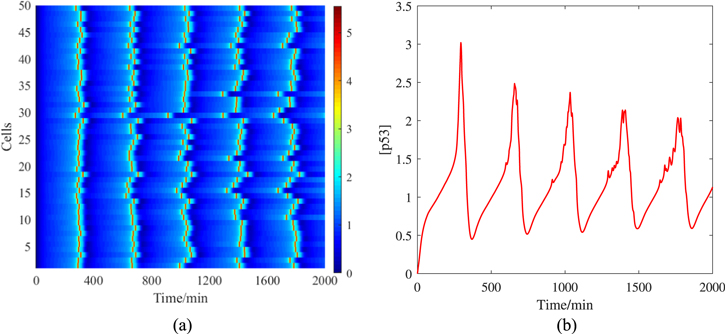
| Figure 3. Time series of [p53] under random simulation. The noise intensity D is set to 10−7. (a) is 50 single-cell samples, and the color bar represents the dimensionless concentration of p53. (b) is the average of 50 single cells. |

|