Exploring the influence of microRNA miR-34 on p53 dynamics: a numerical study

|
Exploring the influence of microRNA miR-34 on p53 dynamics: a numerical study |
| Nan Liu(刘楠),Hongli Yang(杨红丽),Liangui Yang(杨联贵) |
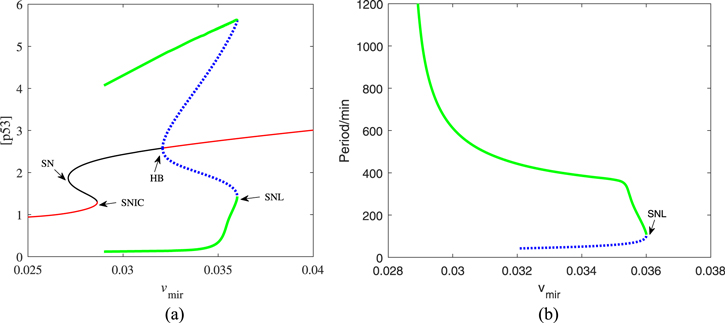
| Figure 5. (a) Codimension-one bifurcation diagram of [p53] versus the parameter vmir. The red solid and the black solid lines represent stable and unstable equilibria, respectively. The green solid lines and the blue dotted lines are the maxima and minima of stable and unstable limit cycles, respectively. (b) The oscillation period as a function of vmir. The green solid lines and the blue dotted lines are the period of stable and unstable limit cycles, respectively. |

|