Exploring the latest Pantheon SN Ia dataset by using three kinds of statistics techniques

|
Exploring the latest Pantheon SN Ia dataset by using three kinds of statistics techniques |
| Shuang Wang,Xiaolin Luo |
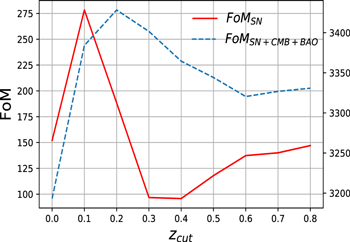
| Figure 2. FoM values given by different zcut, for wCDM. The solid red line represents the results constrained only by SN samples. The blue dashed line represents results constrained by the combined SN+BAO+CMB data. |

|