Reservoir-engineered entanglement in an unresolved-sideband optomechanical system

|
Reservoir-engineered entanglement in an unresolved-sideband optomechanical system |
| Yang-Yang Wang,Rong Zhang,Stefano Chesi,Ying-Dan Wang |
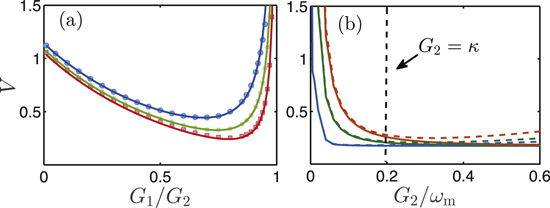
| Figure 4. Comparison of the numerical and analytical results. (a) V versus |

|